Inflation And Counterfeit Credit
Let’s take a look at an often-repeated idea that is popular in the gold and alternative investing communities. The government possesses a printing press. Therefore, it will never default. It will just inflate its way out of the debt. It will devalue the dollar.
The government does not set the value of the dollar. And it has no mechanism to set it. So, logically, it has no mechanism to reset it. It cannot devalue it. In the same way, you cannot lower yourself down by your bootstraps since you are not lifting yourself up by them in the first place.
We must emphatically state that the government does not print. It borrows. Congress does not have a printing press, to create greenbacks. It has a Treasury that can sell bonds to cover whatever payments the government is obligated to make that it has not got tax revenues for. Over the past year, for example, the government increased its debt by over 630 billion dollars.
This leads us to inflation. We have a different view than the mainstream. We define inflation as the counterfeiting of credit. In legitimate credit, the borrower has both the means and intent to repay. But clearly in the case of perpetual government deficits, these elements are lacking. This is inflation. Not the changes that may result to consumer prices. Not the change in quantity of dollars. The fraud itself is the root of it, and therefore properly deserves the moniker inflation.
The Federal Reserve, of course, is a key participant in this monetary inflation scheme. Does the Fed have a printing press? Does the Fed print?
Like any bank, the Fed borrows to fund its purchases of interest-paying assets. It earns a spread between what it pays (currently about 1.25%) and what its asset portfolio pays (over 2%). The commercial banks currently deposit over $2.1 trillion in excess reserves, and the Fed’s total liabilities are over $4.4 trillion including Federal Reserve Notes (on which the Fed pays zero). Unlike any commercial bank, there is a law that obligates us to treat the Fed’s liabilities as if they were money.
This last fact is what makes the inflationary scheme so dangerous (not the possible effect on consumer prices). The Fed borrows to lend to the government (and manipulate the interest rate). This means: the Fed’s liability, the dollar, is only good so long as the Fed’s asset, which is the government’s liability, is good. Please re-read that and think. This one statement is the undoing of much of modern monetary economics.
Of course, with the Fed’s liability being treated as money by nearly everyone—including those who oppose the existence of the Fed, and who speculate on alternative monetary assets like gold and bitcoin—the Fed is in a unique position. Demand for its liability is unlimited. That is, whatever it wants to borrow, willing lenders are lined up. Not only that, it gets better!
Last week, we said:
So let’s say you are a farmer in Iowa. What can you do about your debt? Grow and sell more wheat. That is, sell wheat at the bid price.
Suppose you are a restaurateur with 5 burger joints. What can you do? Cook and sell more burgers. That is, sell burgers on the bid.
If you are a recent college graduate, with college loans to pay off, what can you do? Work and sell more of your labor. That is, dump labor on the bid.
And we wonder what supports the value of the dollar! It is the struggles of the debtors. Every debtor is busily working to increase the quantity of every kind of good and service, which is dumped on the bid. Dumping on the bid tends to push the bid down.
People are not merely lined up to lend to the Fed, they are outdoing each other, frantically bidding up the Fed’s paper! This is because they, themselves, have borrowed and obligated themselves to repaying their own debts in the same said paper. To service their debts, they must sell goods and services.
And people wonder why little to no inflation. They are thinking only of the quantity of dollars, and assuming that as quantity goes up so must prices. However, a system which is sinking deeper into debt has dynamics that cause a different outcome.
So this brings us to the premise where we started: the government will just inflate its way out of the debt. The government can borrow more, but will this devalue the dollar?
Instead of reiterating a point we have covered above and in previous parts of this series, let’s look at a seemingly unrelated observation about markets. When all participants count on the same outcome, when they are all all-in, when they are all on one side of the boat hoping for this outcome, then you can count on the opposite outcome that all the participants are counting on.
The government is in debt up to its eyeballs, the banks, the corporations, the small businesses, the homeowners, the students, the car owners, and even the consumers with credit cards and the former students who attended university in the last decade or two. Everyone owes. Everyone relentlessly bids on the dollar with whatever they have.
The outcome they all count on is: the dollar will go down. That is not the outcome they are getting, or will get.
We realize that many people think the good goes up and the bad goes down. That is why they expect gold to be $65,000. We are not saying the dollar is good. Quite the contrary. We do not use the words counterfeiting and fraud to mean anything good. We are saying that when government applies perverse incentives, then you get perverse outcomes.
A rising dollar is a perverse outcome.
We are working on the problem that all borrowing and lending uses the dollar. We offer gold financing, simplified and a yield on gold, paid in gold.
------------
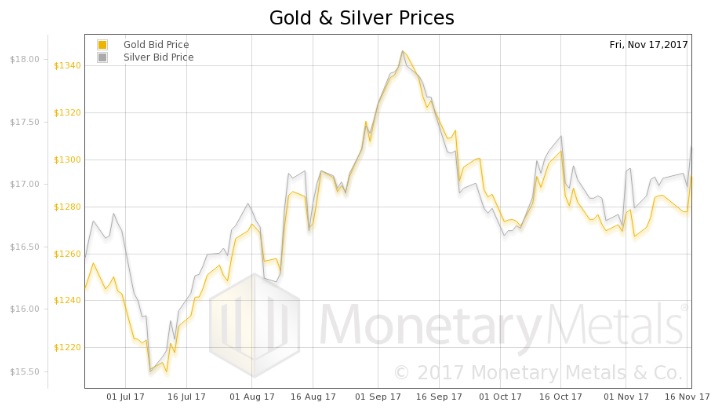
The price of gold went up $19, and the price of silver 42 cents. The price action occurred on Monday, Wednesday and Friday though so far, only the first two price jumps reversed. We promise to take a look at the intraday action on Friday.
But first, we want to clarify something in light of our ongoing commentary about the struggles of the debtors and the lack of drivers for rising consumer prices. Just because farmers and restaurateurs are frantically producing and selling like mad, which results in soft prices, does not mean that people cannot begin to buy gold in earnest again.
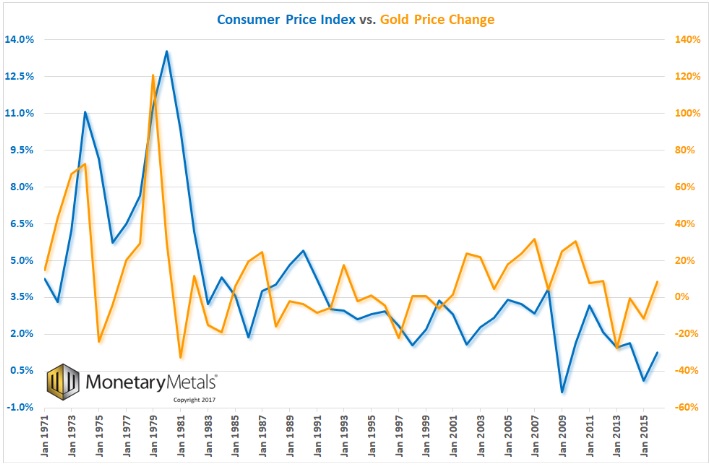
There is not a causal relationship between consumer prices and the price of gold. At times, they can be highly correlated, but then the correlation ends. For example, did you know that the age of Miss America correlated with the number of murders by steam and hot things for 10 years? Let’s look at a chart.
NB: we had to put the two numbers, change in consumer prices and change in gold price on two different axes. Though both are percentage changes, gold changes are so much larger that if plotted on the same axis, consumer prices look almost a flatline.
You can see a tantalizing relationship between the two traces, at least for a time. At first (we began the graph in 1971 when President Nixon cut the dollar loose from gold), there is a striking correlation.
But then there is a marked change post-1981, and if there is a correlation (we have not done the math), it looks much more tenuous. This is when Reagan and Volcker beat inflation (in the mainstream Narrative), or objectively when interest began to fall, when marginal productivity of debt began its uncanny correlation with interest (which we believe is causal), and when yield purchasing power begins to show a kind of hyperinflation.
Offhand, we can think of two reasons to buy and own gold: participate in speculative mania and avoid default risk. Right now speculative mania is occurring in crypto currencies so that may (but not necessarily, beware correlation!) shunt such capital flows away from gold. As to default risk, there are signs of rising stress in high yield credit markets, but it’s early yet.
Here are the charts of the prices of gold and silver, and the gold-silver ratio.
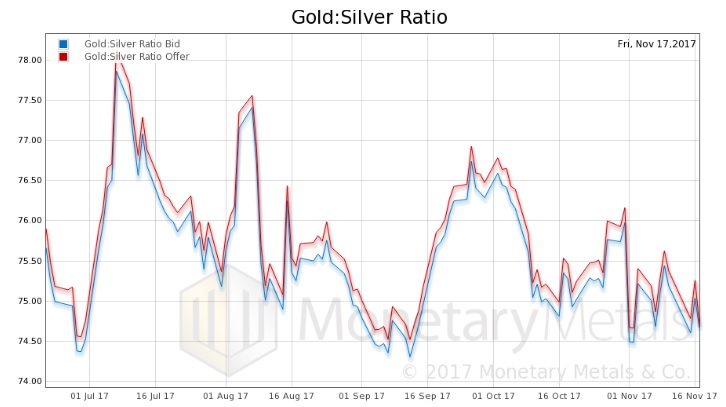
Next, this is a graph of the gold price measured in silver, otherwise known as the gold to silver ratio. The ratio fell.
In this graph, we show both bid and offer prices for the gold-silver ratio. If you were to sell gold on the bid and buy silver at the ask, that is the lower bid price. Conversely, if you sold silver on the bid and bought gold at the offer, that is the higher offer price.
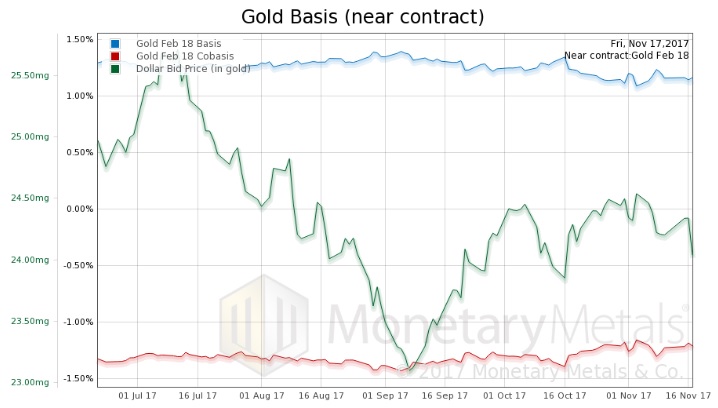
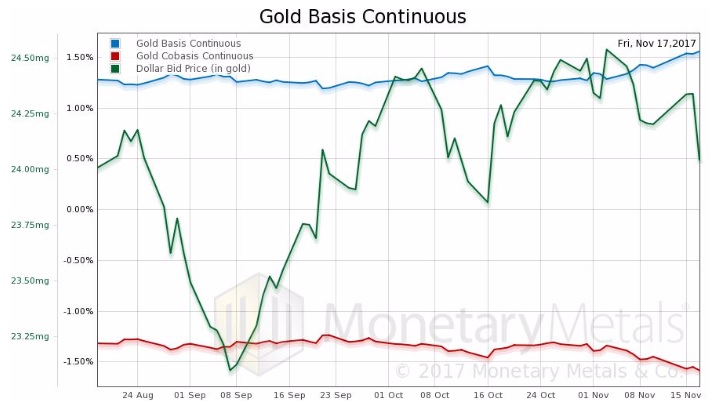
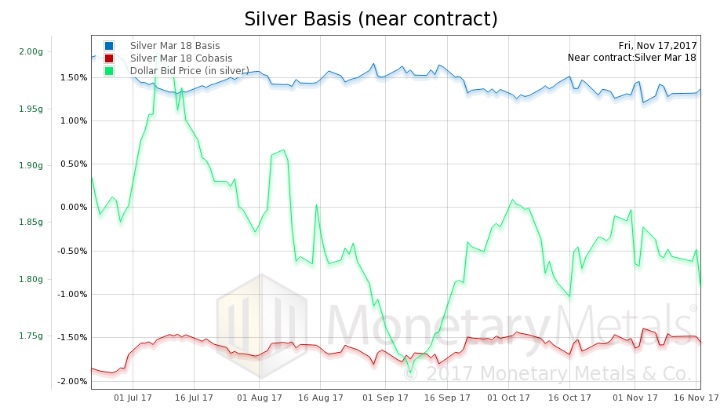
For each metal, we will look at a graph of the basis and cobasis overlaid with the price of the dollar in terms of the respective metal. It will make it easier to provide brief commentary. The dollar will be represented in green, the basis in blue and cobasis in red.
Here is the gold graph showing gold basis and cobasis with the price of the dollar in gold terms.
We switched from the December to February contracts.
The cobasis (our measure of scarcity) of the Feb contract does not show much. Let’s take a look at the continuous basis.
Here, we do see a tracking with the price of the dollar (inverse of the price of gold, in dollar terms). So what’s going on? Why does the near basis not show what the continuous basis does?
Here is a graph of all the contracts.
We see a noticeable widening of the spread between near and far contracts. This is a steepening of the forward curve. At the end of August, there was less than 20bps difference between the Feb 2018 and Feb 2019 contracts. Now, there is 65bps, and 35bps between Apr 2018 and Feb 2019 contracts.
When a price changes, it may or may not be significant (which is rather the meta-point of this Report). But one thing is for sure. When a spread changes, it is telling you something. What is this telling us?
Since bottoming about a month ago, farther-out contracts have a rising basis. The Feb contract, by contrast, does not. We think it’s a bit early for the contract roll dynamics (and this is gold, not silver, which generally waits longer).
The obvious answer is that speculators are bidding these contracts up. But in this case, it is not relative to spot but relative to the near contract. We are skeptical that speculators would suddenly switch their preference longer-dated contracts.
We don’t know the answer but we suspect it may be the lifting of hedges either in the gold mining sector, or perhaps more likely, the bullion dealers. We know that retail product premia are low, due to low retail demand. It seems plausible that dealers would reduce their hedge positions. Since hedging involves buying physical metal product and selling futures (which tends to compress the basis), lifting a hedge involves selling the product and buying the futures. Which tends to push the basis up, and not necessarily the near contract basis. The basis of whichever contracts were used for hedging. It could be longer contracts.
We welcome reader input to explain this phenomenon.
Now let’s look at silver.
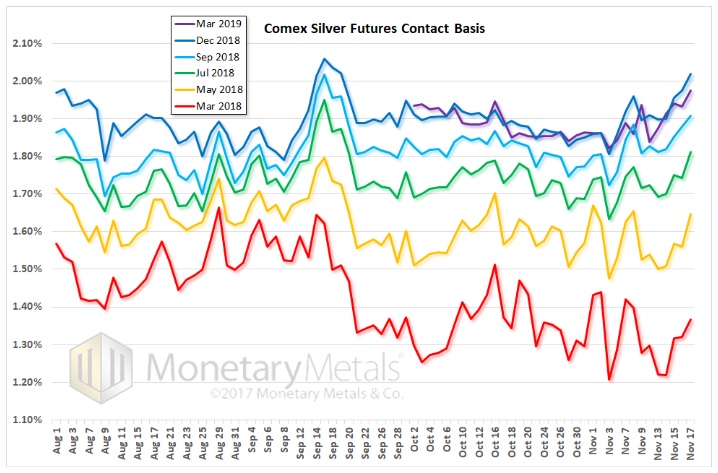
The story is the same in silver. The graph below of all the silver contracts shows some widening of the spread between near and far contracts but not to the same magnitude as gold.
In contrast to gold, the basis is flat across all the silver contracts with possibly some increase developing in the further out contracts from November onwards.
Now, on to Friday’s spike. Is it like last Friday’s crash, i.e. speculators repositioning?
In Part II of this article, we show intraday graphs for both metals.
© 2017 Monetary Metals



 Dr. Keith Weiner is the CEO of Monetary Metals and the president of the


