Inter-Market Analysis Say Bye to Gold, Silver, Oil & Equities


After a 10-week rally traders and investors are starting to think twice about dumping money into stocks. Since March, we have seen the equities market rally 30% -- and now everyone is starting to think prices are a little top heavy.
So what do we do now if the market is possibly forming an intermediate (6-10 week) correction?
I like to hedge my long-term holdings (retirement account). These are stocks which were purchased near the market bottom and are paying high dividends. Using options or leveraged inverse funds I hedge my positions until the market looks to be bottoming again. I like to play the much shorter term trades which last 1-20 days using the triple leveraged funds like FAZ and TZA.
In this regards picking a top is much more difficult than catching a bottom, in my opinion. Market tops form much slower in general than a market bottom, so you have to be patient for the market to roll over.
Trading a bottom is easier for me. After a big sell off when prices start to show bullish price action all the short positions start to buy back their shares surging prices higher. Then the slow traders (investors) start to buy on the strength which can carry over for a few days. The recent 10 week rally was extended much longer than normal because so many investors were getting excited about the cheap stocks and they began dumping money into the market. Not to mention institutions are back nibbling on stocks again.
Below I show a little on inter-market analysis. Inter-market analysis is one topic/skill which novice investors don't pay much attention to when first starting out. Inter-market analysis allows us to take advantage of the financial markets as a whole.
For example: When the US Dollar is in a strong rally, we will generally see gold and silver prices selling off. This is a very basic and simple relationship. It's very important to remember that everything in the financial markets affect each other in some way.
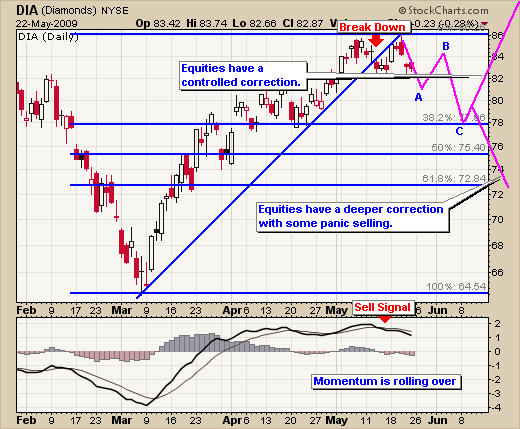
Dow - DIA Exchange Traded Fund
You can see in the chart below the equities market has two possible scenarios. While nothing is ever set in stone and analysis can change on a daily basis this is what I see most likely happening over the next month. Equities will either continue to rally higher or pull back to test lower levels of support and possibly make a new multi year low but that's still weeks away and my analysis will change on a weekly basis as the price action unfolds providing new possible setups.
Depending on what the equities market does from here will alter the course of gold, silver and oil which is explained below.
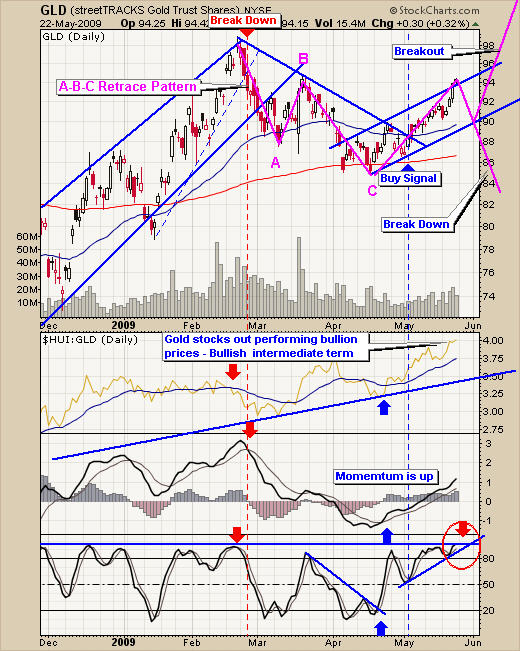
Gold Trading - GLD Exchange Traded Fund
Gold has been moving up because of fears that the equities market is topping out. I have found several relationships between stocks and commodities that really help predict short term movements.
Relationship Trading Tip - In My Opinion, & Trading Style:
- Gold stocks generally move or out perform gold bullion before gold really starts to move. They also do the same in reverse; under performing means gold is most likely going to have some short-term weakness.
- Gold during times of inflation fear moves in the opposite direction of stocks. So if the stock market continues lower gold will most likely move higher.
- Gold bullion sold down in March, 15 days before the broad market rallied. Now gold is rallying which indicates stocks are about to fall.
That being said gold stocks have been advancing at a very fast rate out performing the price of gold bullion, which is bullish for gold. Gold bullion started moving higher 15 days ago as money started to move back into this safe haven because of fears that the stock market is going to go down from here.
In my opinion, gold is a little over bought, and we could see a pullback with some profit taking here. However, overall I think gold has a lot more upside potential.
It is always important to think ahead of what may happen to gold prices. Knowing when to exit your position to lock in profits while still leaving enough wiggle room for prices to continue higher is crucial to a trader's success.
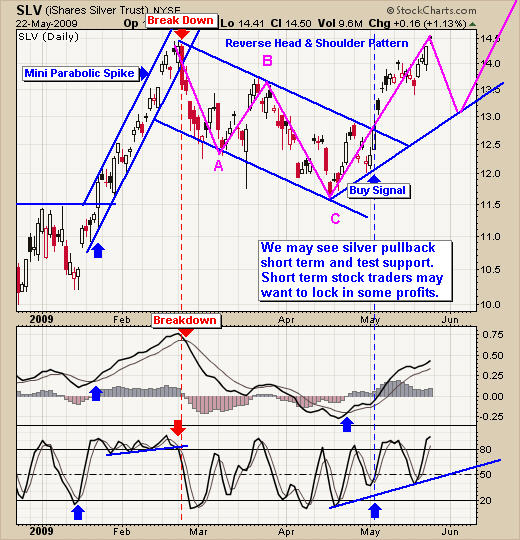
Silver Bullion - SLV Exchange Traded Fund
Silver is doing much the same as gold. Silver shows a really nice looking (inverted) head and shoulders pattern, and if things unfold that way we could see a breakout to the up side sending silver to $17-$18.
Just to show you some other ways technical traders see this chart would be:
- Reverse Head & Shoulder
- 4 Month large bull flag
- Small possible bull flag (May - June)
- Cup & Handle (if we get a pull back, which is drawn on the chart)
- Double Top (if price rolls over and drops sharply)
So many people see different patterns which is why we all buy and sell at different times. The key to making money consistently in the market is to find or create a trading model what fits your personality, then learning how to scale in and out of trades to locking in profits, add to winning positions or cutting your losses. These are the types of things I focus on which is how I grow my trading accounts over time.
Energy Sector - Stocks & Oil
The energy sector has had a very nice run recently, but it looks like the ride may be over for a few weeks.
The chart below of the Bullish Percent Index of energy stocks shows that the last time energy stocks were this bullish (over bought) the broad market corrected. There are several sectors over bought and when most stocks are in bullish patterns, which means its time for a correction. This is because everyone is buying up stocks pushing them higher and traders are becoming complacent.
We are now at the same situation as we were in Late January, and I think we will see the broad market correct. The energy sector I expect will make 15-30 day correction. Depending if we have heavy selling or controlled profit taking will dictate price action and time frame. Heavy selling will give a sharp sell off in prices while controlled profit taking will allow energy stocks to trend sideways before the next leg higher.

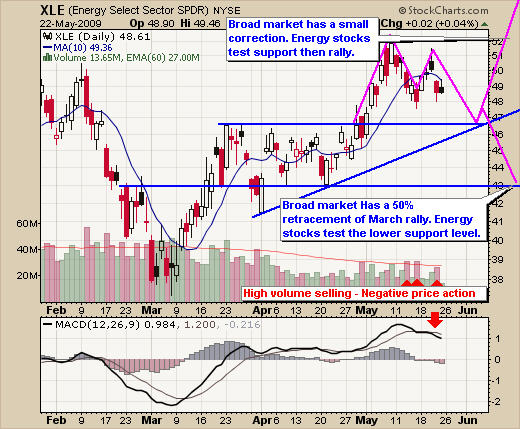
Energy Stocks - XLE Exchange Traded Fund
A sharp panic sell off in the broad market will send energy stocks much lower breaking a support trend line. If we see profit taking, which is when traders exit some of their positions slowly while new traders buy or add to their positions then prices will trend sideways then continue to rally, in my opinion.
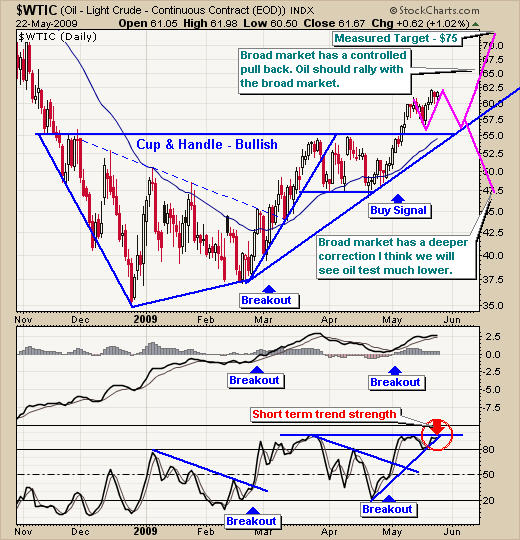
Crude Oil - Continuous Contract
In the past oil would move in the opposite direction of the equities market but in recent months they have been moving together. Again if the markets only pull back a little before starting the next rally higher I think we will see oil move much higher. However, if the market starts to slide on heavy volume it will most likely pull oil down with it.
As the economy gets worse there is less demand for oil because of the decline in traveling, new products, house hold income, etc…
Active Trading Conclusion
My analysis is telling me that we are likely to see the broad market decline over the next few weeks. How far will it go? No one knows that, but being ready and positioned for it is important.
My concern is that large investors & institution are going to step back in at any time, which will surge the market higher and trigger the next round of buying. Most traders including me will panic and put some money to work so that we don't miss the next rally and that panic is what skyrockets the market higher.
Emotions are very difficult to control, which is why you must have a trading plan complete with entry and exit levels for when investments start to move. It's important to remember that when the market is topping out it's a process not an event. Expect it to roll over slowly and drift lower. There is a point when panic selling will set in, and we will see prices slide several days in a row. That is the time to be tightening our stops taking profits on our short positions.
I would like to say we are in a bull market but again no one every really knows 100% what the market is doing. Trading is all about being positioned to take advantage of high probability moves, locking in profits on spikes, adding on dips, cutting losses quickly and or exiting the position on a trend line/technical breakdown.
Currently, it looks like gold and silver are ready for some type of pullback. I have tightened our stops and will look for an entry point to add to our core gold position after a pullback.

Chris Vermeulen has been involved in the markets since 1997 and is the founder of Technical Traders Ltd. He is an internationally recognized technical analyst, trader, and is the author of the book: 7 Steps to Win With Logic
Through years of research, trading and helping individual traders around the world. He learned that many traders have great trading ideas, but they lack one thing, they struggle to execute trades in a systematic way for consistent results. Chris helps educate traders with a three-hour video course that can change your trading results for the better.
His mission is to help his clients boost their trading performance while reducing market exposure and portfolio volatility.
He is a regular speaker on HoweStreet.com, and the FinancialSurvivorNetwork radio shows. Chris was also featured on the cover of AmalgaTrader Magazine, and contributes articles to several financial hubs like MoneyShow.com.
More from Gold-Eagle


