Interest Rates And Gold


 It is commonly assumed that the gold price and interest rates move in opposite directions. In other words, a tendency towards higher interest rates is accompanied by a lower gold price. Like all assumptions about prices, sometimes it is true and sometimes not.
The market today is all about synthetic gold, gold which is referred to but rarely delivered. The current relationship is therefore one of relative interest rates, because positions in synthetic gold, in the form of futures and forwards, are financed from wholesale money markets. This is why a rumour that interest rates might rise sooner than expected if it is reflected in forward interbank rates, leads to a fall in the gold price.
To the extent that this happens, the gold price has been captured by the modern banking system, but it was not always so. The chart below shows that rising interest rates were accompanied by a higher gold price in the 1970s after 1971.
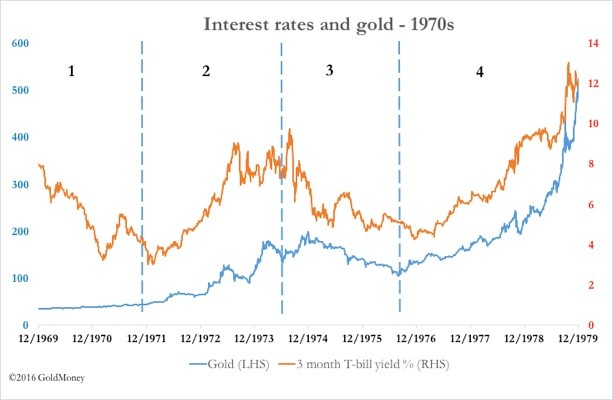
We can divide the decade into four distinct phases, numbered accordingly on the chart. In Phase 1, to December 1971, interest rates fell and gold increased in price, much as today’s market expectations would suggest, but from then on until the end of the decade a strong positive correlation between the two is clear. So why was this?
Those of us who worked in financial markets at the time may remember the development of stagflation in the late sixties and into the first half of the seventies, whereby prices appeared to be rising without a corresponding increase in underlying demand for the goods concerned. This put central banks in a difficult position. In accordance with post-war macroeconomic thinking, monetary policy was (as it is to this day) one of the principal tools for promoting economic growth, and so the lack of growth was put down to insufficient stimulus. Therefore, monetary policy was diametrically opposed to the higher interest rates needed to counter increasing price inflation. The result was central bankers wished for low-interest rates but were forced by markets into raising them, which they did reluctantly and belatedly. This is the logical reason the gold price rose to discount the increasing rate of price inflation, instead of being suppressed by increasing interest rates. This was Phase 2 on the chart.
Stagflation was very evident up to the end of 1974. Dollar price inflation measured by the producer price index increased by over 25% that year, reflecting higher oil prices imposed by the OPEC cartel. Inflation measured by the CPI peaked at 12%. Equity markets collapsed, with the Dow halving and London’s FT30 falling by over 70% from its 1972 high. In London, the secondary banking crisis, triggered by rising interest rates, led to the failure of banks which had loaned money to property developers, resulting in a financial crash in November 1973. Again, mainstream economists were confounded, because the collapse in demand following that crisis should have led to deflation, but prices kept on rising.
The gold story was not just a simple one of belated and insufficient rises in interest rates, as the economic runes suggest. The riches endowed on the Middle East from rising oil prices benefited, in western terms, a backward society which invested a significant portion of its windfall dollars in physical gold. This was natural for the Arabs, who believed gold was money and dollars were a sort of funny paper. Investing in physical gold was also recommended to them by their Swiss private bankers. The recycling of petrodollars into gold routinely cleaned out the US Treasury’s gold auctions, which failed to suppress the rising gold price.
The financial crisis and the associated collapse of stock markets in 1974 lead us into Phase 3 on the chart. Interest rates declined after the stock markets began to recover from the extreme depths of negative sentiment at that time. The gold price also declined, with the price almost halving from just under $200 in December 1974 to just over $100 in August 1976. It had become apparent that the financial world would survive after all, so bond yields fell while stock markets recovered their poise during that period. Fear subsided.
Again, the gold price had correlated with interest rates, this time declining with them. We then commenced Phase 4. From 1976 onwards, economic activity stabilised and price inflation picked up later that year, with the dollar CPI eventually hitting 13% in 1980. Interest rates rose along with price inflation, and gold ran up from the $100 level to as high as $850 at the London PM fix on 21 January 1980. For a third time, the gold price correlated with rising interest rates.
From the history of the 1970s, we have learned that today’s non-correlating relationship between gold and interest rates cannot be taken as normal in future market relationships. Admittedly, derivative markets and the London bullion market were not as well-developed then as they are today. But they certainly were in gold’s next bull market, from the early 2000s to 2011. However, the comparison with the seventies is the more interesting, particularly given the emergence of stagflation at that time.
While official inflation figures today show the relative absence of price inflation, much of that is down to changes in the way it is calculated. John Williams of ShadowStats.com estimates that inflation today, calculated as it was in the eighties, runs consistently higher than official figures suggest. He reckons it is currently at about 5%. And the Chapwood Index, compiled quarterly including 500 commonly bought items in 50 American cities, records price inflation at 1970s levels, closer to 9%.
As always, official statistics such as the CPI should be treated with immense caution, as John Williams’s and the Chapwood inflation estimates confirm. But even the suppressed official CPI is likely to rise beyond the Fed’s 2% target within a year from now if the recent increases in prices of raw materials and energy hold. This is because the negative factors that have suppressed the index, such as the oil price, will soon be dropping out of the back-end of the statistic, giving the CPI an upward boost. Furthermore, rising raw material and energy prices will have little to do with the level of economic demand in the US because the US economy is no longer the driver for commodity prices. That role now belongs to China, which plans to use vast quantities of raw materials for domestic economic and Asia-wide infrastructure development, and accordingly is beginning to stockpile them.
On this simple analysis, we can see how domestic US prices could record a significant rise without any increase in domestic demand. In other words, the conditions now exist for the stagflation that became so pernicious from the late 1960s onwards. The question then arises as to how the Fed will respond.
One thing hasn’t changed over the decades, and that is central bankers’ assumptions that prices are tied, however loosely, to demand. This is the text-book basis of the inflation target, which assumes that a 2% inflation rate is consistent with sustainable economic growth. There is, in conventional macroeconomics, no explanation for stagflation, despite evidence the condition exists.
No one is more surprised than the forward-thinking members of the Fed’s policy-making committees, who anticipate the same dilemma that their predecessors faced in Phase 2 of our chart of the 1970s. The US economy will be stagnating while price inflation is rising. The Fed will be torn between the need to keep interest rates low to stimulate credit demand, and raising interest rates to control price inflation. Only this time, a rise in interest rates and bond yields averaging no more than two percent could be curtains for the Fed itself, because the losses on its bond investments, acquired in the wake of the financial crisis and through quantitative easing, will easily exceed its so-called capital.
The dynamics behind the gold market are however different now from the early seventies. Debt levels today are so high they risk destabilising the whole financial system, making it impossible for the Fed to raise interest rates much without causing a financial wipe-out. Asian governments, such as the Chinese and the Russians are known to have been accumulating strategic positions in physical gold, and the Chinese and Indian populations along with other Asian people have also exhibited notable appetites for physical metal. Instead of starting from a position where the US Treasury on its own in 1969 still held 14% of estimated above-ground stocks, its holding is officially at less than 5% of them today. That is, if you believe it still has the stated 8,134 tonnes.
This time, the gold price is likely to be driven by physical shortages in the old world, as American and European investors wake up to stagflation, their central bank’s interest rate dilemma, and the loss of physical liquidity from their vaults.
Today’s market set-up, particularly if Chinese demand for energy and commodities materialises in accordance with her new five-year plan, looks like replicating the early stage of Phase 2 in the introductory chart to this article. Gold increased fivefold from $42 to a high of about $200 in three years. The circumstances today have notable differences, not least the launch-pad of negative interest rates. But we can begin to see why, despite the near-infinite growth of derivatives as a price-control mechanism, it could be mistaken to assume that the link between interest rates and gold is normally one of non-correlation, and will continue to be so.
********
Alasdair Macleod
HEAD OF RESEARCH• GOLDMONEY


