The Inverse Dollar Relationship, SPX & Fear


So far this week we have been seeing fear creep in the equities market. This Wednesday we started to see fear (green indicator) reach a level which tells me to start looking for the market to bottoming. I do follow a few other charts and indicators which warn me of a possible trend reversal (high probability setup) before it takes place but the US Dollar and selling volume are key.
As we all know, when the market is trying to top and roll over it tends to be more of a process than a couple day event. It's this lengthy topping process which has a lot of choppy price action which sucks traders into a position much to early or shakes you out of the position before the market does what you anticipated.
On the flip side, bottoming is more of an event because it tends to happen after a strong wave of panic selling. Fear is the most powerful force in the market (other than the Fed/Manipulators.. but that's another topic). That being said, when you know what to look for in bottoms you can generally see the market starting to bottom and prepare for it.
The charts below of the US Dollar Index and the SPY clearly show the inverse relationship they have. Right now it seems everything is directly connected with the dollar… it has been like that for most if the year… I will note that its not normally this clear. Anyways, the dollar is currently trading at resistance which means there is a good chance it will turn back down. So if the dollar drops, then it should boost the SPY (equities market) and put in a bottom for stocks.
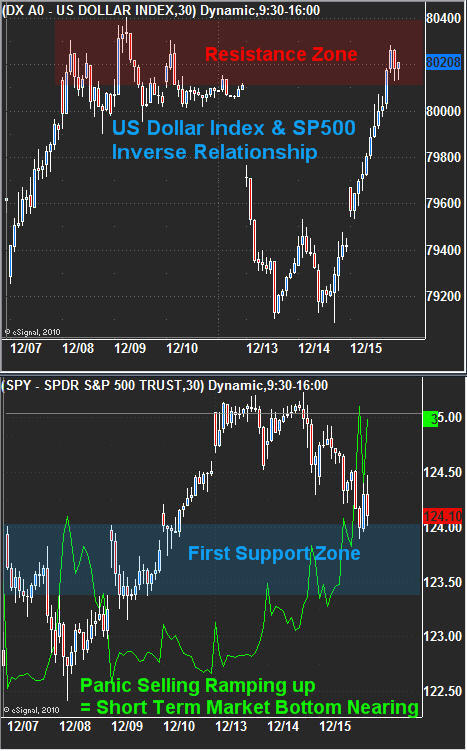
Looking at the lower chart of the SPY ETF you can see that recent prices have dropped down to a support zone. The important thing to note here is how selling volume is ramping up. This to me means more traders are getting worried and are cutting their losses or locking in gains before it gets worse. We typically see panic selling enter the market near the end of pullbacks. Just like in a bull market where the retail trader (John Doe) is the last to buy before the market falls, it's the same but flipped in a down trend. The retail trader is the last to panic and sell out of their position before the market bounces/rallies.
Currently the equities market looks to be showing signs that a bottom is nearing. Over the next session or two the rest of this equation should come to light as a tradable bottom or to start playing the down side of the market, only time will tell…
********
If you would like to learn more and get my trading alerts along with my pre-market morning videos so you know what to look for in the coming session I recommend taking up a subscription with my ETF trading newsletter here: www.TheGoldAndOilGuy.com
Chris Vermeulen

Chris Vermeulen has been involved in the markets since 1997 and is the founder of Technical Traders Ltd. He is an internationally recognized technical analyst, trader, and is the author of the book: 7 Steps to Win With Logic
Through years of research, trading and helping individual traders around the world. He learned that many traders have great trading ideas, but they lack one thing, they struggle to execute trades in a systematic way for consistent results. Chris helps educate traders with a three-hour video course that can change your trading results for the better.
His mission is to help his clients boost their trading performance while reducing market exposure and portfolio volatility.
He is a regular speaker on HoweStreet.com, and the FinancialSurvivorNetwork radio shows. Chris was also featured on the cover of AmalgaTrader Magazine, and contributes articles to several financial hubs like MoneyShow.com.


