It’s a Bubble, and It’s Intact
 share
share
 share
share
 share
share
 share
share
 share
share
The bubble in ‘no holds barred’ monetary policy (birthed under Alan Greenspan) and the bullish markets it benefits are in their third decade.
Gold, meanwhile, will not be ready until the “post” bubble.
Introduction
This is an article from a source, yours truly, who considers it his job to define the ‘top down’ macro before trying to pick stocks. In other words, it is important to get the big picture macro, as well as its shorter-term rotations, right before trying to select stocks. In an extreme example, the gold mining sector has been most often impaired by the ‘bubble on’ macro, including its inflationary phases, not helped by it. “Post-bubble” will be a different story.
In the year 2001 Sir Alan Greenspan was forced to abandon his stately “Maestro” image in favor of a more desperate, even panicky version of himself. That desperation was put into effect by the various inflationary means used to birth and blow the credit bubble, which launched the real estate/mortgage bubble and eventually, the great stock market bull that persists to this day. This is ancient history (2003-2008), but it was an important time when we as market participants were taken down the rabbit hole, whether we liked it or not. Fittingly, the end of this historical phase resolved in a righteous market liquidation of Q4, 2008.
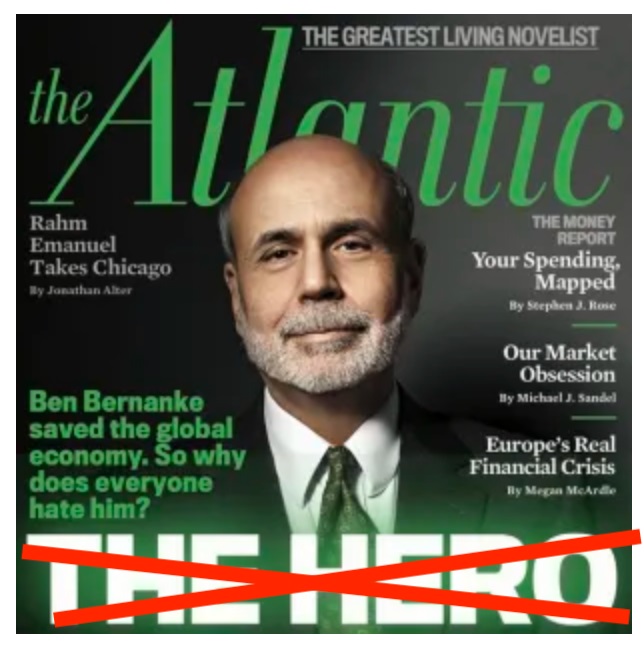
 By then it was Ben ‘the Hero’ Bernanke’s turn to try his hand at inflationary bubble making, and inflationary bubble-make he sure did. New and unusual methods of QE/Bond Manipulation/ZIRP and a new twist on things in order to “sanitize” (the actual word the Fed used back then) inflation signals out of the macro, aptly named Operation Twist.
You think this was anything remotely resembling normal? This ‘twist’ not surprisingly came after the Bernanke Fed had cooked up inflationary operations of its own that were threatening to point a finger right at these big brained monetary/economic intellectuals that were primary in creating every inflation problem since 2001. Inflation begins with money printing by various means. The pure definition is inflation of money supplies chasing finite assets. Inflation was turned on like a spigot whenever our remote controlling monetary managers wished. Later, in its effects come the cost-push inflationary problems like those of the recent cycle.
The Federal Reserve actually saw the potential for its previous inflationary episodes (Greenspan era into the Bernanke era) to get out of hand and concocted a bond market manipulation scheme to paint inflation right out of the picture. And guess what? The market bought it. Market players bought it. Lapped it up like dogs. They kicked the 10yr-2yr yield curve into a flattening phase and Goldilocks flavored economic boom. That was generally the 2013 to 2019 era generally attended by a strong US dollar.
To this day, the dogs devour every morsel thrown their way and their confidence in our monetary regulators is intact, by definition. Every time a still hot economic or inflation signal comes in the market quakes in its boots, and that includes the anti-bubble, gold. Confidence = intact. Gold is for when “intact” becomes “unglued”.
Hence, the only thing a right minded market participant can do (excluding the vast majority who still think it’s normal as their financial advisers continue to cost average up into nosebleed territory) is not short it in committed fashion, play it from the long side with risk management or sit and collect the cash income that the Fed is paying you to take advantage of.
As for speculating from the long side, what has been working best over the last year is what we originally projected a year ago, the Goldilocks stuff, as a market in full submission to the Fed’s every utterance from its various orifices continues to view ‘cost-push’ inflation implied in the January Payrolls report and even a slight uptick in Manufacturing (we’ll take a brief look at the latest ISM in this weekend’s NFTRH report) with fear of the Fed, which in turn has been driving the US dollar.
So confidence is intact, by definition. Markets are flat out bullish. AI is going to make us all rich (well, I sold SMCI too soon, collecting only a +/- 70% profit on two separate trades). Actually, I had to sell SMCI just as I had to sell ANET before it because my DNA directs me not to be a hype follower and by extension, anything resembling a committed bubble player.
This graph produced by John Hussman was taken from a more extensive article, which you may want to check out. Feel free to reference the NFTRH Links page any time, as you’ll find Doc Hussman and many other worthwhile sources there (market tools, economic data, industry news/analysis, biased and unbiased analysis alike, and so much more). I’ve built that links page for my own reference. Why not bookmark it for yourself?
Here Hussman illustrates in one picture that our bullish markets and strong economy are the products of leverage. In an ongoing bubble this does not matter. In a bursting bubble? Well, it matters.
John Hussman
So the above is a bullish picture at high risk because it is the product of leverage to a growing debt pile and by extension, deficits. That is what the economy and associated bull market are built upon. Play it if you will, but also understand it for what it is. For those submitting to the Fed’s every utterance (not to mention to their mainstream financial advisers’ assurances that they are professionally managing their wealth in the ways of tradition) it’s all good… as long as the bubble in policy and associated markets and thus, confidence are intact.
Other indicators we use in NFTRH show what we have been noting for months; that the market is two things… 1) bullish and 2) at high risk. To save room for more pointed discussion about invididual equities and strategy in the upcoming NFTRH 796, I’ll drop a cavalcade of our indicators in this public article for subscribers and the public alike to review.
Again, I want to remind you that the Goldilocks link above is from a year ago when nobody else was talking “Goldilocks” and a relative few were talking bullish in general. I point that out because when I write highly negative articles like I perceive this one to be, proven credibility (that I’ve not been a perma-bear, perma-bug or perma anything else to this point) is important. I simply have to write about what I see and I don’t care whose agenda it may or may not serve.
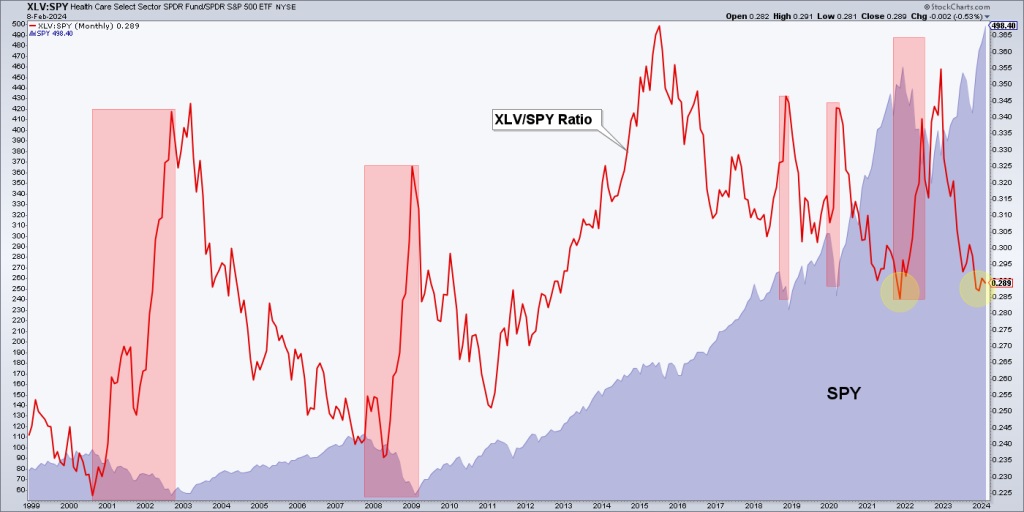
On that note, risk is play in the form of sentiment and in the form of other indicators like the extreme low in the defensive Healthcare sector to the broad SPX. The XLV/SPY ratio has historically and reliably spiked upward into and during bear markets and hard corrections. The exception was 2012 – 2016 when there was a lot of Healthcare related political noise in the picture. The ratio shows high risk to equities and yet a still bullish situation.
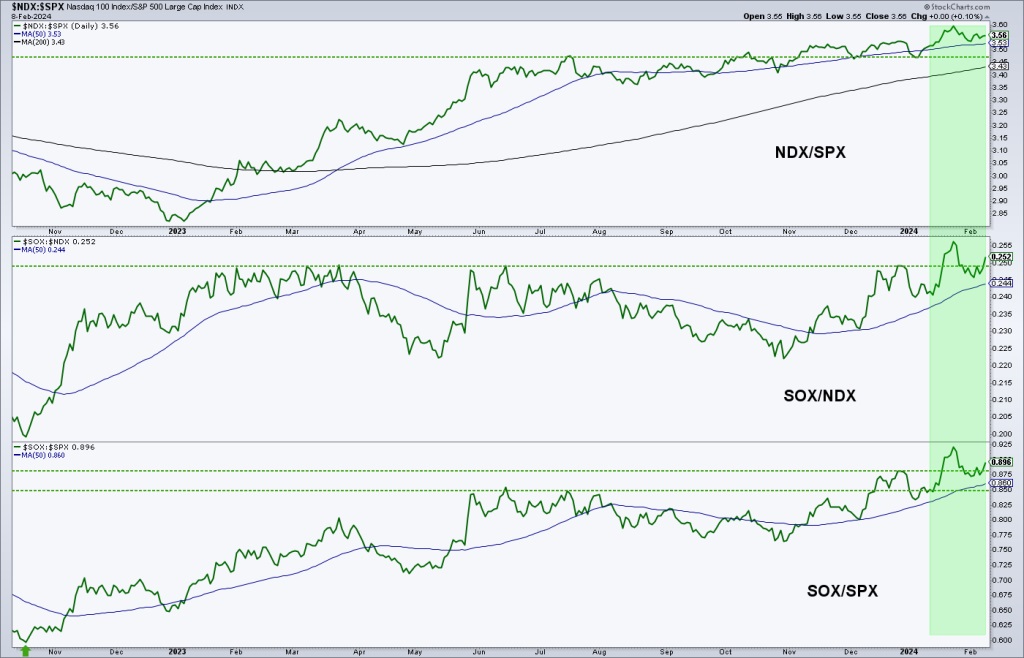
Speaking of a still bullish situation, the Semiconductor > Tech > Broad leadership chain has been a staple in NFTRH, keeping us from attempting an active bearish orientation and/or keeping us with a bullish view (risk and all). SOX leading NDX and NDX leading SPX is the bullish leadership recipe. It’s intact, if not yet fully baked.
As for gold, it is not yet signaling either a bear market or an illegitimate * bull market for stocks. During the un-shaded period from 2002 to 2011 the stock market spent the majority of the time in an apparent bull market. Stocks were going up! Gold went up better. Currently, SPX/Gold shows stock bulls sleeping soundly.
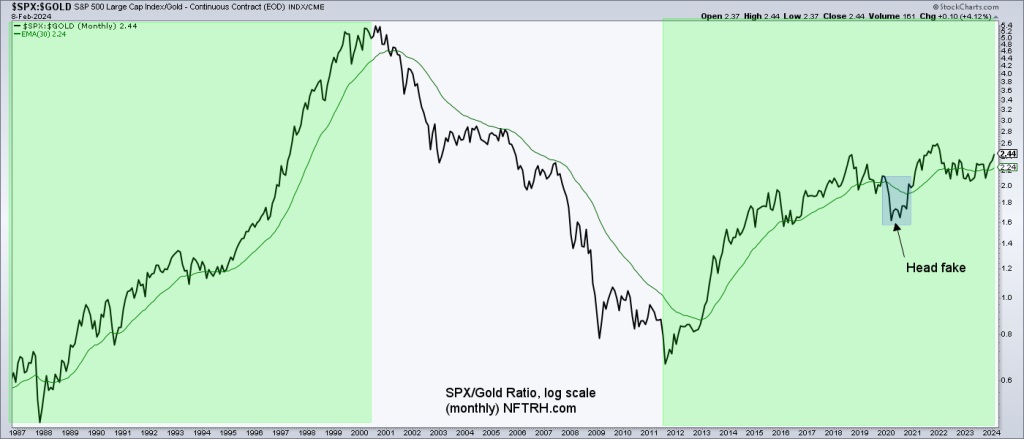
* Well, that’s debatable considering the majority of charts in this article. But work with me here.
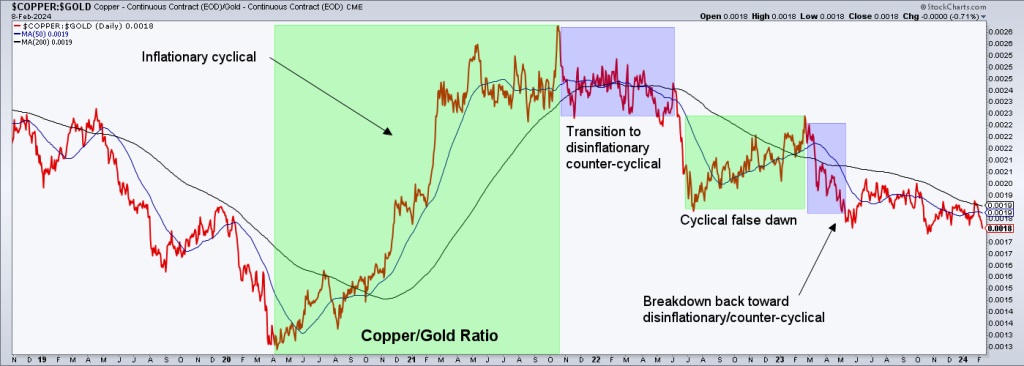
However, the Copper/Gold ratio shows that aside from the ‘strong dollar’/Goldilocks stuff, a down economic cycle and stock market bear are just itching to come into play. Post-election, perhaps? Can they hold it together that long? NFTRH 795 put on its tin foil hat last weekend and took a hard look at that question, both pro and con.
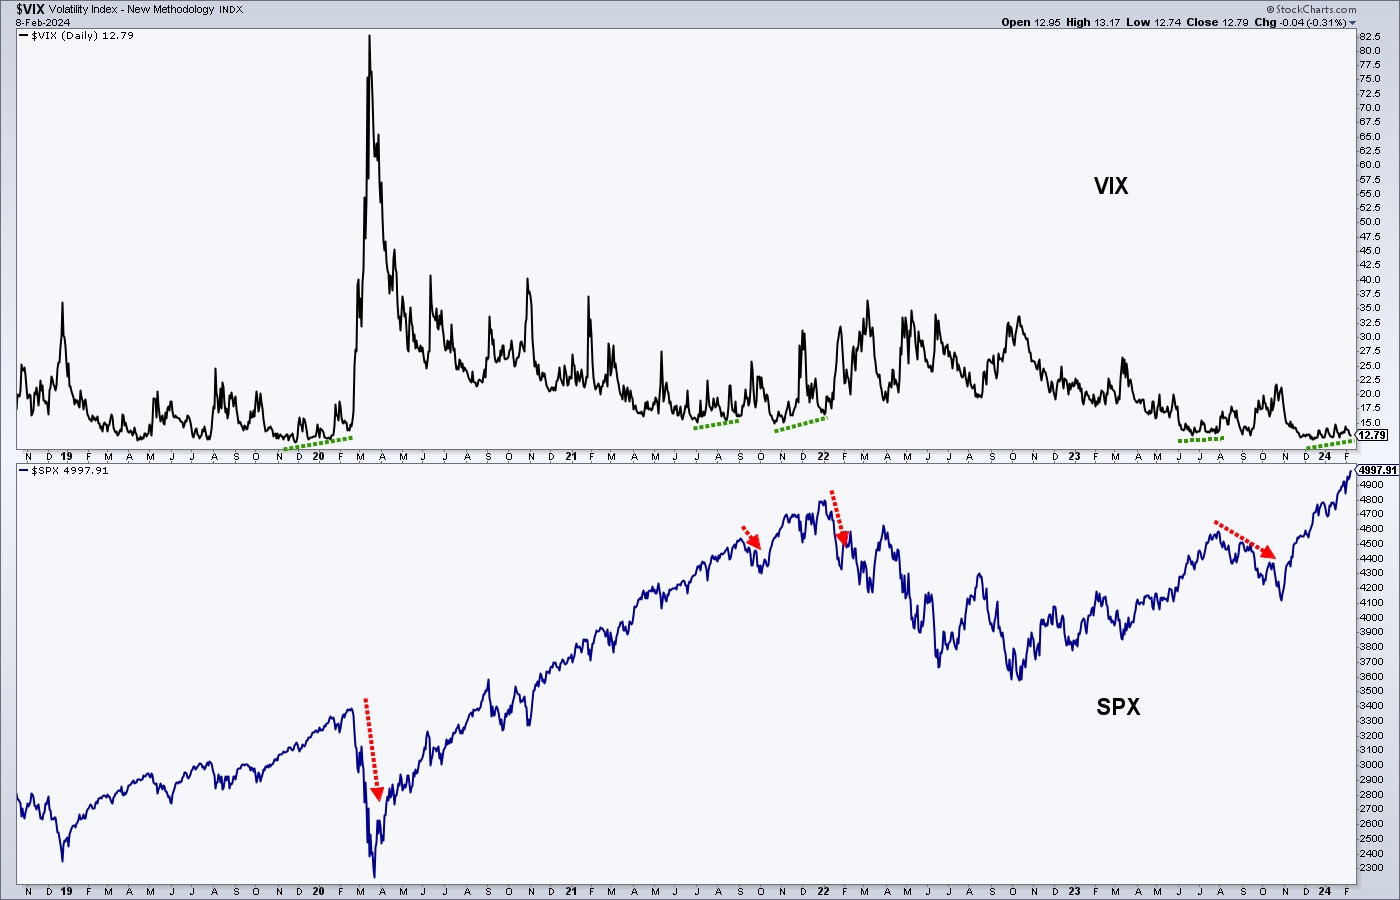
Meanwhile, another risk indicator to a still bullish market situation is the current state of the VIX vs. the bulling SPX. It’s not a major thing, visually. But historically the VIX has tended to travel at least flat with a positive bias prior to SPX corrections. Today? Well, VIX is traveling with a positive bias in defiance of the big bull move in SPX.
We anticipated, if not predicted a bull move in SPX, after all. Here is a chart I’ve shown publicly on several occasions as 2023 went about its business of building a higher risk situation with the desired ingredient to make a truly high risk situation being a higher high in SPX. The anticipation was for anything from a slight higher high double top to an upside ‘suck ’em in’ FOMO extravaganza and upside blow off. The market is agitating for the latter now.
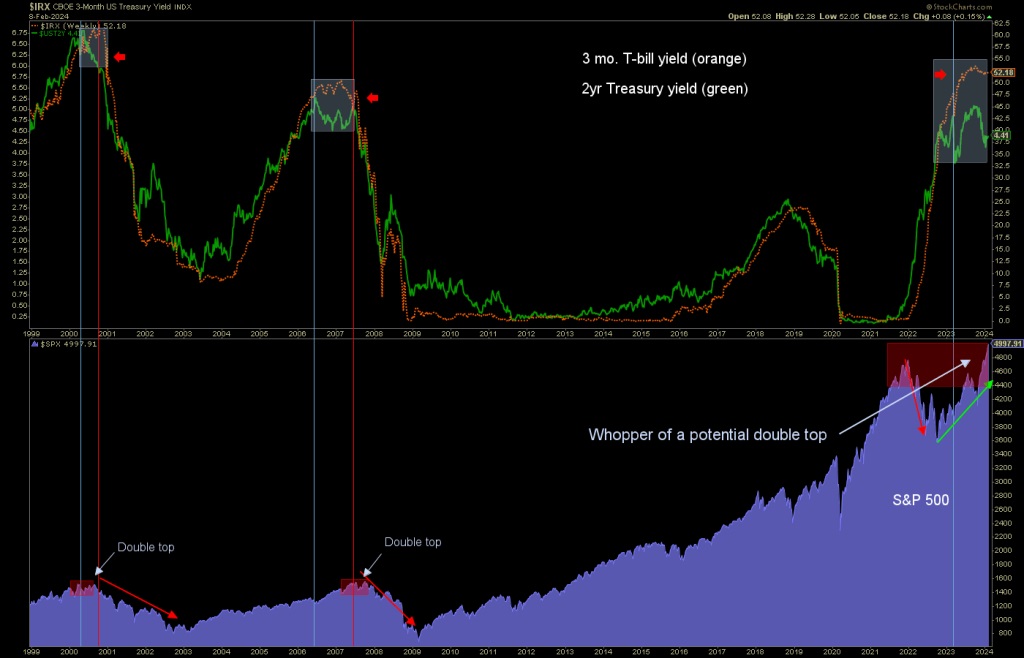
With respect to the above, ironically the recent bump up in Fed hawkishness could sustain the bull longer than if they had remained stapled to the March rate cut view. It’s when the Fed is finally compelled to start cutting to get in line with the declining 2yr yield that max bear damage has been inflicted. I don’t say so. The chart and history say so.
There are many more indicators we use. From Libor Yields to High Yield Spreads to yield curves and more that are currently telling us the…
Bottom Line (as per NFTRH for much of the last year)
- The stock market – especially in its headline areas – is bullish and…
- The stock market is at high risk.
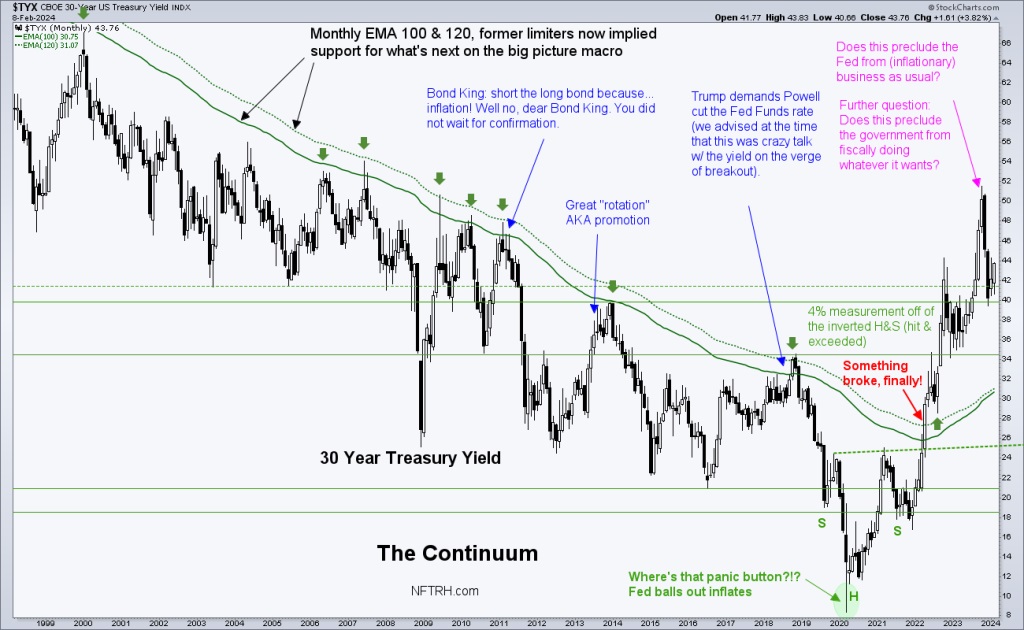
Gold, not mentioned much in this article, nonetheless lays in wait for the post-bubble *. I’ll continue to respect the idea that a major post-bubble indicator kicked in in 2022. That would be in the in the form of the king of NFTRH indicators, the Continuum, which after years of keeping us aware that inflationary policymakers were in full control (the Continuum indicated pleasant disinflation, after all) smashed its limiting moving averages. And you wonder why today’s Fed is so zealous about fighting inflation?
* “Post-bubble” will be the only macro that will sustain an extended and potentially epic move in the gold mining industry because by then the gold mining product’s relationship to cyclical and risk ‘on’ asset markets will leverage the miners’ bottom lines to the upside. This is the Bob Hoye playbook, but it’s been elusive over the bubble years (decades) and it’s still not quite time yet.
For “best of breed” top down analysis of all major markets, subscribe to NFTRH Premium, which includes an in-depth weekly market report, detailed market updates and NFTRH+ dynamic updates and chart/trade setup ideas. Subscribe by Credit Card or PayPal using a link on the right sidebar (if using a mobile device you may need to scroll down) or see all options and more info. Keep up to date with actionable public content at NFTRH.com by using the email form on the right sidebar. Follow via Twitter@NFTRHgt.
*********
share
share
share
share
share
More from Gold-Eagle


