Japan's New Export: Inflation


The price action of gold has been relatively “tame” recently, despite all the drama and emotional excitement created by the US government shutdown.
In the big physical markets of Asia, China's imports have surged, but India's have been crushed by government regulation.
With imports down by as much as 90% in India, gold refineries are losing a lot of money. In the big picture, refinery closures are bullish for gold, but investors need a lot of patience.
If Indian smuggling is accounted for, it could be argued that overall Asian gold demand is roughly the same now as it was at this time last year. That's price-neutral news for gold.
If the Indian government restrictions didn't exist, gold prices would probably be much higher than they are now. Unfortunately, the restrictions do exist, and most bank analysts believe that US central bank tapering of the QE program will cause more investor selling.
Essentially, the super-crisis of the West is in a “lull”, and Asian demand is “mixed”. Value-oriented investors and institutions are gold buyers, but the overall gold market can probably be summarized as “soft”.
The market has a floor of physical demand under it, but that floor is more like a sponge than a layer of bedrock.
Since gold rose to sell-side HSR (horizontal support and resistance) in the $1410 - $1430 area, I've suggested that gold market investors should buy nothing, unless the price declined to $1266.
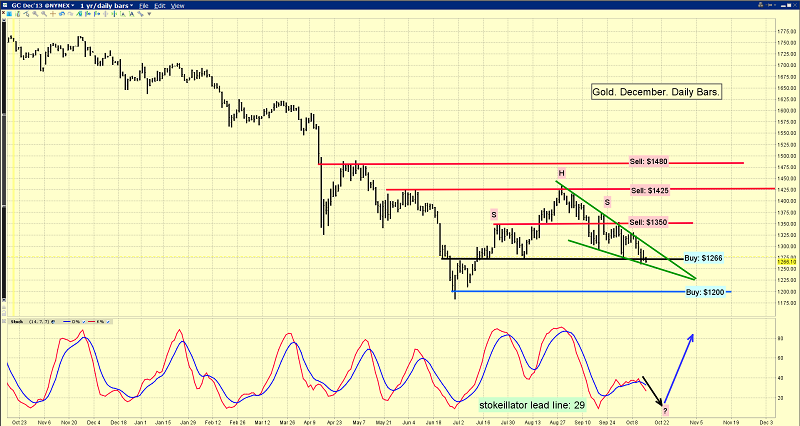
That's the daily gold chart. Gold did touch the $1266 area last week, and it's trading there again today.
Unfortunately, the $1266 - $1275 area is arguably the neckline of an ugly head and shoulders top pattern. I've highlighted that HSR line in black.
The technical target of this top pattern is about $1120. Gold traded between $1523 and $1923 for quite a long time, and it could be argued that the technical target of that range breakdown is also about $1120.
The green bullish wedge pattern is still intact, but its demand line is being severely tested. Note the position of my stokeillator (14, 7, 7 Stochastics) at the bottom of the chart. It's a bit of a mess, and there's a crossover sell signal in play.
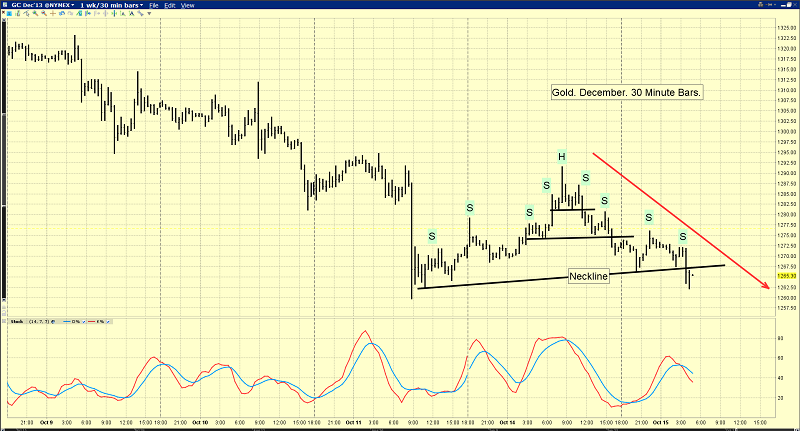
That's a 30 minute bars chart for gold. It's also very bearish, at least in the short term.
For many years, some analysts in the gold community have argued that the comex gold market is “manipulated by the banksters”. I don't know if the market is manipulated or not, but I do know that a number of mainstream analysts have begun to express serious concerns about some sizable gold trades that were recently executed on the comex.
Art Cashin is the director of NYSE floor operations for UBS bank. He's recently been quoted by some mainstream media, as well as by the gold community, questioning why thousands of comex gold contracts have been sold at once, “at the market”. Worse, it's apparently happened on several occasions.
Professional fund managers normally sell their positions at a rate that the market can handle, without creating wild price movements. If gold sales are being made unprofessionally, it's understandable why powerful analysts like Art Cashin would be concerned about the motives of the sellers.
Regardless, in the big picture, my firm view is that global cost push inflation will be created by the “excessive” use of quantitative easing by the Japanese central bank. I expect that Japan's biggest export will become cost push inflation.
The financial condition of the government of Japan is much worse than most other governments. That means that money printing, in the form of QE, can get out of control much more easily than in other nations.
If the current volume of Japanese QE continues for another year or two, or even accelerates, I expect serious inflation to occur.
On that note, I've suggested that the price of sugar is perhaps a better lead indicator of a surge in the global inflation rate than gold or silver.
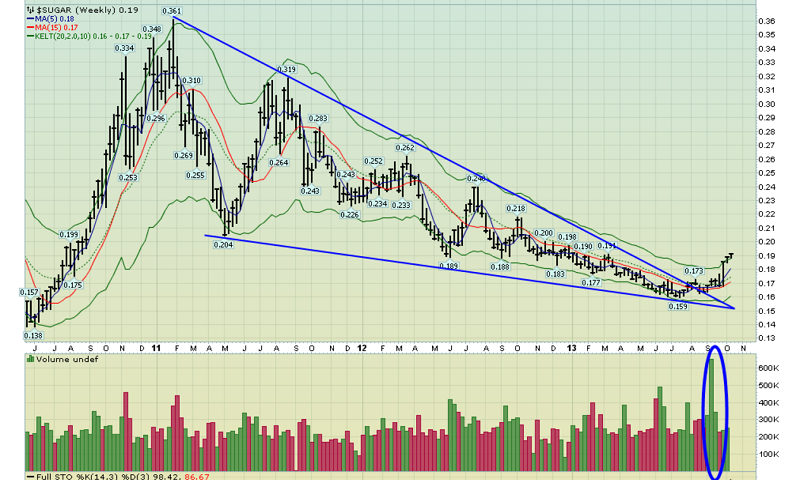
When sugar makes a big move, up or down, gold and silver often tend to follow. That's a weekly chart for sugar. I've highlighted a number of huge bullish wedge patterns on the chart, and this is the biggest of them all.
Note the enormous volume that occurred soon after the breakout from that wedge formation. I'll remind all gold and silver investors that sugar's last big peak was in early 2011.
That was several months before gold and silver peaked, proving sugar's ability to be a key indicator of gold and silver price action.
The current move in sugar needs to be watched. A short term correction is overdue, but sugar could be indicating that the actions of the Japanese government and central bank are much more of a “game changer” than most investors realize.
After the oil price shock of 1973, it was sugar, not gold and silver, that suggested that stagflation could occur, and it did. The current price action of sugar is suggesting that the gold bears have a short term edge, but have they failed to do their cost push inflation homework?
********
Special Offer For Gold-Eagle readers: Send me an Email to [email protected] and I’ll send you my free “Get Jacked With JNUG & JDST” report! JNUG-NYSE and JDST-NYSE are the new triple leverage junior gold stock ETFs. There's one for the bulls, and one for the bears. I'll show you the charts I'm using now, to minimize risk and maximize potential reward!
Email: [email protected]
Mail to:
Stewart Thomson / 1276 Lakeview Drive / Oakville, Ontario L6H 2M8 Canada
Risks, Disclaimers, Legal
Stewart Thomson is no longer an investment advisor. The information provided by Stewart and Graceland Updates is for general information purposes only. Before taking any action on any investment, it is imperative that you consult with multiple properly licensed, experienced and qualifed investment advisors and get numerous opinions before taking any action. Your minimum risk on any investment in the world is: 100% loss of all your money. You may be taking or preparing to take leveraged positions in investments and not know it, exposing yourself to unlimited risks. This is highly concerning if you are an investor in any derivatives products. There is an approx $700 trillion OTC Derivatives Iceberg with a tiny portion written off officially. The bottom line:
Are You Prepared?
 Stewart Thomson is president of Graceland Investment Management (Cayman) Ltd. Stewart was a very good English literature student, which helped him develop a unique way of communicating his investment ideas. He developed the “PGEN”, which is a unique capital allocation program. It is designed to allow investors of any size to mimic the action of the banks. Stewart owns GU Trader, which is a unique gold futures/ETF trading service, which closes out all trades by 5pm each day. High net worth individuals around the world follow Stewart on a daily basis. Website: www.gracelandupdates.com.


