Keep The Big Picture In Mind
After four hours on the operation table, I had with more tubes sticking into my body than I wanted a month ago, but today I feel good, so it’s time to get back to work and do some writing. And what do I want to say? Nothing new really, but fundamental things that we should all keep in mind when the price trends of our precious metals investments aren’t doing what we think they should; like monetary inflation flowing from the Federal Reserve directly benefits financial assets like stocks and bonds, not gold, silver and mining shares – at least at first it does.
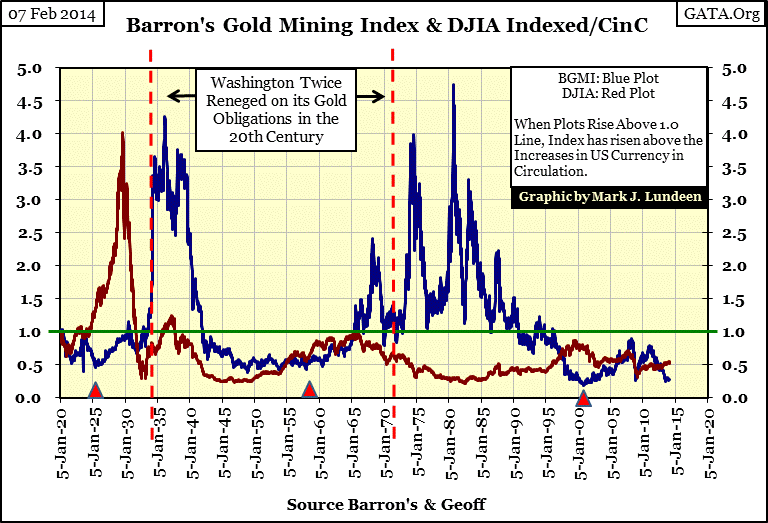
The following chart using weekly closing data for the Dow Jones (Red Plot) and the Barron’s Gold Mining Index (BGMI Blue Plot) as ratios to Currency in Circulation (CinC) makes my point. In this chart we are not looking at dollar valuations, but comparing the advances and declines of the Dow Jones and the BGMI in absolute terms relative to the expansion of paper dollars in circulation.
"We make money the old fashioned way. We print it."
- Art Rolnick, Chief Economist for the Minneapolis Federal Reserve Bank
Note: the green line at 1.0 marks the point where the Dow Jones and BGMI had increased at the same rate of expansion as CinC, and since 1920 CinC has expanded by a factor of 273 dollars for each dollar in circulation in 1920. So at 0.5 the Dow Jones or BGMI find their valuations at half the rate of increase for CinC, and at 2.0 they would have increased their valuation at twice the rate of increase for CinC. It’s a point of interest that the only time the Dow Jones saw gains that exceeded the expansion of monetary inflation as measured by CinC occurred during its bull market of the 1920s. That means that even before taxes and commissions, American blue-chip stocks have been at best a break even investment during all the good markets of the past eight decades. This has not been so for the BGMI, whose bull markets of the 1930s and 1960-90s have seen gains far greater than Federal Reserve created inflation of the currency in circulation, making gold miners a very profitable investment during their bull markets.
But money could certainly be lost if someone insisted in buying the gold miners at 2.0 or more then sold when the BGMI declined back to 1.0. The same holds true for the Dow Jones, but since 1937 the Dow Jones has never seen inflationary adjusted gains above the 1.0 inflationary breakeven line. Even now just a month after the Dow Jones’ last all-time high (16,576) it’s currently only at 0.53 on the chart. That’s 50% below the rate of inflation of the currency and 40% below the Dow Jones’ 1982-2000 bull market high of 0.87, when the Dow Jones topped out at 11,722. This makes no sense to those who naively believe a dollar is still a dollar. But to those who understand the pernicious effects of monetary inflation, it’s clear that the Dow Jones at 11,722 in 2000 represented more wealth than 16,576 does today.
There’s another pattern in the chart above that I believe is important to note; first the Dow Jones (the general stock market) sees a bull market as financial assets are inflated by the Federal Reserve, but the BGMI’s bull markets don’t become interesting until after the Dow Jones has entered into a bear market. That’s no accident as bull markets for the gold mining shares are driven capital fleeing deflating stocks and bonds, and that’s been true since the 1920s.
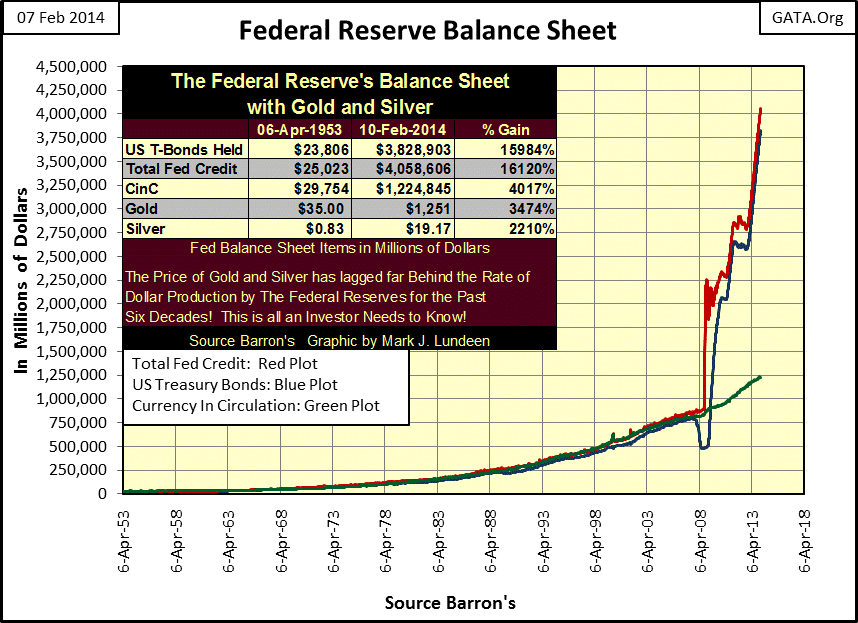
So in 2014 where are the big gains in the gold mining shares? Blame the “policy makers” at the Federal Reserve and other central banks who must be very aware of this data. They’re doing everything possible to maintain the illusion of a bull market in financial assets as they quell any excitement in the tiny precious metals markets and their miners. Look at the Federal Reserve’s balance sheet below; since 2008 it has exploded with one quantitative easing after another in support of the financial markets. Still the Dow Jones as well as the general stock market are declining on an inflation adjusted basis, even as their nominal valuations continue to make new highs.
Since 2011, gold, silver and the mining shares have seen some rough times too; but their current depressed valuations are very suspicious. An unknown seller of paper gold regularly sells what amounts to a full year’s worth of actual global gold production during odd hours in the paper futures markets in just a few minutes, smothering any excitement stemming from rising gold prices by crashing gold prices on the paper exchanges. Where are the cops when this happens again and again? They are bought and paid for, and know all about it but aren’t going to do a damn thing because the fix is in – at least for now.
But in the end it won’t make any difference because the historical pattern of financial assets being inflated by monetary inflation, as we see above, and the gold mining shares (gold and silver too) being inflated by capital flight from deflating financial assets will once again hold true. When Mr Bear once again takes the stock market by the throat and takes the Dow Jones down over 50%, and rising interest rates create a panic in the bond market, all these dollars the Federal Reserve created since 2008 will prove to be rocket fuel for precious metals and mining shares in the coming months and years to come.


