Measuring Inflation and Deflation CPI or CinC


“Experts” speak much on inflation and deflation, but most peoples understanding of them come from academics (aka “educators”), people whose self interest lies in keeping the public unenlightened of what they actually mean. As long as the public understands that inflation and deflation are economic forces that demand forceful action by their governments (guided by the economic gurus governments employ), to keep in check for the public’s benefit, they feel no need to go further into detail.
An excellent source to understand inflation is to read history. 18th century historian Edward Gibbon in his “Decline and Fall of the Roman Empire” understood inflation. During its decline, ancient Rome’s consumer prices were rising, and Gibbon let his readers know why; the empire was funding its army and bureaucracy by over issuing its coins of silver by diluting their silver content, as well as with ever rising taxes. This monetary inflation was a major factor in Rome’s decline. Inflation didn’t foster “growth” then, and it won’t foster “growth” for the United States today. In fact, history teaches that since money was invented, every time governments begin to inflate their money supplies, no matter the method, it ultimately results in a disaster.
"The fate of the nation and the fate of the currency are one and the same."
- Dr. Franz Pick
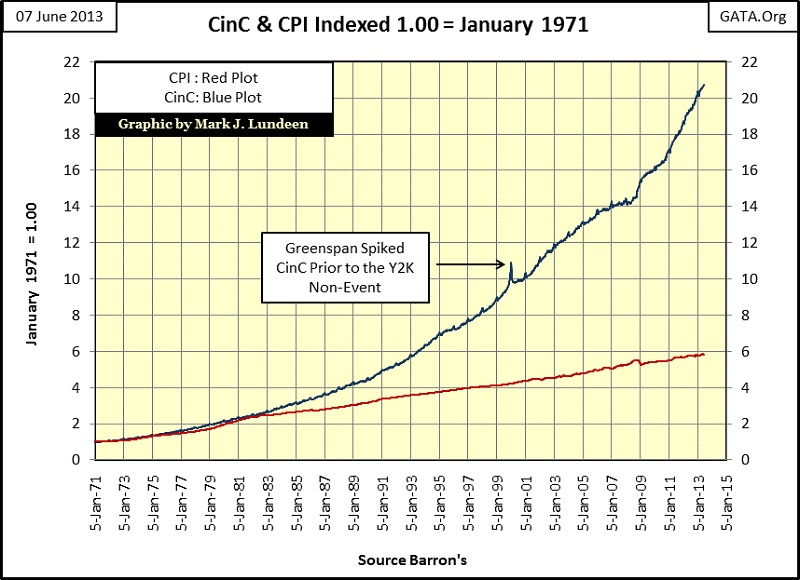
In the chart below we see two plots, one for Currency in Circulation (CinC/Blue Plot) and the Consumer Price Index (CPI/Red Plot), both are indexed to January 1971 = 1.00. An increasing supply of money (blue plot) was how inflation was universally understood for centuries. However, thanks to Keynesian economists, bankers and politicians; “inflation” today is now understood as rising consumer prices (CPI/red plot). In other words, inflation today is now defined by its effects rather than its cause, allowing the Powers That Be to blame inflation on merchants, rather than themselves for inflating the supply of money in circulation. Using CPI to measure inflation seems sleazy to me, as it blames innocent people for the inflationary crimes of our policy makers.
It is also becoming evident to more and more people today that monetary inflation from Doctor Bernanke’s QE programs is also responsible for the current “bull market” in financial assets marketed by Wall Street, and now once again in the housing market.
So, academics today and their former pupils employed by the media, finance and politics currently confuse inflationary price increases in financial asset valuations for “economic growth.” But in fact rising prices in financial assets are not economic growth, but price bubbles that expand until they can no longer sustain themselves.
I think Larry Parks of FAME identified the problem best.
“With the monetary system we have now, the careful saving of a lifetime can be wiped out in an eye blink.”
- Larry Parks, Executive Director, FAME
“Deflation” is a consequence of inflation, where prices for financial assets revert back to where they belong, or even lower. Deflation is much dreaded by all as it imperils the financial standings of banks, insurance companies, pension funds, and the wealth of individual citizens. If you don’t want deflation destroying your world, then don’t allow the government to inflate the money supply.
An interesting note on the chart above, both plots from 1971 to 1983 kept in step with each other, only diverting after 1983 – why? 1971 was an important year in the history of the United States and the world; it was the year that Washington demonetized gold. The world was not consulted, nor did it approve of using a reserve currency backed only by the “full faith and credit of the US Government.” Gold had been an essential part of the global monetary system for centuries. Having the US dollar now backed by the full faith and credit of a political class was a reckless innovation. The following quote by then Treasury Secretary sums up the US Government’s attitude at the time.
“The dollar may be our currency, but it is your problem.”
- John Connelly – US Secretary of the Treasury 1971.
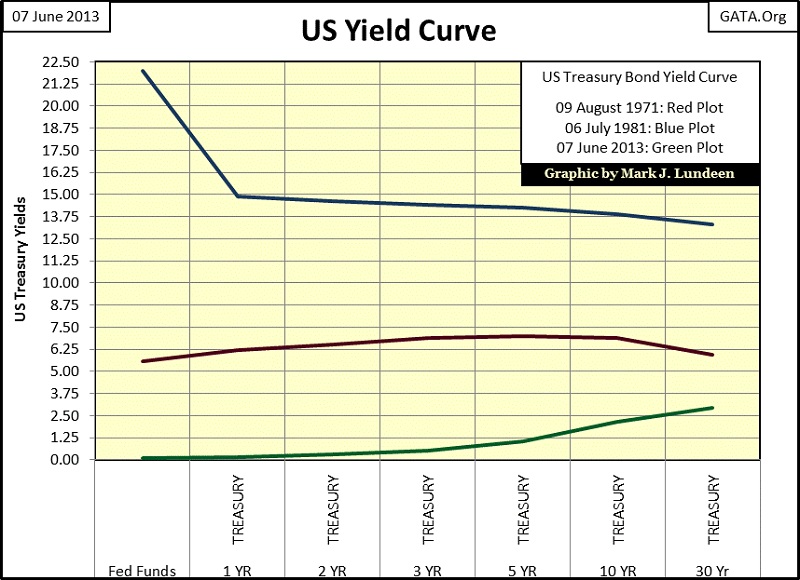
From 1971 to 1983 the US increased its CinC to 155.7 billion from 54.4. This was twelve years where the US increased its CinC by 171%, a huge increase then, but sadly a routine increase today. That monetary inflation flowed into consumer prices as bond yields soared into double digits. These twelve years were an era of constantly rising consumer prices, a go nowhere stock market, and a massive bear market in bonds that is still remembered by those who lived through it. Banks were paying depositors double-digit interest rates on their savings by the late 1970s. Just ten years after breaking the dollar’s gold peg, John Connally and the US Government learned that the dollar became everyone’s problem, as can be seen in the blue-yield curve plot for July 1981 below. Inflation had driven all US Treasury yields to double digits then, and it would do so today if Doctor Bernanke wasn’t purchasing tens of billions of dollars of US Treasury bond monthly. The yield curve for today (green plot below) is an indication of panic at the highest levels of government.
But nothing lasts forever, especially US Treasury double digit yields. Beginning in the early 1980s, the high interest rates of the Volcker Fed reversed the inflationary expectations in consumer prices, and declining bond yields ignited a chronic-bull market in financial assets that has continued to this day. You can spot the change in the CPI/CinC chart (two charts up), where the CinC plot begins to rise above the CPI plot in 1983. This increase in CinC (and the other rising aggregates in the Federal Reserve’s balance sheet) is responsible for “bull markets” in stocks, bonds, housing, and two nasty post 2000 bear markets, with the latest one being the second deepest Dow Jones bear market since 1885!
After over four decades of massive monetary inflation, financial asset valuations and the debt load carried by government, business by private citizens are profoundly inflated far above where they would be had the US not broken the dollar’s peg to $35 gold in 1971. Since the stock market crash of October 1987, every opportunity the market offered the monetary authorities to allow asset prices to decline to stable valuations, and allow the economy to shed its excessive levels of debt, they have chosen to oppose deflating asset prices with ever larger doses of inflation and debt. Doctor Bernanke and his ilk understand the terrifying deflationary potential prices in financial assets currently have, and fear this fact. In their heart of hearts, they know their inflationary policies of many decades are responsible for our pending disaster, but they will never admit it.
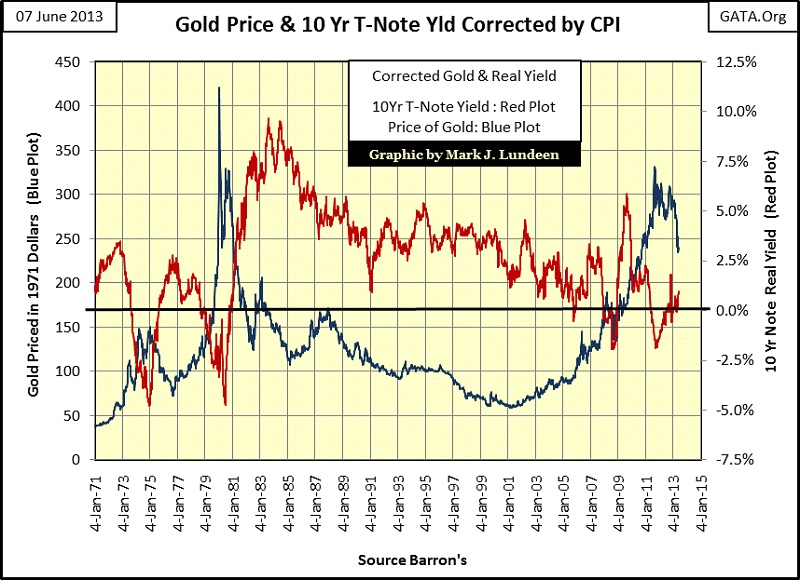
Let’s take a look at the price of gold and the yield of the 10 year T-note yield, from the perspective of CinC and CPI to gain an insight of why inflation is no longer measured by a rising money supply, but from a perspective of rising consumer prices. It makes a difference. Below we see the yield of the US 10Yr T-Note as published (Green Plot) and its effective after inflation corrected yield. Note the real after inflation yield (or real yield) corrected by CPI (Red Plot) and CinC (Blue Plot) are different.
How did I correct the 10Yr T-note yield for CPI and CinC below? Simple; given a 7% yield on the 10Yr note, if the annual gain for CPI was 2%, CPI’s Red Plot would fix the real after inflation yield at 5%. I used the same technique for the blue CinC plot. Note on the CinC plot; Alan Greenspan spiked CinC for the Y2K non-event (see article’s first chart above). This was a one-time event that caused a negative spike in 2000, and a positive spike fifty-two weeks later that should be disregarded.
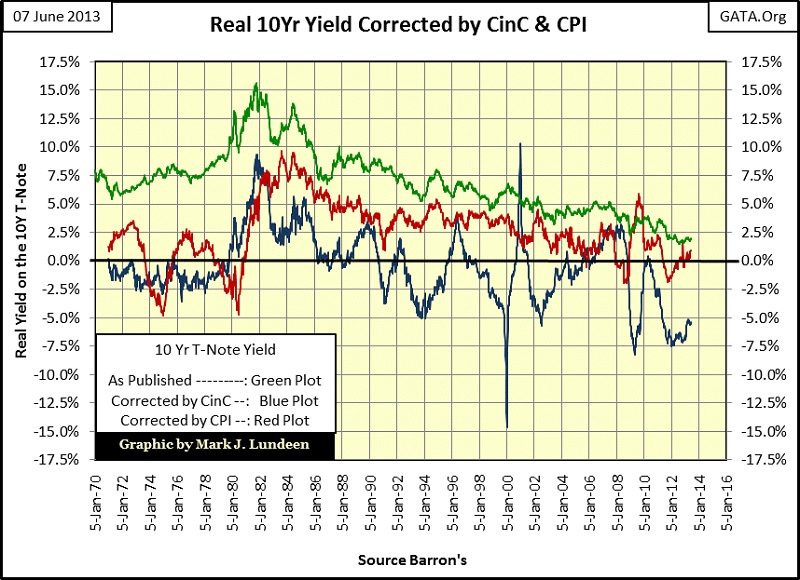
There isn’t much to say about this chart without risking becoming tedious, other than noting that the real yield computed by CPI for the past four decades has in the main been positive, a view that is believed to be true by most financial commentators today. But correcting the yield for the 10Yr T-note with CinC tells another story which I believe to be more accurate. Adjusting bond yields by CinC tells us that since 1971, with the exception of the late 1970s and early 1980s, interest income generated by the US Treasury market was below the rate of inflation as measured by CinC. Disregarding the CinC Y2K spikes of 2000 & 2001, the inflation corrected returns in the Treasury Bond Market are now at historic lows at around -5% when we measure inflation as it was understood for many hundreds of years, as increases in the money supply.
Next is a chart where the price of gold and the 10Yr T-note yield are corrected for inflation by consumer prices as measured by CPI. We are told that the price of gold benefits from negative interest rates (effective-bond yields below the rate of inflation), and the price of gold deflates when interest rates become positive, or higher than the rate of inflation. That is what we see from 1971 to 84, and to a lesser extent from 1984 to 2001. But the bull market in gold began 2001, with gold increasing from $253 to $1900 during a time when the US Treasury Market’s yields were in the main positive, well above the rate of inflation as measured by CPI. According to the “experts”, that isn’t how gold bull markets are supposed to work.
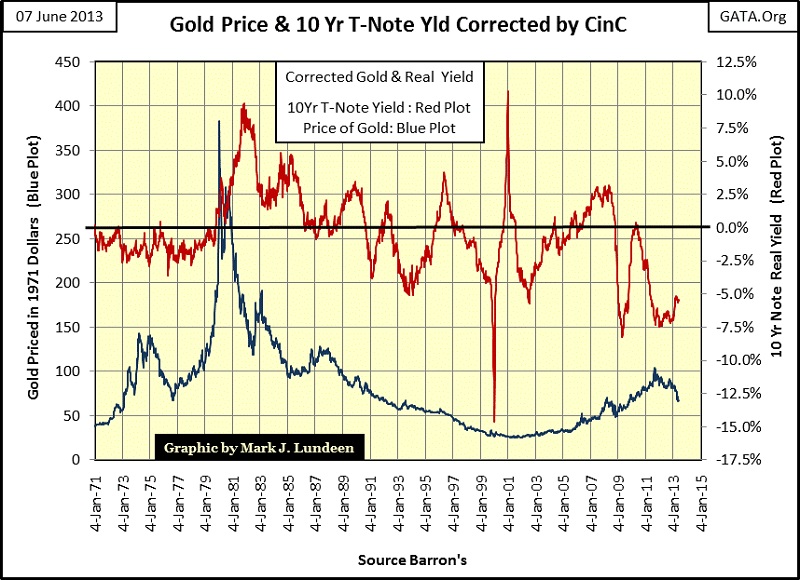
With the price of gold and the yield for the 10Yr T-note corrected for inflation with CinC, we see the bull market for gold that began in 2001 did begin with negative interest rates. But it must be admitted that from 1991 to 2001, Treasury yields adjusted with CinC were also frequently negative during the last ten years of the bear market in gold.
This is easily answered; the Federal Reserve may create money from nothing, but where the Fed’s “liquidity” flows to depends on how banks lend it, and people spend it. From 1971 to 81, people spend it on cost of living items, resulting in a rise in consumer prices. In the early 1980s, the Fed’s “liquidity” began to flow towards financial assets. During the 1990s, with negative yields came massive inflation that flowed into high-tech stocks, which like gold and silver offered no yield to investors. From 2001 to 2007 the Fed’s “liquidity” mostly flowed into mortgages, but the tiny gold and silver markets got their share of inflation too.
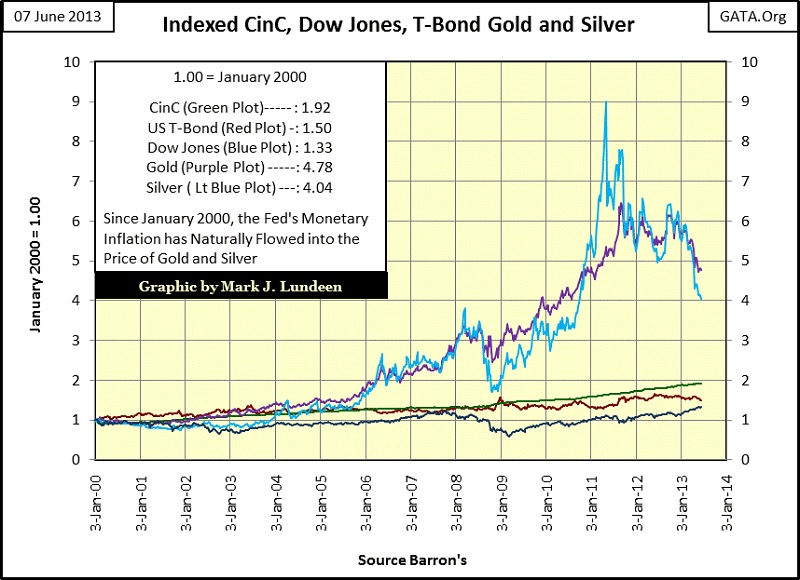
Since January 2009, yields for the 10Yr T-note have gone deeply into the negative as Doctor Bernanke has attempted to re-inflate financial assets in the stock and debt markets. But he fights a losing battle, as for the past thirteen years, the inflation he and Alan Greenspan created (CinC Green Plot below) has naturally wanted to flow into the price of gold and silver. And though the Dow Jones and prices for US Treasury bonds have increased since January 2000, they have not kept up with the increases in CinC.
As far as the current correction in the price of gold and silver, these prices are set by the paper COMEX and London markets; both markets are manipulated by the authorities who have no love for gold, silver, or the law of supply and demand. Fear not, in time gold and silver will resume their bull markets because Doctor Bernanke can’t stop his inflationary QE programs without crashing the financial markets.
Currently, I believe it’s accurate saying that the financial markets after soaking up the Fed’s “liquidity” for the past three decades are saturated, and near the point of deflating regardless of what the monetary masters would have them do. Also gold and silver’s current valuations are still extremely cheap, due to price suppression schemes by global central banks. Currently, no central bank would welcome rising gold and silver prices, whether they are the central banks who are selling their gold to protect their financial systems (Western CBs) or the central banks who are buying gold by the hundreds of tons (Eastern CBs) to place some distance between them and Wall Street.
Another thing to keep in mind is that gold and silver are not the primary beneficiaries of monetary inflation; stocks, bonds and real estate are. Gold and silver come into their own only when financial assets begin to deflate, as interest rates begin to rise. Remember, the 1969-80 gold bull market occurred on rising bond yields which forced wealth to seek a safe harbor in the precious metals and other real assets. But currently I would exclude real estate as a safe harbor. I admit the current multi-year correction in gold and silver is becoming tedious, but if history is any guide, and it usually is, the best is yet to come.
Mark J. Lundeen


