Metals & Stock Market Update


S&P500:
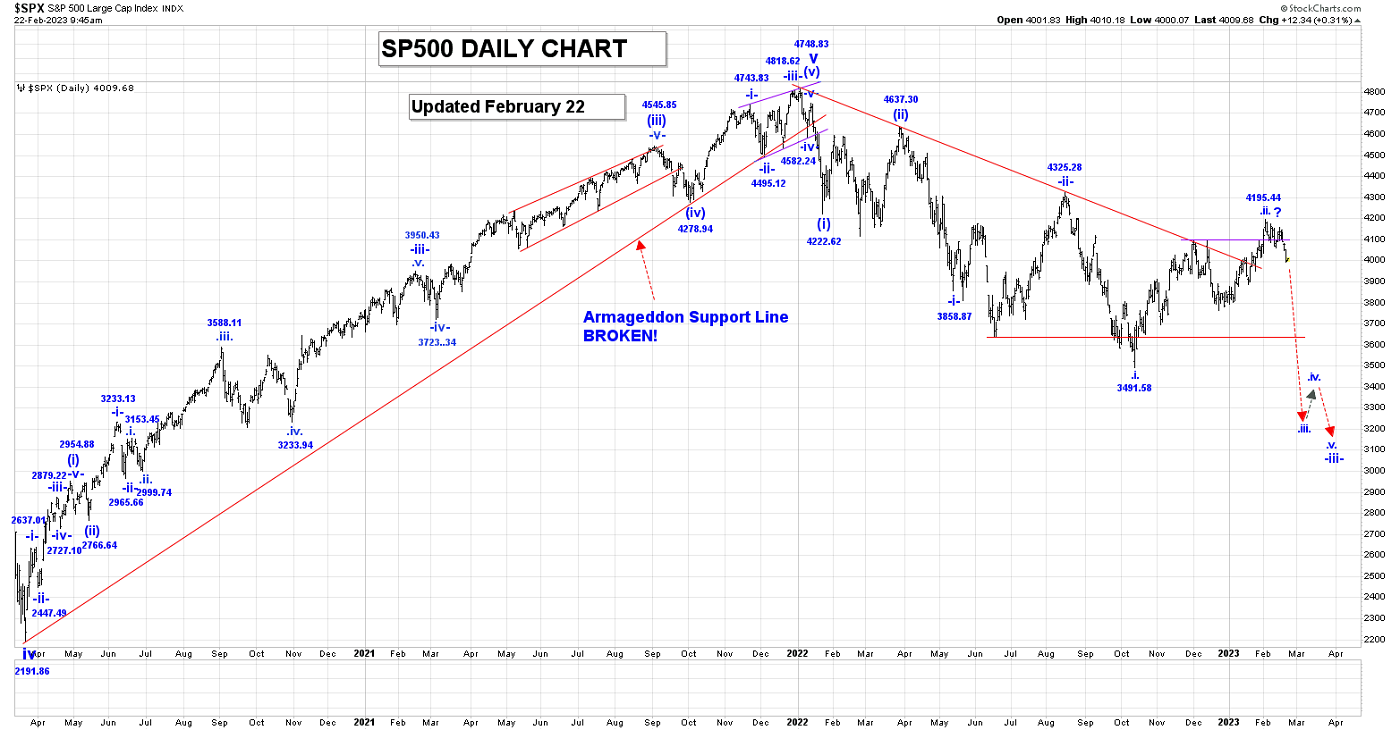
Wave v is complete at the 4748.87 high as a failure high. We have now started a multi-decade correction. We will assume that the first drop in this correction will be five (5) waves and so far, wave (i) ended at the 4222.62 and all of wave (ii) at the 4637.30 high.
We are now falling in wave (iii), that appears to be subdividing with wave -i- of (iii) ending at 3858.87 and all of wave -ii- at the 4325.28 high. We are now falling in wave -iii-, which has an initial projected endpoint of:
-iii- = 1.618-i- = 3065.78.
On the Intraday Chart it looks like within wave -iii-, wave .i. ended at 3491.58, all of wave .ii. looks to still be underway. We have updated our internal wave count for wave .ii. to suggest that it has become a double 3 wave correction, that is getting very close to completion. Our last retracement level for all of wave .ii. is:
78.6% = 4146.87.
We have now exceeded our 78.6% retracement level so we must continue to move lower in the start of wave .iii. We will provide our updated projected endpoint for all of wave .iii., when we believe that all of wave .ii. is complete.
Currently, we do not have an alternate count for the SP500.
Our current projected endpoint for all of wave (iii) is:
(iii) = 2.618(i) = 3259.58.
Trading Recommendation: Go short with calls as stops.
Active Positions: Very short with calls as stops!
Special Offer Subscription Price Sale: Our subscriptions are $289 for 3 months, which is good value. For gold community readers, we have a special $229 price for 3 months, good through this week! If you want to do it, send us an Email and we’ll get you a payment link. Thanks!
Ten Year Bonds Yields:
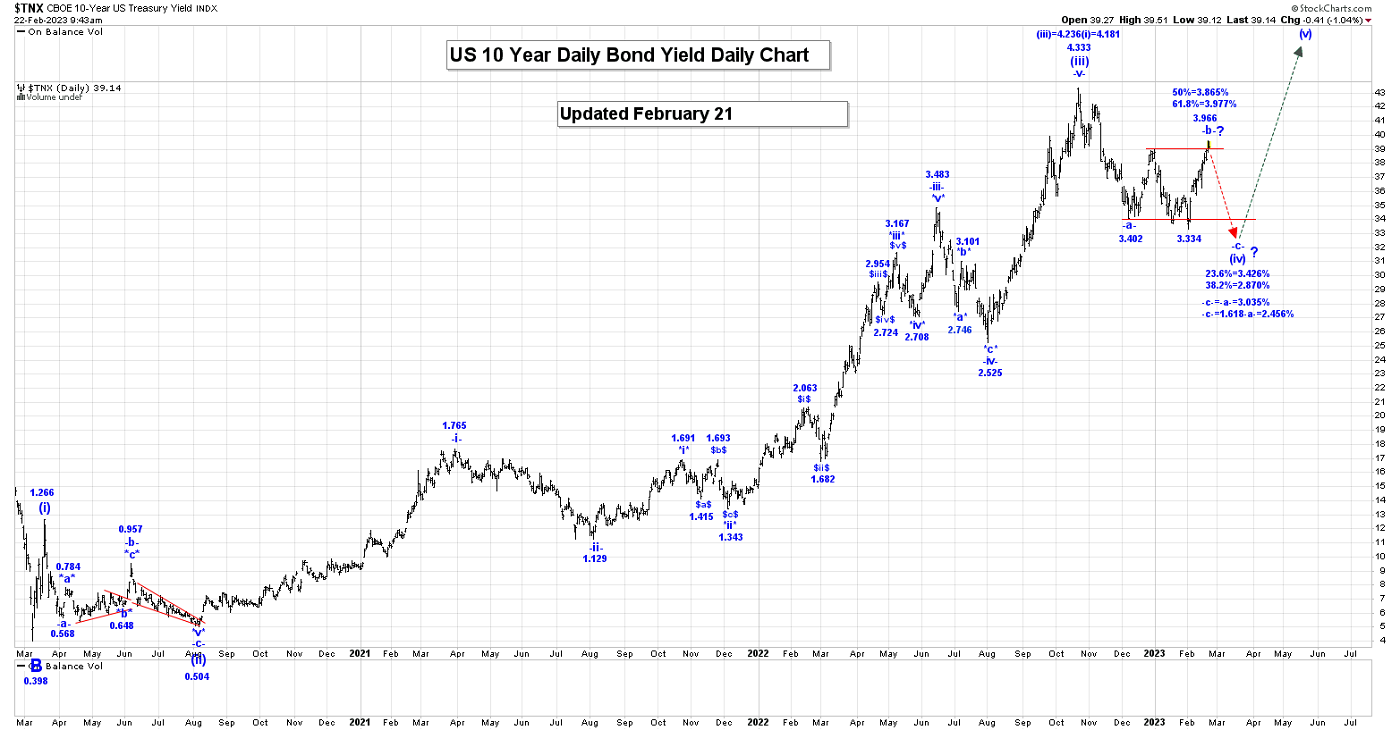
All of wave (iii) is complete at the 4.333% high and we are now falling in wave (iv), which has the following retracement levels:
23.6% = 3.426%;
38.2% = 2.870%.
We are now working on the assumption that (iv) has become more complex and is NOT complete at the 3.334% low. We think that wave -b- has become more complex and it may now be complete at the 3.923% high. Our retracement levels for all of wave -b- are:
50% = 3.865%;
61.8% = 3.977%
We have now entered our retracement zone, so we need to be on guard for the completion of wave -b- and the start on another drop in wave -c-. If wave -b- ended at the 3.966% level, then our projections for the end of wave -c are:
-c- = -a- = 3.035%;
-c- = 1.618-a- = 2.456%.
Trading Recommendation: Flat.
Active Positions: Flat!
Gold:
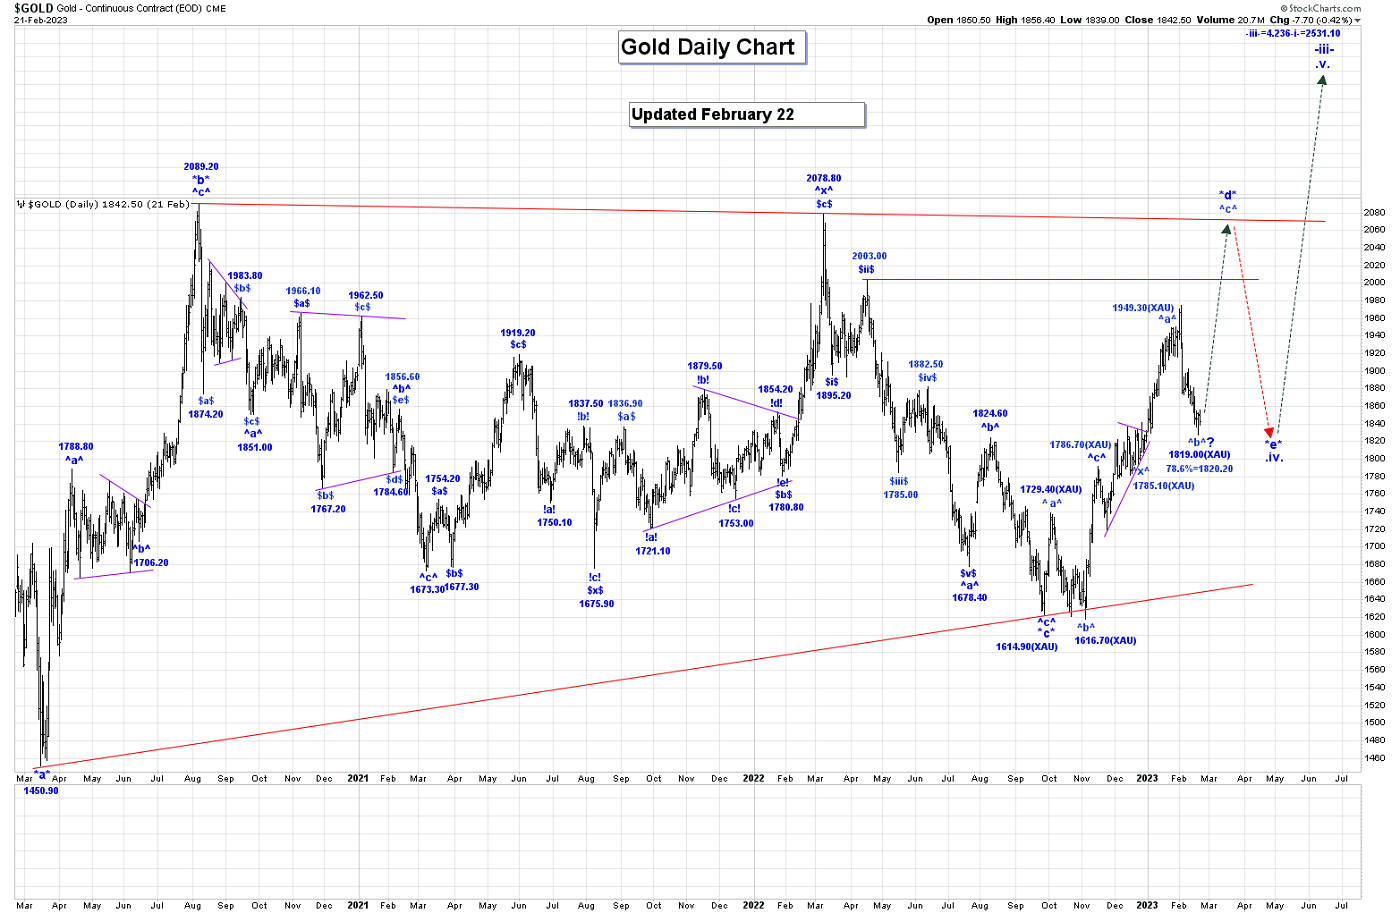
Wave *c* of our very large wave .iv. bullish triangle ended at 1614.90 (XAU). From that low we continue to rally in wave *d*, which now appears to have become a double 3 wave rally, as shown on our Daily Gold Chart.
From the wave *c* low of 1614.90 our first 3 wave pattern ran to 1786.70, and that was followed by a wave ^x^ bullish triangle that ended at 1785.10. Within our second 3 wave rally, wave ^a^ ended at 1949.30 and we are now falling in our second wave ^b^ which has a last retracement level of:
78.6% = 1820.20.
We now reached our 78.6% retracement level, so for our current analysis to remain valid we do not want to trade much below the 1819.00 level. On the Intraday Chart it looks like we are falling in an incomplete ending diagonal triangle formation. The internal waves of that triangle formation are:
$i$ = 1861.40;
$ii$ = 1889.70;
$iii$ = 1830.80;
$iv$ = 1845.30;
$v$ = 1819.00, if complete.
We are now working on the assumption that all our diagonal triangle formation is complete at the 1819.00 low, which completes waves $v$ and our second wave ^b^. We should now be starting to rally higher in our second wave ^c^. This next rally in our second wave ^c^ will likely complete all of wave *d*.
In the bigger picture, our wave *d* rally that cannot trade above our wave *b* high of 2089.20, and then after wave *d* ends we expect another drop in wave *e*, which cannot trade below the wave *c* of 1614.90. We have shown this graphically in our Daily Gold Chart.
Trading Recommendation: Go Long gold. Use puts as stops.
Active Positions: Long gold, with puts as stops!
CDNX:
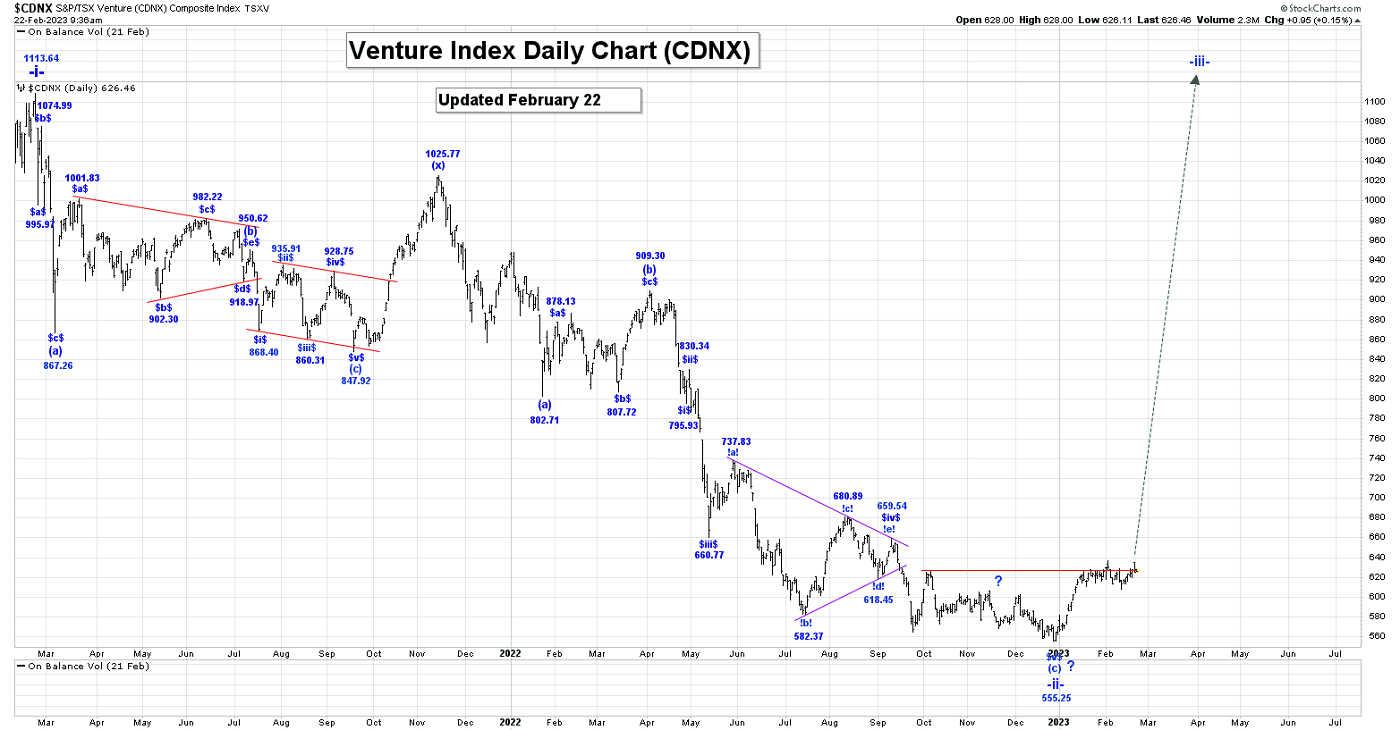
We have broken above the 625.99 high, which has eliminated our ending diagonal triangle formation for wave $v$. This suggests that all of wave -ii- is complete at the 555.25 low, although we are currently not sure what our internal count for wave $v$ of (c) of -ii- looks like. We will need to take another look at what is going on.
In the meantime, we are continuing to work on the assumption that all of wave -ii- is complete at the 555.25 low and that we have started to rally sharply higher in wave -iii-.
We are once again challenging major resistance at the 625.99 level.
Trading Recommendation: Go Long the GDXJ as a long-term hold.
Active Positions: Heavily long the GDXJ and key juniors on the CDNX, as a long-term hold!
Free Offer For Gold-Eagle Readers: Please send me an Email to [email protected] and I’ll send you our free “GDX: Is This The Low?” report. As a bonus, I also include 2 hot junior miners that we are buying for our Ewave Juniors Portfolio!
Thank-you!
Captain Ewave & Crew
Email: [email protected]
Website: www.captainewave.com
Risk: CAPTAINEWAVE.COM IS AN IMPERSONAL ADVISORY SERVICE. AND THEREFORE, NO CONSIDERATION CAN OR IS MADE TOWARD YOUR FINANCIAL CIRCUMSTANCES. ALL MATERIAL PRESENTED WITHIN CAPTAINEWAVE.COM IS NOT TO BE REGARDED AS INVESTMENT ADVICE, BUT FOR GENERAL INFORMATIONAL PURPOSES ONLY. TRADING STOCKS DOES INVOLVE RISK, SO CAUTION MUST ALWAYS BE UTILIZED. WE CANNOT GUARANTEE PROFITS OR FREEDOM FROM LOSS. YOU ASSUME THE ENTIRE COST AND RISK OF ANY TRADING YOU CHOOSE TO UNDERTAKE. YOU ALSO AGREE TO BEAR COMPLETE RESPONSIBILITY FOR YOUR INVESTMENT RESEARCH AND DECISIONS AND ACKNOWLEDGE THAT CAPTAINEWAVE.COM HAS NOT AND WILL NOT MAKE ANY SPECIFIC RECOMMENDATIONS OR GIVE ADVICE TO YOU OR ANY OF ITS CLIENTS UPON WHICH THEY SHOULD RELY. CAPTAINEWAVE.COM SUGGESTS THAT THE CLIENT/MEMBER TEST ALL INFORMATION AND TRADING METHODOLOGIES PROVIDED AT OUR SITE THROUGH PAPER TRADING OR SOME OTHER FORM OF TESTING. CAPTAINEWAVE.COM, ITS OWNERS, OR ITS REPRESENTATIVES ARE NOT REGISTERED AS SECURITIES BROKER-DEALERS OR INVESTMENT ADVISORS EITHER WITH THE U.S. SECURITIES AND EXCHANGE COMMISSION OR WITH ANY STATE SECURITIES REGULATORY AUTHORITY. WE RECOMMEND CONSULTING WITH A REGISTERED INVESTMENT ADVISOR, BROKER-DEALER, AND/OR FINANCIAL ADVISOR. IF YOU CHOOSE TO INVEST WITH OR WITHOUT SEEKING ADVICE FROM SUCH AN ADVISOR OR ENTITY, THEN ANY CONSEQUENCES RESULTING FROM YOUR INVESTMENTS ARE YOUR SOLE RESPONSIBILITY.
ALL INFORMATION POSTED IS BELIEVED TO COME FROM RELIABLE SOURCES. CAPTAINEWAVE.COM DOES NOT WARRANT THE ACCURACY, CORRECTNESS, OR COMPLETENESS OF INFORMATION AVAILABLE FROM ITS SERVICE AND THEREFORE WILL NOT BE LIABLE FOR ANY LOSS INCURRED. DUE TO THE ELECTRONIC NATURE OF THE INTERNET, THE CAPTAINEWAVE.COM WEBSITE, ITS E-MAIL & DISTRIBUTION SERVICES AND ANY OTHER SUCH "ALERTS" COULD FAIL AT ANY GIVEN TIME. CAPTAINEWAVE.COM WILL NOT BE RESPONSIBLE FOR UNAVAILABILITY OF USE OF ITS WEBSITE, NOR UNDELIVERED E-MAILS, OR "ALERTS" DUE TO INTERNET BANDWIDTH PROBLEMS, EQUIPMENT FAILURE, OR ACTS OF GOD. CAPTAINEWAVE.COM DOES NOT WARRANT THAT THE TRANSMISSION OF E-MAILS, OR ANY "ALERT" WILL BE UNINTERRUPTED OR ERROR-FREE. CAPTAINEWAVE.COM WILL NOT BE LIABLE FOR THE ACTS OR OMISSIONS OF ANY THIRD PARTY WITH REGARDS TO CAPTAINEWAVE.COM DELAY OR NON-DELIVERY OF THE CAPTAINEWAVE.COM NIGHTLY EMAILS OR "ALERTS". FURTHER, WE DO NOT RECEIVE ANY FORM OF PAYMENT OR OTHER COMPENSATION FOR PUBLISHING INFORMATION, NEWS, RESEARCH OR ANY OTHER MATERIAL CONCERNING ANY SECURITIES ON OUR SITE OR PUBLISH ANY INFORMATION ON OUR SITE THAT IS INTENDED TO AFFECT OR INFLUENCE THE VALUE OF SECURITIES.
THERE IS NO GUARANTEE PAST PERFORMANCE WILL BE INDICATIVE OF FUTURE RESULTS. NO ASSURANCE CAN BE GIVEN THAT THE RECOMMENDATIONS OF CAPTAINEWAVE.COM WILL BE PROFITABLE OR WILL NOT BE SUBJECT TO LOSSES. ALL CLIENTS SHOULD UNDERSTAND THAT THE RESULTS OF A PARTICULAR PERIOD WILL NOT NECESSARILY BE INDICATIVE OF RESULTS IN FUTURE PERIODS. THE RESULTS LISTED AT THIS WEBSITE ARE BASED ON HYPOTHETICAL TRADES. PLAINLY SPEAKING, THESE TRADES WERE NOT ACTUALLY EXECUTED. HYPOTHETICAL OR SIMULATED PERFORMANCE RESULTS HAVE CERTAIN INHERENT LIMITATIONS. UNLIKE AN ACTUAL PERFORMANCE RECORD, SIMULATED TRADES DO NOT REPRESENT ACTUAL TRADING. ALSO, SINCE THE TRADES HAVE NOT ACTUALLY BEEN EXECUTED, THE RESULTS MAY HAVE OVER OR UNDER COMPENSATED FOR THE IMPACT, IF ANY, OF CERTAIN MARKET FACTORS SUCH AS LACK OF LIQUIDITY. YOU MAY HAVE DONE BETTER OR WORSE THAN THE RESULTS PORTRAYED. NO REPRESENTATION IS BEING MADE THAT ANY ACCOUNT WILL OR IS LIKELY TO ACHIEVE PROFITS OR LOSSES SIMILAR TO THOSE SHOWN. NO INDEPENDENT PARTY HAS AUDITED THE HYPOTHETICAL PERFORMANCE CONTAINED AT THIS WEBSITE, NOR HAS ANY INDEPENDENT PARTY UNDERTAKEN TO CONFIRM THAT THEY REFLECT THE TRADING METHOD UNDER THE ASSUMPTIONS OR CONDITIONS SPECIFIED HEREAFTER. WHILE THE RESULTS PRESENTED AT THIS WEBSITE ARE BASED UPON CERTAIN ASSUMPTIONS BELIEVED TO REFLECT ACTUAL TRADING CONDITIONS, THESE ASSUMPTIONS MAY NOT INCLUDE ALL VARIABLES THAT WILL AFFECT, OR HAVE IN THE PAST AFFECTED, THE EXECUTION OF TRADES INDICATED BY CAPTAINEWAVE.COM. THE HYPOTHETICAL RESULTS ON THIS WEBSITE ARE BASED ON THE ASSUMPTION THAT THE CLIENT BUY AND SELLS THE POSITIONS AT THE OPEN PRICE OF THE STOCK. THE SIMULATION ASSUMES PURCHASE AND SALE PRICES BELIEVED TO BE ATTAINABLE. IN ACTUAL TRADING, PRICES RECEIVED MAY OR MAY NOT BE THE SAME AS THE ASSUMED ORDER PRICES.
*********


