Mid-Week Gold, Silver, Nat Gas & Oil Update


So far this week we have seen commodities move sideways with traders and investors waiting for the US Dollar to rally or continue dropping, which will trigger the commodities to move. I have provided some below charts showing where prices currently stand.
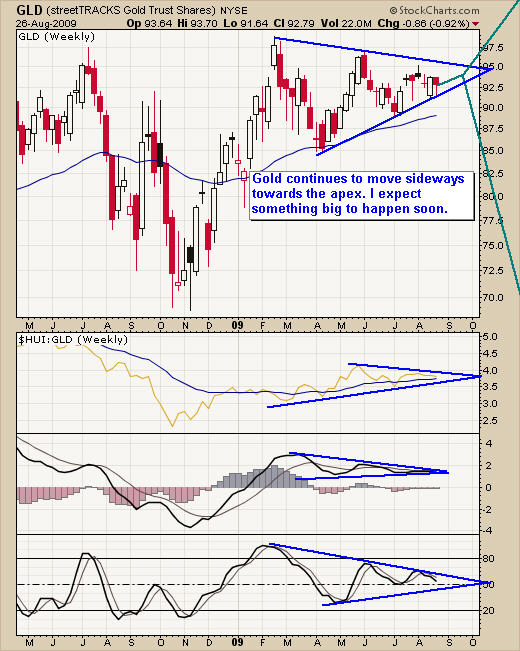
GLD Gold Trading Fund - Weekly Chart
As you can see on this weekly chart gold has been consolidating for the past 5 months. This bullish pennant pattern is hinting that prices will breakout to the up side in the coming weeks. If for some reason we see the USD rally then I expect to see the price of gold move down as traders rush to sell their gold bullion. I continue to watch and wait for the next buy signal for gold.
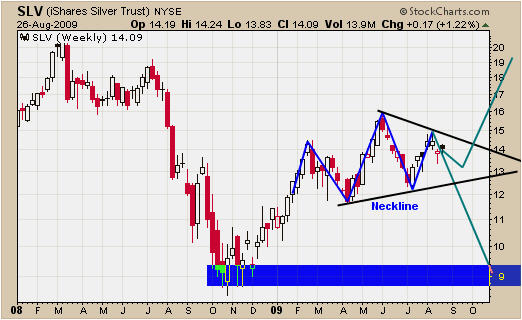
SLV Silver Trading Fund - Weekly Chart
Silver has two patterns forming here. The first is shown with the blue trend line which is a head & shoulders. This is a bearish pattern and points to much lower silver.
The second pattern is pennant using the black trend lines. This is a bullish pattern and points to higher prices. As you can see silver has much more time to consolidate before it reaches the apex. I continue to watch silver on the daily chart for an early buy signal.
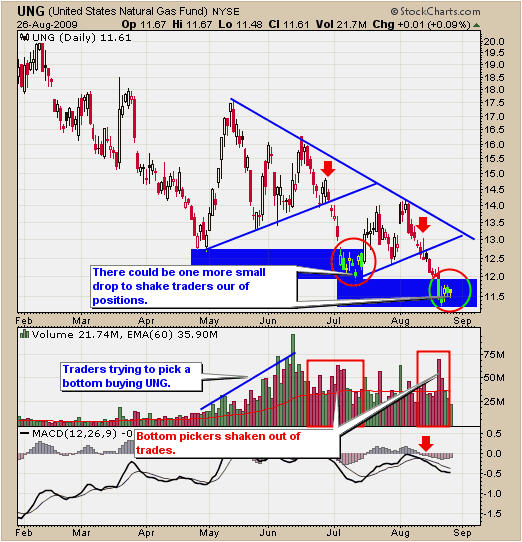
UNG Natural Gas Trading Fund - Daily Chart
Nat gas looks to be finding support at the $11.50 level. This could provide a great short term trade for those active traders looking to grab a quick 5-10% gain if the price starts to rally intraday. Overall natural gas has been trading down and sideways.
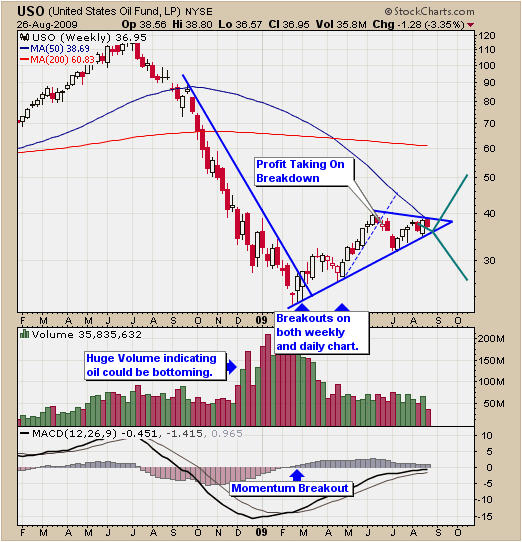
USO Crude Oil Trading Fund - Weekly Chart
Crude oil has a very nice looking chart. The bullish pennant is pointing to a much higher price. Currently the price is stuck under the June resistance level but appears to be holding up nicely. Any week now I expect to see a sharp rally or a sharp sell off. Let's continue to watch the price unfold.
Technical Traders Conclusion
The analysis above allows you to see that gold, silver and crude oil are all trading in a bullish pennant. I am watching the daily charts very closely for a buy signal. Waiting for my low risk buy signal is important because it confirms momentum and bullish price action before we put our money to work. These commodities could easily roll over and sell down quickly which is why I always follow my trading strategy to help avoid getting caught on the wrong side of the trade.
Natural gas is currently over sold in my opinion and ready for a bounce. If the price starts to move higher tomorrow (above Wednesdays high) then you could go long for a 1-5 day trade. There is a good chance it will provide 5-10% return, but be sure to take profits quickly as it is just a bounce (dead cat bounce). If the price drops below Wednesdays low then I would not be holding it any longer.

Chris Vermeulen has been involved in the markets since 1997 and is the founder of Technical Traders Ltd. He is an internationally recognized technical analyst, trader, and is the author of the book: 7 Steps to Win With Logic
Through years of research, trading and helping individual traders around the world. He learned that many traders have great trading ideas, but they lack one thing, they struggle to execute trades in a systematic way for consistent results. Chris helps educate traders with a three-hour video course that can change your trading results for the better.
His mission is to help his clients boost their trading performance while reducing market exposure and portfolio volatility.
He is a regular speaker on HoweStreet.com, and the FinancialSurvivorNetwork radio shows. Chris was also featured on the cover of AmalgaTrader Magazine, and contributes articles to several financial hubs like MoneyShow.com.


