A Mild Reaction, Nothing to Worry About


A weekly decline of $4 in the price of gold is a drop in the ocean -- and nothing at this point to have any concerns about. My previous commentary projecting gold to the $2150 level still stands. Moreover, the critical worry point as far as the point and figure chart was concerned was the $1200 level, which is still some distance away. However, for short-term players things might not be as bullish so let’s take our regular look at the simple technical situation for gold.
LONG-TERM
From a long-term perspective gold is still very much in a bullish trend but there is a sign starting to emerge that maybe things might get a little iffy ahead. Gold price is well above its positive sloping long term moving average line. The long term momentum indicator is still comfortably in its positive zone but the very minor (at this time) caution is in the momentum trigger line. The indicator, although still in the positive zone, has been moving lower recently and has crossed below its trigger line. The trigger line has also reversed to the down slope. So, the long term momentum of the price trend, although still positive, is starting to slowly lose some of the positive strength. For now the long term rating can only remain BULLISH.
INTERMEDIATE-TERM
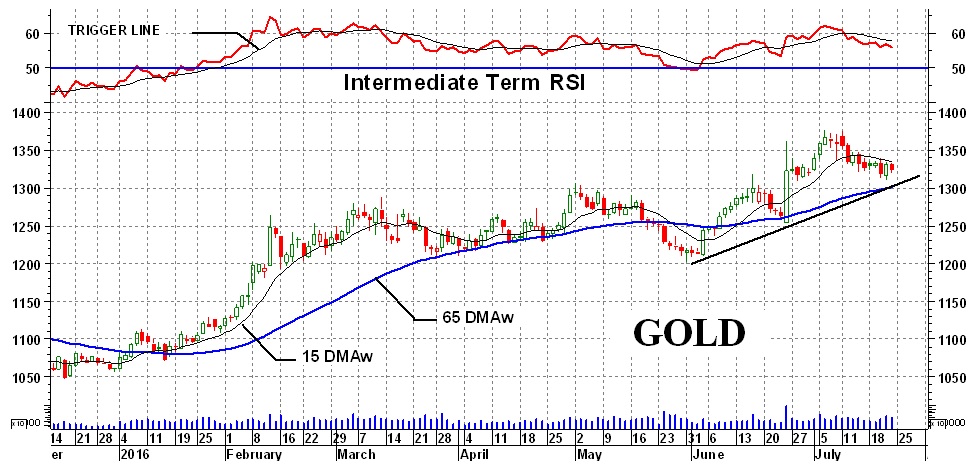
The intermediate-term is very similar to that of the long term. The gold price remains above its intermediate term moving average line and the line continues to slope upwards. The intermediate-term momentum indicator remains in its positive zone but is going through a mild reaction and has moved below its trigger line. The trigger line has also turned to the down side emphasizing the reduction is the recent strength in the price movement. However, no worry yet. The overall intermediate term rating remains BULLISH. An added plus is the fact that the short term moving average line, although moving lower, is still above the intermediate term line for confirmation of the rating.
SHORT-TERM
Most new trends start with the short term so it’s important to understand where the short-term stands. Unfortunately, the short term is not all that positive. The gold price continues to move below its short term moving average line and the line is sloping downward. As for the short term momentum, it is still in its positive zone but barely. It is right on top of the neutral line. It is, however, below its trigger line and the trigger is pointing downward. Despite the very small positive momentum the overall short term rating must be classified as BEARISH.
I try to keep my charts as uncluttered as possible. The more lines and whistles one puts on the chart the more confusion they cause. Apart from my normal indicators I have drawn only one line for your concern, a short/intermediate term up trend line. This suggests that although the short term indicators are negative the price trend has not yet been decisively broken. Gold remains above its short/intermediate term trend line. A move to the $1300 level would, of course, break below this trend.
A move to the $1300 level would also break below a short term head and shoulder pattern formed over the past few weeks. Should that happen the H&S pattern would suggest a short term move to the previous support at the $1250 level.
GOLD AND SILVER STOCKS
The actions of gold and silver stocks are represented by Indices such as the PHLX Gold/Silver Sector Index (XAU), the NYSE Arca Gold BUGS Index (HUI) and the NYSE Arca Gold Miners Index (GDM). I prefer to look at my own Indices, especially for intermediate and long term information.
Merv’s Gold And Silver 100 Index
The Merv’s Gold & Silver 100 Index represents the largest 100 gold and silver stocks traded on the North American market (to the best of my knowledge), based upon market value at the time of last revision. It is a weekly Index so is not that applicable for short term information. The Index value represents the average weekly percentage change of all 100 stocks with no stock given any higher value towards the calculation of the Index than any other.
For the past week the Index lost 12 points or 2.8%. There were 22 stocks advancing during the week, 75 declining and 3 unchanged. It was a disappointing week but after the run-up over the past several months, it was not a surprise. Still, the BULL/BEAR rating for the 100 stocks remains positive with the intermediate term having 68% positive ratings and 19% negative ratings. On the long term the ratings stand at 90% positive and 6% negative.
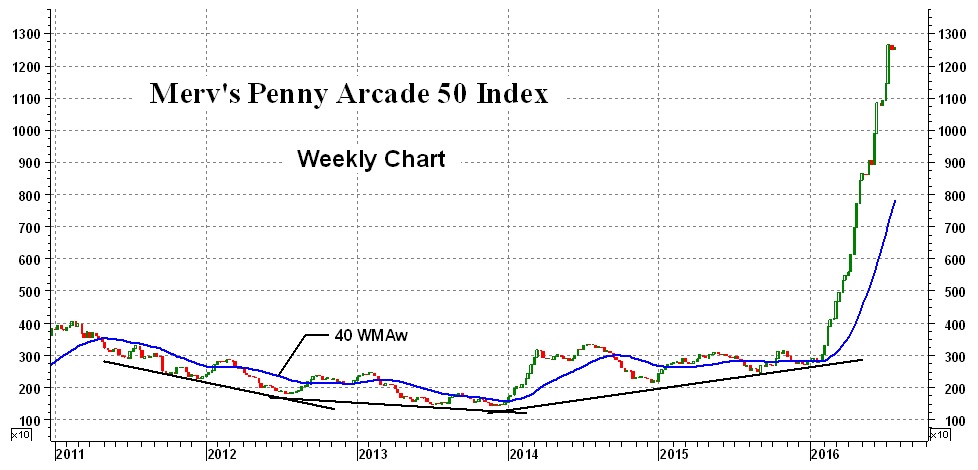
Merv’s Penny Arcade 50 Index
Merv’s Penny Arcade 50 Index represents 50 “penny” gold and silver stocks trading on the North American market, primarily on the Vancouver Exchange. The Index represents the average weekly percentage price change of all 50 stocks in the Index. Up to a couple of years ago the component stocks were seldom changed but then I decided to review the list more often and try to weed out the under performers and include new potential performers. The result was nothing short of spectacular, as you can see. For new inclusions there is a simple criteria. The stock should be under $0.50 but more possibly, under $0.25 at the time of inclusion. In addition, they must have at least a year of relative active trading history. Stocks are removed if they should advance above $2.00 for any length of time.
This past week the Index advanced 74 points or 0.6% (while the 100 Index declined). There were 21 stocks advancing, 25 declining and 4 unchanged on the week. As for the BULL/BEAR ratings, we had 67% positive and 22% negative ratings on the intermediate term and 92% positive and 4% negative on the long term.
I have drawn a few trend lines which technicians would view as indicating a saucer reversal pattern. Patterns such as these are often much easier to see after the fact than ahead of time.
In past years I have commented on the performance of the “quality” gold and silver stocks as represented by the 100 Index versus the performance of the gambling “penny” stocks as represented by my Penny Arcade Index. Such comparison of performances can be vividly seen with the above charts. During a bear market BOTH Indices decline about the same percentage, i.e. about 65%. However, during a bull market the “pennies” take off and leave the “quality” eating their dust. This is exactly what has happened in years past and has been happening once again now. So this is not a unique feature of the “quality” versus the “penny”. I will probably come back to this topic again sometimes in the future.
********
Readers are invited to view my Facebook page at https://facebook.com/merv.burak where I will be slowly posting commentaries explaining in more detail my various indicators and techniques. I also present from time to time some individual stocks that look as if they may be good speculations. However, nothing I post is meant to be a recommendation to buy or sell. One should check with their broker or investment advisor before acting.
 Merv is a retired Aerospace Engineering consultant. He is also a retired market technician with over 40 years of market experience and research. Merv received his certification as a Chartered Market Technician (CMT) in 1992. Developer of many technical techniques and programs which he has been using in his previous Technically Speaking with Wil-Arm and Technically Precious with Merv commentaries posted throughout the globe. Developer of several gold and silver Indices, Merv continues to update his Merv’s Gold & Silver 100 Index and Merv’s Penny Arcade 50 Index and reviews them during his periodic on-going Technically Precious commentaries.


