NBER’s Recession Indicators And Gold


The question is not ‘if’ but ‘when’. This is what more and more analysts think about the US recession. We invite you to read our today’s article about the NBER’s recession indicators and find out whether the economic slump is really coming soon – and what it all means for the gold market.
Talks about a possible economic slump are getting louder. More and more analysts forecast the US recession by 2020. For example, according to December JP Morgan’s “real-time quant monitor”, the risk of a recession jumped to 35 percent , the highest in series history and up from 16 percent back in March 2018. Similarly, the respondents to the January CNBC Fed Survey put the probability of a recession in the next 12 months at 26 percent, the third straight increase and the highest since January 2016. And according to the February 2019 Wall Street Journal Economic Forecast Survey, the odds of recession starting within the next 12 months was about 25 percent, the highest level (with the exception of January 2019) since October 2011 and up from just 13 percent last year. In Reuters poll, the median probability of a recession in the next year rose from 20 percent in January to 25 percent in February. The outlook for 2020 is even dimmer, as the odds of recession over the next two years is 40 percent. Last but not least, the Philadelphia Fed’s Survey of Professional Forecasters puts the odds that economy will be shrinking in a year’s time at 23 percent, the highest level since 2008.
OK, the expectations of recessions are rising. But how investors should know whether these gloomy forecasts will prove accurate? After all, almost nobody predicted the Great Recession. And, on the other hand, as Paul Samuelson joked, the stock market had predicted nine of the past five recession. Well, investors may just take them on faith. But much better idea is to analyze and sift data for some clues. This is what we do at Sunshine Profits: always base our analyses on real facts and the most recent data.
Now, the question is: what data? There are many recession indicators and it is not trivial to choose the right one. Let’s start from the most intuitive solution. As a reminder, the recession in the US is officially determined by the National Bureau of Economic Research. This research organization defines the recession as the following:
A significant decline in economic activity spread across the economy, lasting more than a few months, normally visible in real GDP, real income, employment, industrial production, and wholesale-retail sales.
Hence, the ostensible idea to determine whether the recession is coming is to look at these five data series. So let’s do it! The chart below paints the US real GDP from Q1 1996 to Q3 2018 (as an index where Q4 2007 = 100). We could, of course, display longer data series, but the chart would lose its clarity (you can see them here). As one can see, the fact that the GDP is currently rising does not mean anything – the last two times recession hit the economy despite it previously expanding. Actually, this is the main feature of the business cycle: after expansion comes contraction.
Chart 1: US real GDP from Q1 1996 to Q3 2018 (Q4 2017 = 100).
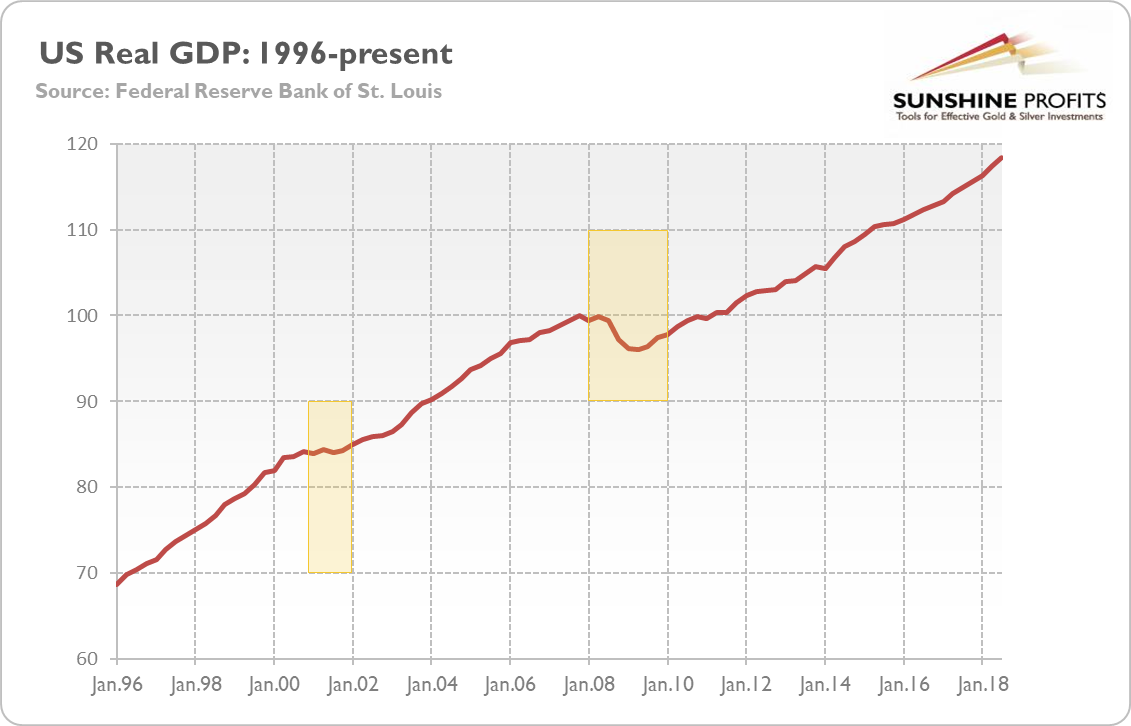
However, the pace of growth first slowed down and only then the recession occurred. The slope of the curve has been much flatter in 2000-2001 and 2006-2008 than in 1996-2000 and 2003-2006. But we do not see a slowdown now. If anything, the pace of growth has accelerated recently due to the Trump’s easy fiscal policy. For us, it suggests that we will not fall into recession in the near future (let’s say, this year), as we should first experience a downturn. It is bad news for the gold bulls, as the yellow metal would shine brighter during recession.
Let’s move on to the other four data series used by the NBER to indicate recession: real income, industrial production, employment and retail sales. We display them on a separate chart, as these are published on a monthly basis. We chose the period of 1998-2018 to present the two last recessions, while maintaining the chart readable. One can see here a similar story to the real GDP’s behavior: a slowdown at first, followed by a peak and only then a recession.
Chart 2: Real personal income excluding transfers (blue line), industrial production (green line), retailers sales (velvet line), and total nonfarm payrolls (red line) from January 1998 to November 2018 (December 2007 = 100).
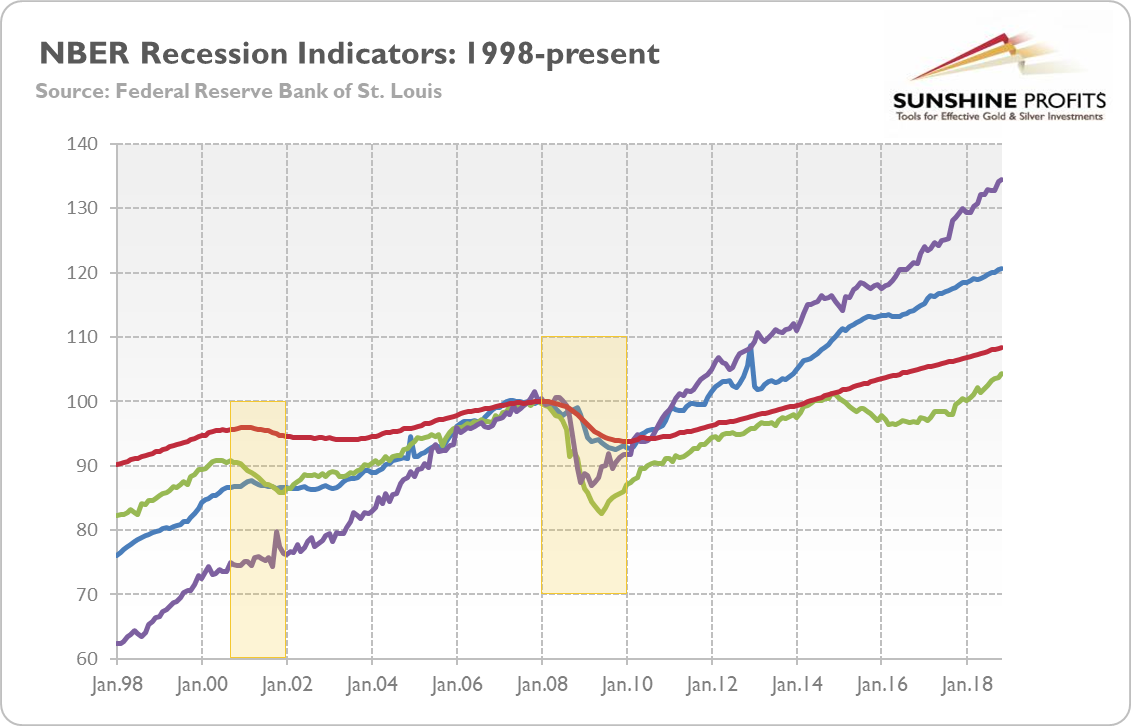
But this time is different. We do not see a slowdown or peaking – rather, there is a steady growth in all four series, sometimes quite steep. It complements the real GDP series, suggesting that fears of the upcoming recession are overblown, at least according to the NBER criteria. Gold bulls might be disappointed.
However, we have to make one caveat at the end. The NBER does not make real-time judgements, instead it looks backward to determine the date of peaks and troughs post factum. For example, the determination of the peak date in December 2007 occurred 11 months after it actually happened. Hence, even if the current data does not indicate recession, the NBER might declare for several months from today that we have been actually in recession. You see, the poor behaviors of the analyzed data series are what actually constitute or define recession – but they are not the harbingers of the approaching troubles. This is why their usefulness for forward-looking precious metals investors, who would like to buy gold as a safe haven on the restless ocean of recessionary forces, is limited.
If you enjoyed the above analysis and would you like to know more about the fundamental outlook for the precious metals, we invite you to read the March Market Overview report. If you’re interested in the detailed price analysis and price projections with targets, we invite you to sign up for our Gold & Silver Trading Alerts. If you’re not ready to subscribe yet and are not on our gold mailing list yet, we urge you to sign up. It’s free and if you don’t like it, you can easily unsubscribe. Sign up today!
Arkadiusz Sieron
Sunshine Profits‘ Gold News Monitor and Market Overview Editor
* * * * *
All essays, research and information found above represent analyses and opinions of Przemyslaw Radomski, CFA and Sunshine Profits' associates only. As such, it may prove wrong and be a subject to change without notice. Opinions and analyses were based on data available to authors of respective essays at the time of writing. Although the information provided above is based on careful research and sources that are believed to be accurate, Przemyslaw Radomski, CFA and his associates do not guarantee the accuracy or thoroughness of the data or information reported. The opinions published above are neither an offer nor a recommendation to purchase or sell any securities. Mr. Radomski is not a Registered Securities Advisor. By reading Przemyslaw Radomski's, CFA reports you fully agree that he will not be held responsible or liable for any decisions you make regarding any information provided in these reports. Investing, trading and speculation in any financial markets may involve high risk of loss. Przemyslaw Radomski, CFA, Sunshine Profits' employees and affiliates as well as members of their families may have a short or long position in any securities, including those mentioned in any of the reports or essays, and may make additional purchases and/or sales of those securities without notice.

Arkadiusz Sieroń received his Ph.D. in economics in 2016 (his doctoral thesis was about Cantillon effects), and has been an assistant professor at the Institute of Economic Sciences at the University of Wrocław since 2017. He is a board member of the Polish Mises Institute of Economic Education, author of several dozen scientific publications (including in such periodicals as the Journal of Risk Research, Prague Economic Papers, Quarterly Journal of Austrian Economics, and Research in Economics), and a regular contributor to GoldPriceForecast.com and SilverPriceForecast.com. His two books, Money, Inflation and Business Cycles and Monetary Policy after the Great Recession, are both published by Routledge. Arkadiusz is also a certified Investment Adviser, a long-time precious metals market enthusiast, and a free market advocate who believes in the power of peaceful and voluntary cooperation of people.


