NOT Quite Time To Panic…Yet


Although gold is in what I would call a lateral holding pattern, the latest action is not all that encouraging. Gold and silver stocks are something else. They are most definitely weakening - and may be foretelling what gold and silver will do in the very near future. I often look to the action of the stocks to tell me what the commodity will do. They are prone to reverse their trends ahead of gold itself.
Long-Term
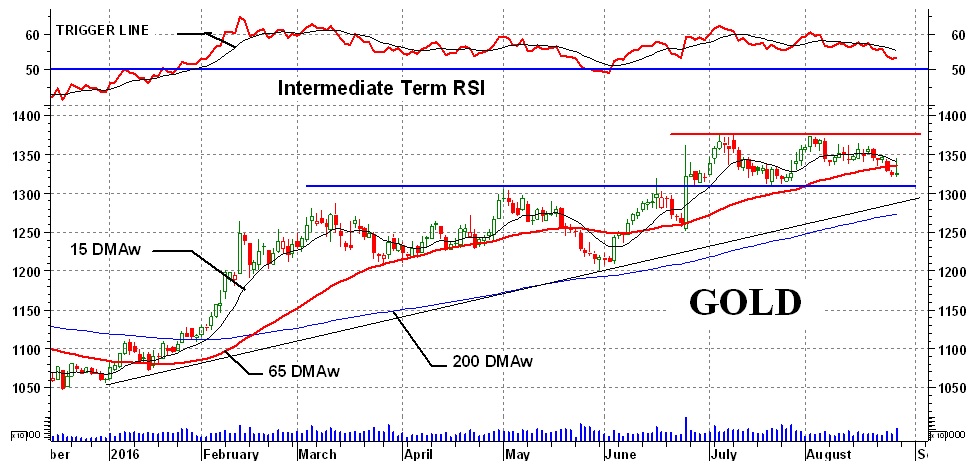
The chart shows gold still above a positive sloping long-term moving average line. The long-term momentum indicator is still very slightly above its neutral line in its positive zone. However, the momentum is below its trigger line and the trigger and momentum are both pointing downwards. Although the rating this week is still BULLISH, it is very, very close to moving a notch lower into the + Neutral level.
Shown on the chart is an uptrend line from the January low. This is the third of my FAN Principle lines (see earlier posts) the breaching of which should signal a trend reversal confirmation (based upon this technique). The long-term moving average line is also very close to this Fan trend line and might be breached with the Fan. I would, however, usually need the moving average to turn downward before changing the rating.
Intermediate-Term
The chart shows the precarious position of the intermediate-term trend. Critical, but still on life support.
First the basics. Gold closed below its intermediate-term moving average line but the line slope is still to the up side. The momentum indicator is moving lower and is below its negative sloping trigger line but is still slightly inside its positive zone. Over the past two weeks, since my last post, the intermediate-term rating has weakened considerably and gold is now rated as – NEUTRAL, one step above a full bear. The moving average turning downward or the momentum dropping into its negative zone would cause the rating to go to a full bear. It should be noted that the momentum is showing greater weakness in the recent price action versus the price itself. As we see, the momentum is weaker than its level during the late July lows while the price is still above its previous lows.
Two additional features I’ll mention today. First is the fact that the short-term moving average line has not yet crossed below the intermediate-term line (but it’s pretty close) so all is not yet lost. The second feature is that “box” pattern previously mentioned here. The price action is trapped within the confines $1380 and $1310. Gold breaching either one of these levels should tell us the direction of the next main price move.
Short-Term
The short-term is quite clear. Gold is below its negatively sloping short-term moving average line and the momentum indicator is below its negative sloping trigger line inside its negative zone. The only rating here must be BEARISH. Although the rating is bearish I would not be inclined to throw in the towel yet. As long as gold stays inside that “box”, above the $1310 support, there is hope of a reversal back to the up side.
Gold And Silver Stocks
It hasn’t been a very good week for gold and silver stocks. The major North American Gold and Silver Indices closed lower between 9% and 12%, while the Merv’s Indices closed lower in the 6% range. The real action was in the percentage BULL/BEAR ratings and in the number of stocks advancing on the week versus declining.
For the Merv’s Gold and Silver 100 Index stocks the short-term has seen its BULL/BEAR percentage drop sharply to 11% positive and 83% negative. For the first time in many months the intermediate-term percentages dropped into the bear camp with 23% positive and 66% negative. The long-term is still comfortably bullish with its BULL/BEAR percentages at 70% positive and 17% negative. As suggested some weeks back these BULL/BEAR percentages were just too high at the time and were due for some downsizing.
For the week there were only 14 stocks in the Merv’s Gold & Silver 100 Index that closed higher while a full 85 stocks closed the week lower.
Although not shown the Merv’s Gold & Silver 100 Index is inside a similar up trending channel as shown for the Merv’s Penny Arcade 50 Index. The Index is still comfortably above its long-term moving average line and its intermediate term line. So, although the direction at the present time is to the down side for these stocks, they are not yet in a critical position of turning the overall group bearish.
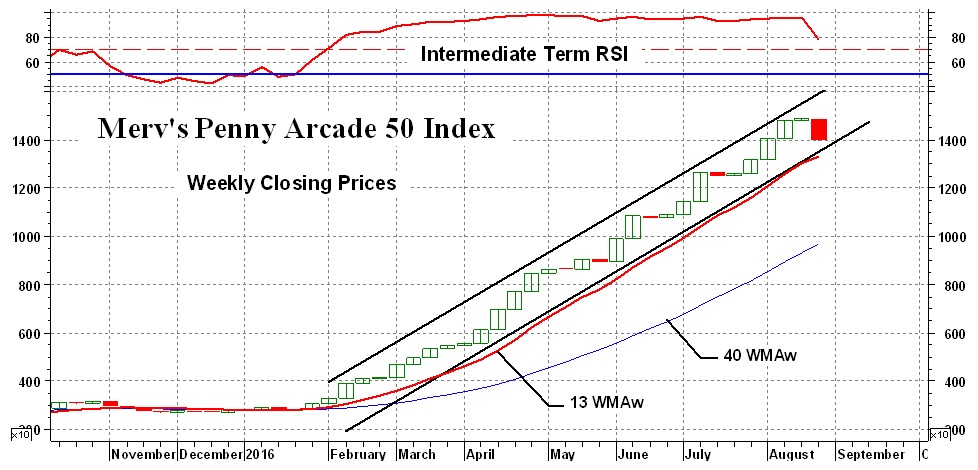
As with all of the gold and silver Indices this past week, the Merv’s Penny Arcade 50 Index was a bummer. It closed lower by 6.1% on the week. The short and intermediate-term BUL/BEAR percentages also moved sharply lower. On the short-term the percentage BULL/BEAR ratings shows 25% positive and 61% negative. The intermediate-term has its BULL/BEAR ratings at 47% positive and 49% negative while the long-term stands at 80% positive and 15% negative. On the week there were only 4 stocks closing higher in this Index with 38 closing lower.
As you can see from the chart, these penny stocks had their worst week ever, since the start of the major move in January. Is this the top for the pennies? Well, I’m not sure but will have to keep a close eye on the Index and stocks over the coming few weeks to see how the follow through progresses.
I thought I’d just mention briefly the momentum indicator, in this case the intermediate-term RSI shown in the Penny Arcade chart. Most momentum indicators have an overbought or oversold level defined. For the RSI that is usually the 70% and 30% levels. Too often speculators, as well as some professionals, quickly jump to the conclusion that once the stock is overbought the reversal of trend is just around the corner. Stocks and Indices can remain overbought for some time if the move is a strong move. The Penny Arcade has been in the overbought zone now for 7 months. In my view it’s when the stock or Index momentum indicator drops back below the overbought line that one might act as if the trend has reversed. BUT always check your primary indicators for confirmation. NEVER act on the message of one indicator, get a confirmation of at least a second trusted indicator.
********
Readers are invited to view my Facebook page at https://facebook.com/merv.burak where I will be slowly posting commentaries explaining in more detail my various indicators and techniques. I also present from time to time some individual stocks that look as if they may be good speculations. However, nothing I post is meant to be a recommendation to buy or sell. One should check with their broker or investment advisor before acting.
 Merv is a retired Aerospace Engineering consultant. He is also a retired market technician with over 40 years of market experience and research. Merv received his certification as a Chartered Market Technician (CMT) in 1992. Developer of many technical techniques and programs which he has been using in his previous Technically Speaking with Wil-Arm and Technically Precious with Merv commentaries posted throughout the globe. Developer of several gold and silver Indices, Merv continues to update his Merv’s Gold & Silver 100 Index and Merv’s Penny Arcade 50 Index and reviews them during his periodic on-going Technically Precious commentaries.


