Palladium, PALL/Gold Ratio, SPX And The Gold Sector


Okay, now I am getting geeked out. One of the most fun and rare times in what I do is when something big happens that I feel in my gut means something, but about which I am not able to come forth with a ready explanation of the meaning (without sounding like a know-it-all blowhard). It’s time to put the thinking cap on and to reference my wealth of experience (that’s another way of saying I am old) and try to figure out meanings going forward.
Reference the earlier post showing the impulsive drop in palladium and gold’s big bounce in relation.
Here is a chart of palladium at today’s close. Another down day and it will have put in the 20% drop that will get the pundits calling ‘bear market’. The volume spike is a kick-off, not a capitulation (obviously, since it only dropped two days ago). In the short-term it’s sure to bounce up and down, but it looks like an impulse just hit.
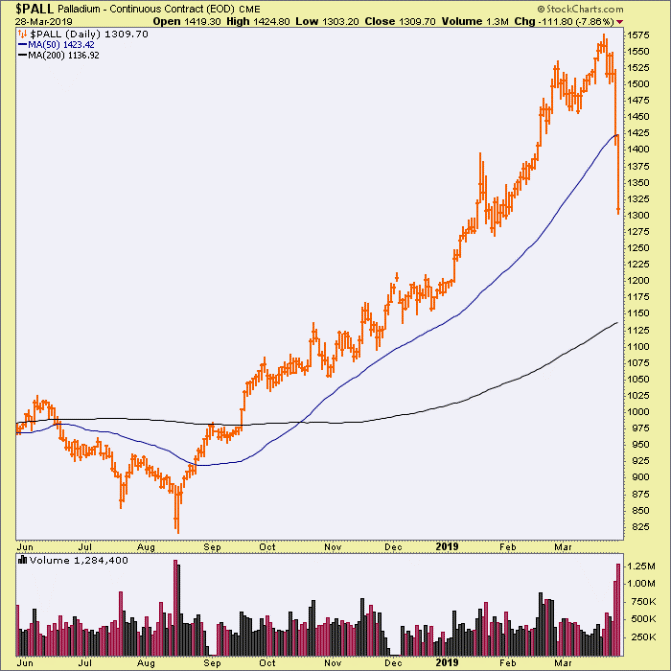
A pop in the palladium bubble means something, just like the silver pop meant something in Q1 2011. That thing was emblematic of the blow out of the last gasp of the commodity bubble and inflation trade of the time. The “Bond King” shorted the long bond (and got killed), silver moonshot and crashed and the CRB index began the long journey to the nowhere it finds itself at today. Oh and inflation expectations packed it in for years to this very day as well.
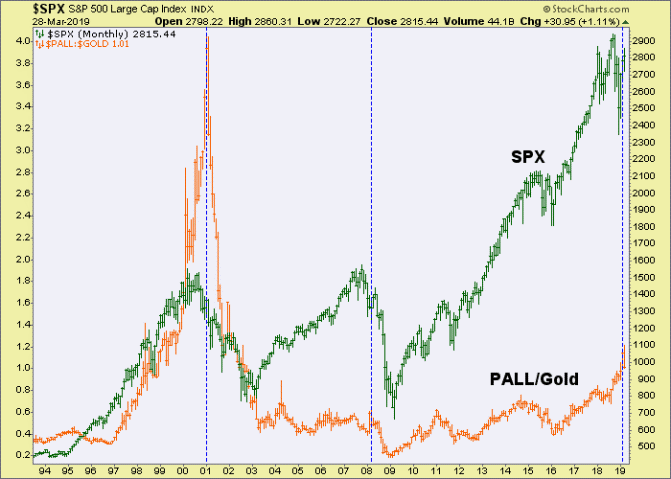
So silver’s shot to the Hunt Brothers’ high of $50/oz. was the poster child of that infamous blowout. Palladium on the other hand, has gone more in correlation with the US economy and stock market. If you believe that the daily chart above is the first shoe dropping in the palladium bubble then you are very much on guard about the S&P 500, says the chart below.
The dashed vertical lines show the relevant cracks in palladium and they show that each time (2001 & 2008) palladium cracked just as SPX was about to begin vicious downtrends after a year or more of top-making. Sound familiar? SPX has been making a potential top for a year now.
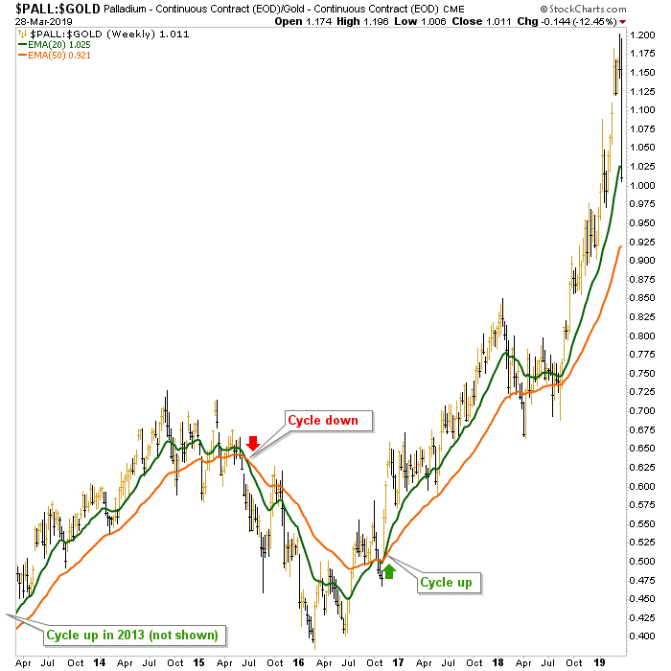
Sure, it could all be coincidence. I guess it was also a coincidence in 2013 when we (NFTRH) used a positive trend change in the PALL/Gold ratio to confirm the positive economic cycle signal being sent by the Semiconductor Equipment sector’s book-to-bill ratio at the time. What after all, does a bubble in a cyclical metal have to do with the US stock market?
Good point. But experience has taught me that when alarming things happen, even if in just one single (yet key) asset market or commodity, attention should be paid. We used PALL/Gold as a positive cycle signal in 2013 (and again in 2016), so we will use it again now going the other way. It won’t be the be-all end all. I don’t have a secret sauce with which to transfix you. I have themes driven by indicators and this indicator is now driving a theme, and it’s not pleasant.
Indeed, PALL/Gold is far from broken. It could be argued that the indicator is just taking a routine pullback on the way to ever happier cyclical outcomes. But to have that view you have to put aside the impulsive hit to palladium per the daily chart above. I don’t put it aside, not by a long shot. But if we are going to play it straight, the PALL/Gold ratio is still on a positive cycle indication by the weekly chart and the moving averages we’ve used.
As for the gold bugs? Well, inflationist bugs are busy selling against a bouncing US dollar, tanking inflation expectations and completely illogically, bad economic data) as I write. But we have had lower support targets for gold and especially silver, not to mention incomplete CoT trends. Gold bugs should not fear this time because it’s just the inflation-centric bugs getting rounded up and exterminated.
Patience will be needed, but gold is fine, and the gold miners will be better than fine if palladium really has blown out and PALL/Gold declines as expected. That is because if historical associations hold true, a counter-cyclical indicator will be triggering in the months ahead and the gold sector is the… yup, counter-cyclical one (for all the reasons I’ve hammered away at over the years but will refrain from doing in this already too lengthy post).
Subscribe to NFTRH Premium (monthly at USD $33.50 or a 14% discounted yearly at USD $345.00) for an in-depth weekly market report, interim market updates and NFTRH+ chart and trade setup ideas.
********


