PHLX Gold/Silver Index (XAU) Analysis


The Philadelphia Gold and Silver Index (XAU) consists of sixteen precious metals mining companies that is traded on the oldest stock exchange in the United States – the Philadelphia Stock Exchange which was purchased by NASDAQ in 2008. Price last traded at $70.51.
Let’s take a top down approach to the analysis beginning with the yearly chart.
XAU YEARLY CHART
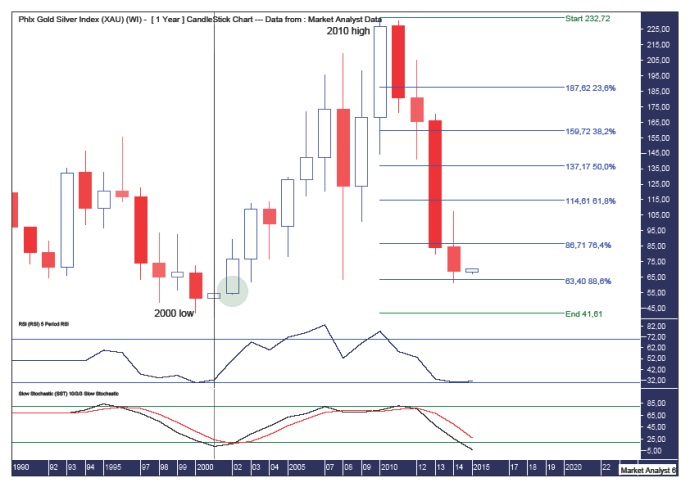
I have added Fibonacci retracement levels of the move up from the 2000 low to the 2010 high. Price has already retreated all the way back to the 88.6% level. If the long term bull trend is to remain in play then there isn’t much more room left on the downside.
I have drawn a green highlighted circle to denote where price embarked on a little parabolic move higher. This was in 2002 and price pretty much flew the gates from the get-go that year. Price often eventually returns to these exact levels in the future this area is around the $54 mark. I favour the final low to be somewhere in the vicinity.
Both the Relative Strength Indicator (RSI) and Stochastic indicator are both in weak territory and while they could become even weaker, I suspect time is nearly up on the downtrend. Why?
I have drawn a vertical line to highlight the last time both of these indicators were in a similar position. Look closely and you will see the position of them back in 2001 is virtually identical to their current positions. And what happened in 2001? Liftoff!
XAU MONTHLY CHART
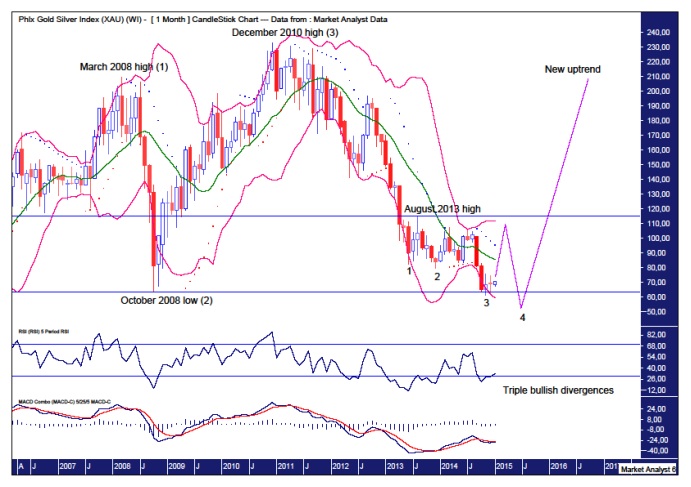
There are some very interesting observations to be made from this chart so let’s run through them.
Firstly, there looks to be a “three strikes and you’re out” low formation already in place denoted by the numbers with the third low set back in November 2014 at $61.39. This often leads to a significant rally.
This third low was also accompanied by triple bullish divergences on both the RSI and Moving Average Convergence Divergence (MACD) indicator. Yet another bullish sign!
Also, this third low looks to have set up a double bottom with the October 2008 low and is denoted by the lower horizontal line. Double bottoms are great for traders that buy the expected reaction higher and I suspect they are getting involved on the long side here.
Given all these factors, I am expecting a big rally higher from here but something needs to be kept in mind and that is the fact that double bottoms rarely end downtrends and so once the rally is over I expect price to come back down and bust the double bottom.
The higher horizontal line denotes the level of the August 2013 high and I doubt the rally will trade above there.
There looks to be a massive 5 point broadening top in play with point 4 still to form. Once in place price should rally big time up to record highs above the December 2010 high of $232.72. So a five bagger at the minimum looks to be on offer at the coming point 4 low.
Now price making a new low will negate the “three strikes and you’re out” low formation will it not?
Well, I already expect a big rally now in line with this third low but yes, it will not be the final low which should come with the fourth lower low. On some occasions I have noted this pattern play out and, with conditions looking suitable, I expect this rare event to play out here. The final fake out.
If my analysis is correct then once the final low is in place later this year the bulls will be able to kick up their hooves as price rockets higher in a new bull trend.
XAU WEEKLY CHART
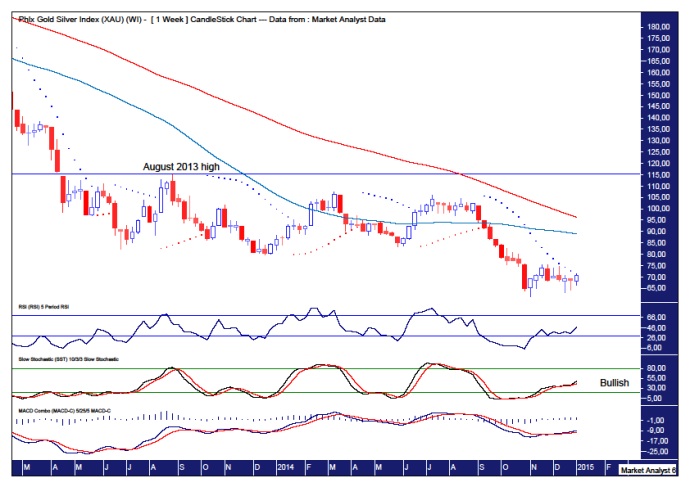
The lower indicators, the RSI, Stochastic and MACD indicators, all appear to be trending up and looking bullish. The weeks ahead look promising for the bulls.
The Parabolic Stop and Reverse (PSAR) indicator shows price is challenging the resistance as denoted by the dots. While the dots remain above price a bearish bias remains in force but given the strength being exhibited by price I expect this resistance to give way imminently.
I have once again drawn a horizontal line to denote the August 2013 rally. While I am expecting a big rally now I seriously doubt it will take out that level. I do expect price will go close though.
I have also added the moving averages with time periods of 50 (blue) and 100 (red). The blue line is still below the red line indicating the downtrend still rules. The averages are starting to come together but there still looks to be quite some time left before we witness a bullish crossover. There should be some toing and froing in price around the time these averages look to be crossing over. The bulls may get a tad frustrated over the coming months as they yearn for the next bull trend to really get going.
XAU DAILY CHART
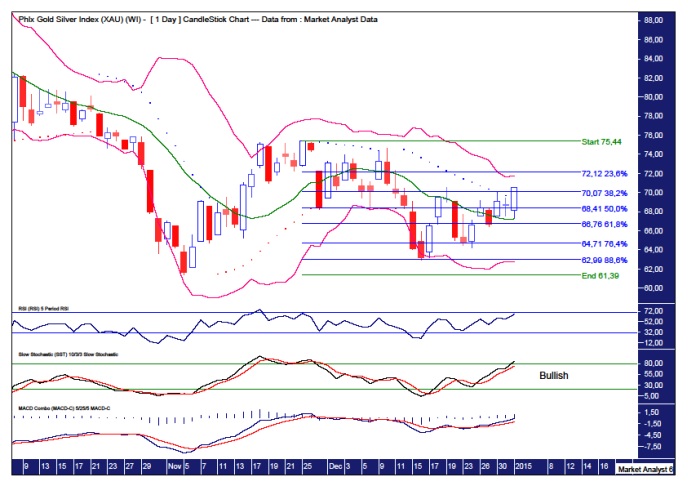
The Bollinger Bands show price bouncing between the upper and lower bands which is consistent with a consolidation or a trend change. I favour the latter.
The PSAR indicator shows price has just busted the dots on the upside so a bullish bias is in force here. I’d like to see price test the support given by the dots on the downside before the rally launches much higher.
The RSI, Stochastic and MACD indicators are all trending up strongly with a pattern of higher lows and higher highs.
I have added Fibonacci retracement levels of the move up from recent low to recent high. Price has already found support at the 88.6% and 76.4% level. I suspect we’ll see bit more work done near the 76.4% level which stands at $64.71 although I doubt price will trade below that level. Once the work is complete price will be free to go about its business as it lets off steam and rockets higher. That’s my opinion anyway.
Summing up, the short term looks great for the bulls while the medium term should see one last low before the bulls let it rip once again over the long term.
Disclosure – I have no financial interest in XAU.
********
My website is www.thevoodooanalyst.com
© 2014 Copyright The Voodoo Analyst - All Rights Reserved
Disclaimer: The above is a matter of opinion provided for general information purposes only and is not intended as investment advice. Information and analysis above are derived from sources and utilising methods believed to be reliable, but we cannot accept responsibility for any losses you may incur as a result of this analysis. Individuals should consult with their personal financial advisors. Put simply, it is JUST MY OPINION.


