Precious Metals Low Risk Trading Setup At Possible Sector Bottom


It looks like we are really going to see some fireworks late this coming week, right after the Fed make their much anticipated announcement about whether or not they will raise interest rates. They had better get on with it and do their miniscule rate rise this time, because if they don’t and start making bleating noises again about doing it at some point in the future, their already tenuous credibility will vanish. There is a fair chance that they will do it, because although they would like to keep the stock market elevated, they will quite happily sacrifice the stock market to save what to them is much more important – the dollar and the Treasury market. If they do announce the rate rise, it is thought likely that the stock market will tank, because the Fed has never done a single rate rise, it has always run a cycle of rate rises, and the psychological impact of the 1st rate rise for 9 years will therefore be big, especially because they have used the prospect of this rate rise for a long time to goad the market into driving the dollar higher and higher, like a donkey following a carrot on a string, to the great cost of emerging markets. It therefore follows also that if there is no rate rise, the dollar could drop sharply, which is another reason why the PM sector is looking attractive here. In any event, after the positive action on Friday across the PM sector, it is looking set to rally ahead of the decision, perhaps quite sharply, and is therefore an attractive trade, because of the current highly favorable risk/reward setup. This article is actually a rerun of an article of the same name posted 10 days ago on the site, with the exception of this opening paragraph, because the setup is almost exactly the same, except even more favorable for a long trade with close stops, after Big Money ran some investors out of their positions in Friday by driving prices temporarily lower on Friday, before they bounced back in the late trade. They did this most noticeably with GDX, where we had anticipated this dirty trick and set our stop some way below $13, although not quite far enough, and whether you got shaken out or not depends on whether you set an intraday or closing stop.
Bottom fishing is by its nature usually a hazardous game, but there are occasions when it is worth giving it a go, when two conditions are fulfilled, one being that there is a fair chance that it actually is a bottom, and the second being that what you are contemplating buying is close to a clearly defined important support level, so that if you are wrong about it being a bottom, you are out for a minor loss – but if right you can quickly find yourself in a very good position.
As you know, we are expecting the stock market to drop hard soon. This has not changed. In the past, for example in 2008, when the stock market tanked it took commodities with it, but a point worth observing here on the long-term chart for the commodity index is that commodities have already tanked, and the situation today is very different from 2008 in that due to the spreading Sovereign debt problems investors will be less inclined to scurry to the safety of bond markets, because they know, or should know, that they suck as investments too. Thus there is a fair chance that this time round hot money will flee into tangible assets like some commodities and especially the Precious Metals.
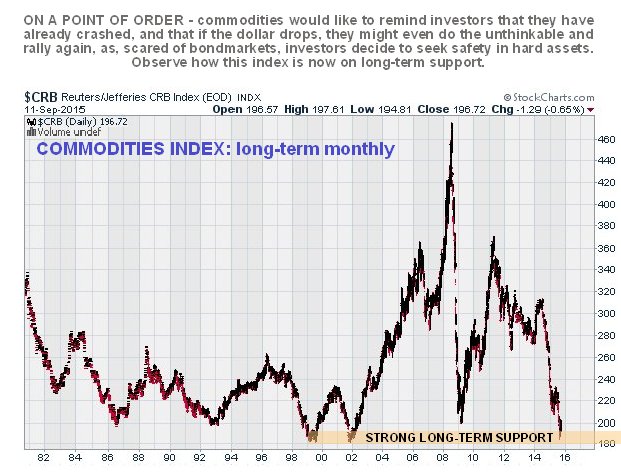
With respect to the chances of hot money fleeing into the Precious Metals soon, the outlook for the dollar, which we looked at yesterday, is obviously of critical importance, and the interesting thing is that in the recent past, as you will see on one of the charts below, the dollar and the stock market have been moving almost in lockstep. So if the stock market tanks soon, and the dollar tanks with it, unlike in 2008, which could happen after the Fed, then gold and silver could take off like a rocket.
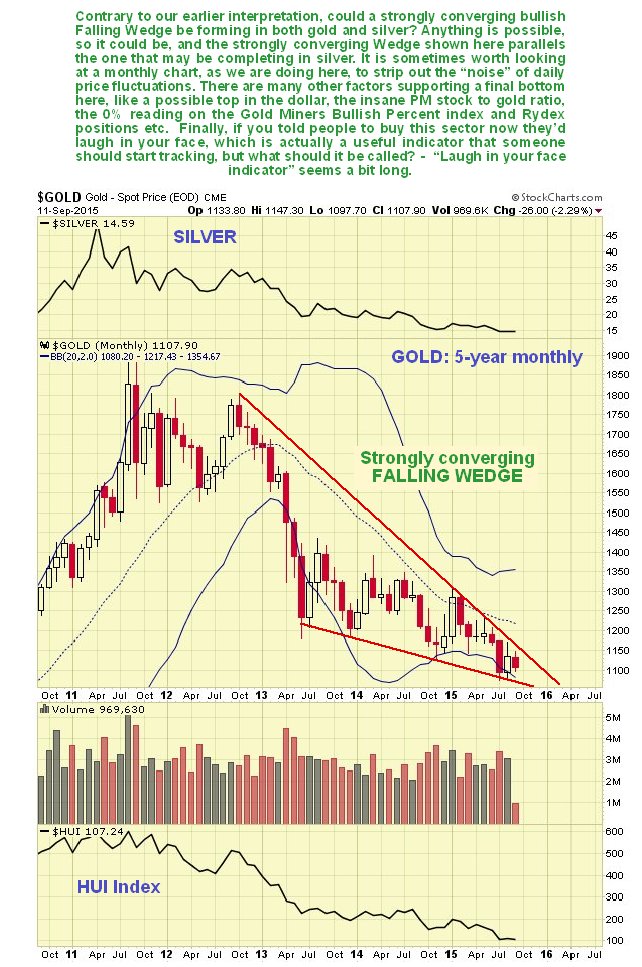
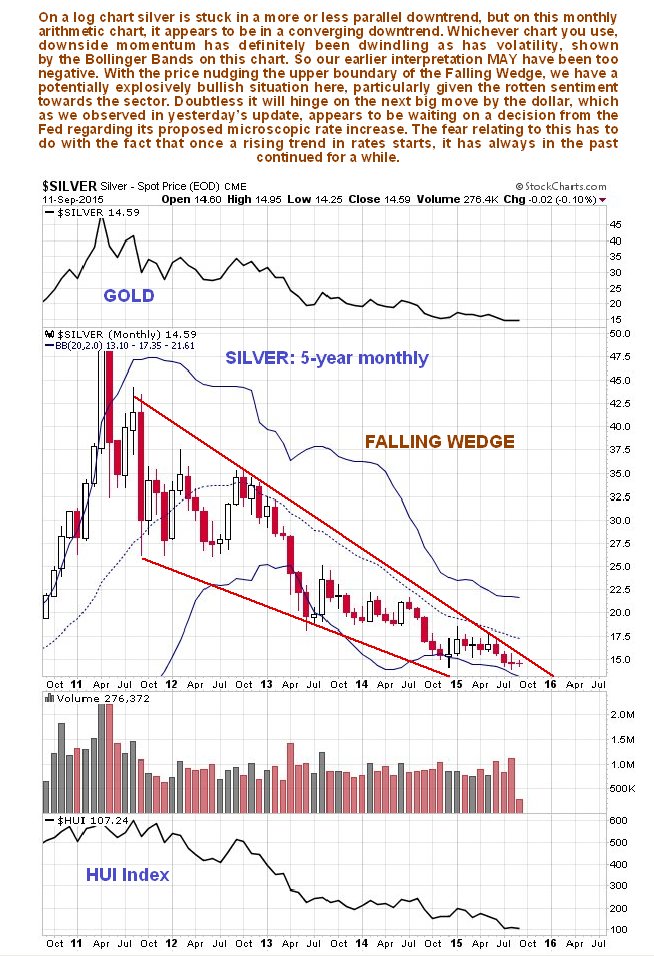
Now we are going to look at gold and silver on a different type of chart from that we have used in the recent past to see if they provide a different perspective. We are going to look at them on 5-year monthly charts, this timeframe being chosen because it shows the entire bear market period from the highs in 2011. The reason for looking at monthly charts is to strip out the “noise” of daily or even weekly movements, to reveal the “bare bones” of the major trend. On arithmetic charts the downtrends for both gold and silver show marked convergence, especially gold, which has marked convergence on its chart even on a log chart, if you use the same channel boundaries that we are using here. On both the gold and silver charts downside momentum has been steadily dwindling as the bear market has progressed, which can be seen on their respective MACD indicators (not shown), and their Bollinger Bands which have been narrowing with the passing of time, show that volatility has been decreasing, as often precedes a major change of trend. With the price of both gold and silver near to the upper boundaries of their respective Falling Wedge downtrends, it clearly wouldn’t take much to for them to break out upside, and if the dollar index did break down clear below 93, this would likely be the catalyst for such a breakout. While this outcome is by no means assured, there is no reason why we shouldn’t prepare for it beforehand, using risk management techniques, as if this scenario does prevail then gold and silver will take off like a rocket. The most effective way to do this is of course Call options, because if you are wrong you lose your modest stake, but if right you really clean up.
Alright, so what other evidence is around to suggest that a big up move may be incubating in the PM sector? – you don’t have to look far to find it, and we will look at some of it briefly now.
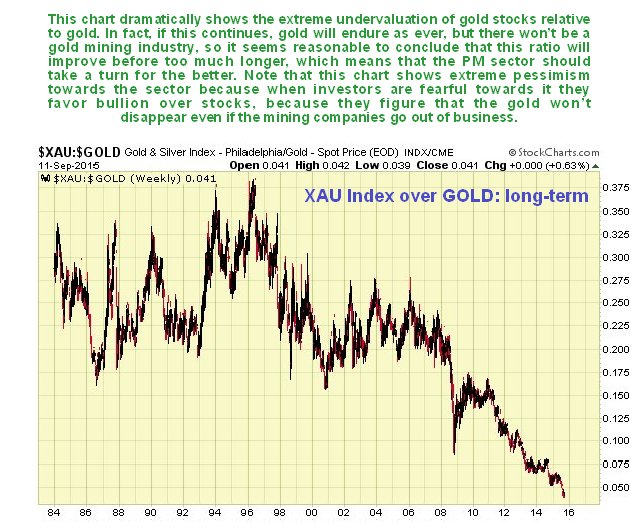
First off we have the awful PM stock to gold ratio, which is now at record lows, way below where it was back before the bullmarket of the 2000’s got started, as we can see on our long-term chart for this ratio shown below…
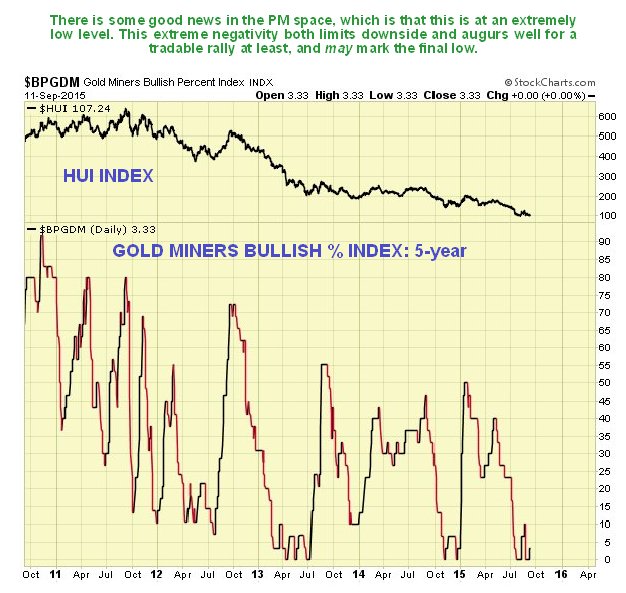
Next we have the abysmal sentiment towards the sector, with the Gold Miners Bullish Percent index having just bounced off 0% and still at a very low 3.3% - it’s almost easier to find 10 ounce nuggets of gold down at your local riverbank than it is to find a PM sector bull. At the very least this suggests that a tradable rally is around the corner, even if prices subsequently sink even lower for a while.
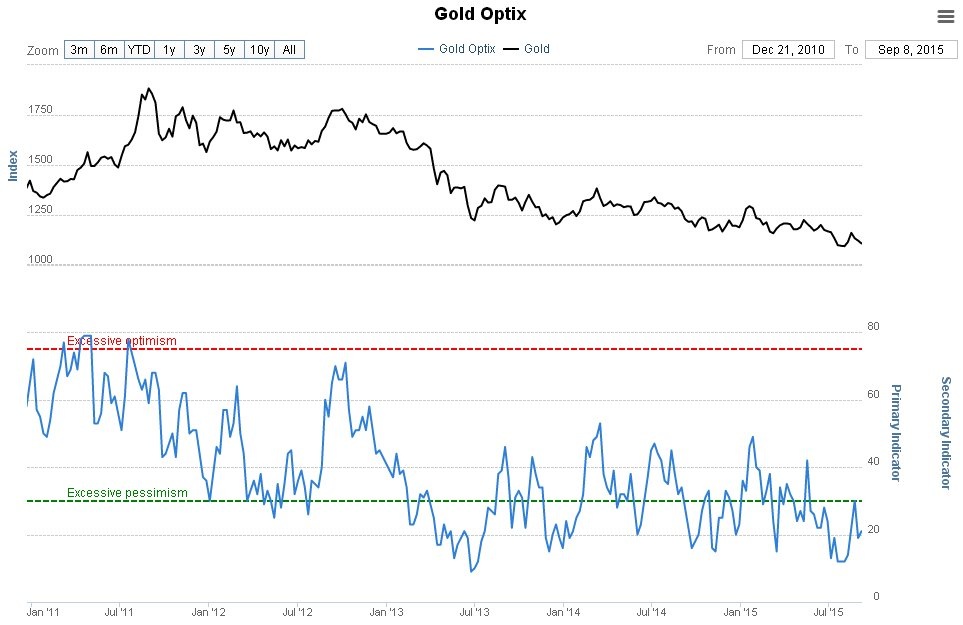
Then universal bearishness towards the sector is also shown on the Gold Optix, or optimism index, shown below…
Finally we have the habitually wrong Rydex traders having an extremely bearish stance towards the sector…
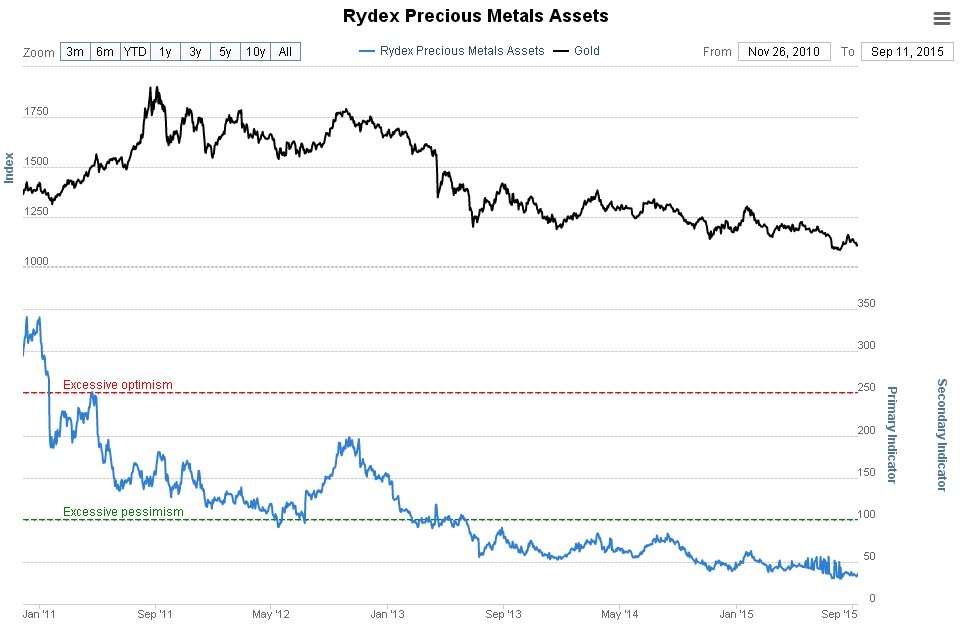
Observe how they stumbled blindly into the Fall 2012 bear trap.
There are more such indications, but you should get the point by now.
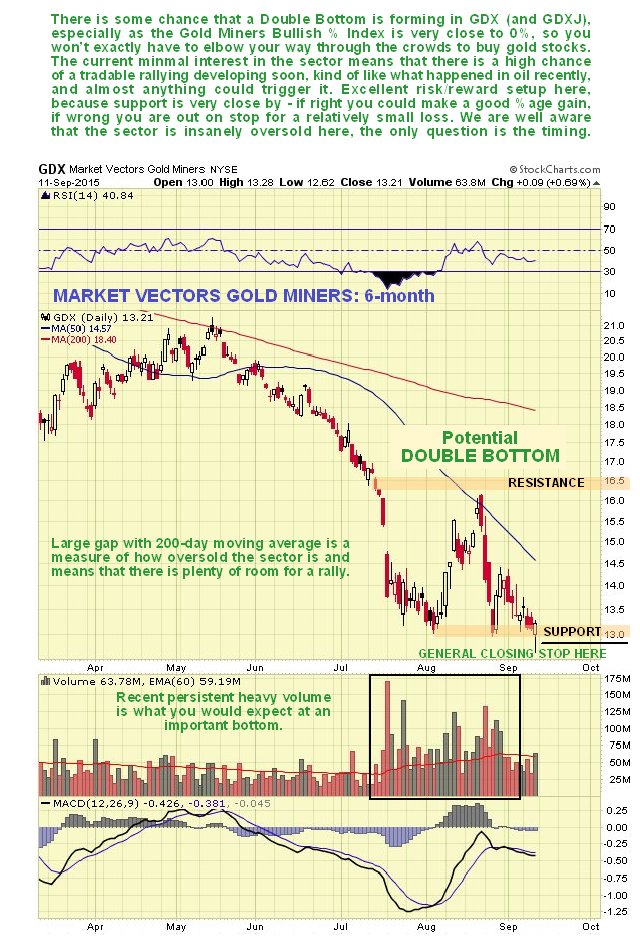
Now we come to the most important part from the standpoint of executing a well-timed low risk trade. The PM sector stock indices are right down on support again, and may be making the second low of a Double Bottom, which could even be their final bottom.
We can see the potential Double Bottom in the PM sector to advantage on the following 6-month chart for the Market Vectors Gold Miners ETF, GDXJ. Given that this is occurring when sentiment towards the sector is in the basement, there is a better than even chance that the sector will stage at least a tradable rally from here.
The 6-month chart for the HUI index shows a similar picture, and this chart is added partly to show gold, the US dollar and the S&P500 index on the same chart for comparative purposes – and this enables us to see that in the recent past the dollar and the stock market have been moving pretty much in lockstep, which means that if the stock market tanks soon as we are expecting it to, the dollar is likely to break down too, which would explain why the PM sector might rally sharply even as most everything else is going down the gurgler.
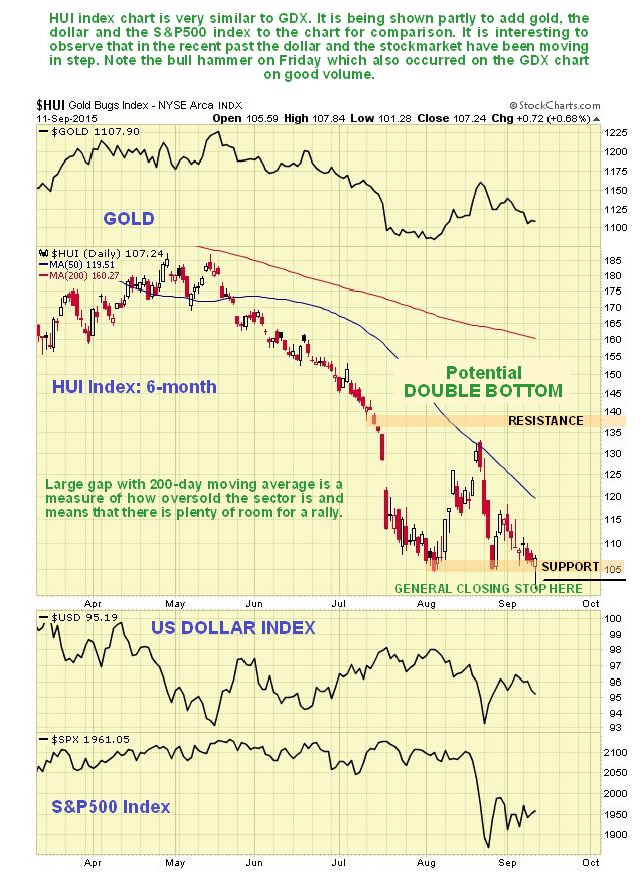
A key point to observe on both these PM sector index charts is the proximity of the indices to quite strong support at recent lows which was severely tested just last Friday. What this means is that we can buy here, perhaps quite aggressively, with confidence, because we can set a close stop below the lows. If the sector rallies we will quickly find ourselves in a very good position, but if it instead breaks down, we are out for a relatively minor and acceptable loss. This is then clearly a highly favorable trading setup.
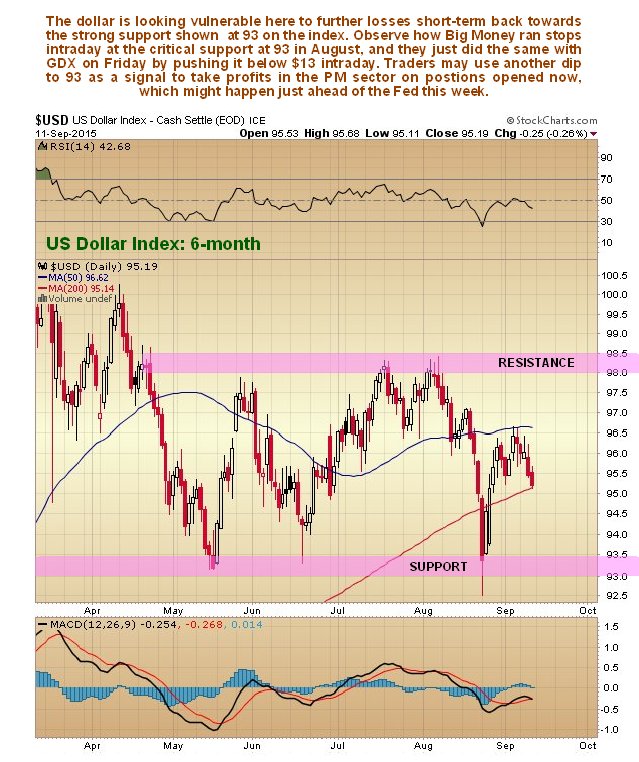
The dollar looks supportive of a PM sector rally here, as it is vulnerable to a near-term dip back towards key support at 93 on the index…
The sector is viewed as an immediate buy here with close stops as indicated for a possibly sharp rally ahead of the Fed. On the site we will be looking at a triple leveraged ETFs to take advantage of this and also selected Call options. Courtesy of Courtesy of http://www.clivemaund.com

Clive P. Maund’s interest in markets started when, as an aimless youth searching for direction in his mid-20’s, he inherited some money. Unfortunately it was not enough to live a utopian lifestyle as a playboy or retire very young. Therefore on the advice of his brother, he bought a load of British Petroleum stock, which promptly went up 20% in the space of a few weeks. Clive sold them at the top…which really fired his imagination. The prospect of being able to buy securities and sell them later at a higher price, and make money for doing little or no work was most attractive – and so the quest began, especially as he had been further stoked up by watching from the sidelines with a mixture of fascination and envy as fortunes were made in the roaring gold and silver bull market of the late 70’s.
Clive furthered his education in Technical Analysis or charting by ordering various good books from the US and by applying what he learned at work on an everyday basis. He also obtained the UK Society of Technical Analysts’ Diploma.
The years following 2005 saw the boom phase of the Gold and Silver bull market, until they peaked in late 2011. While there is ongoing debate about whether that was the final high, it is not believed to be because of the continuing global debasement of fiat currency. The bear market since 2011 is viewed as being very similar to the 2-year reaction in the mid-70’s, which was preceded by a powerful advance and was followed by a gigantic parabolic price ramp. Moreover, Precious Metals should come back into their own when the various asset bubbles elsewhere burst, which looks set to happen anytime soon.
Visit Clive at his website: CliveMaund.com


