Precious Metals Mining Stocks Approaching A Correction


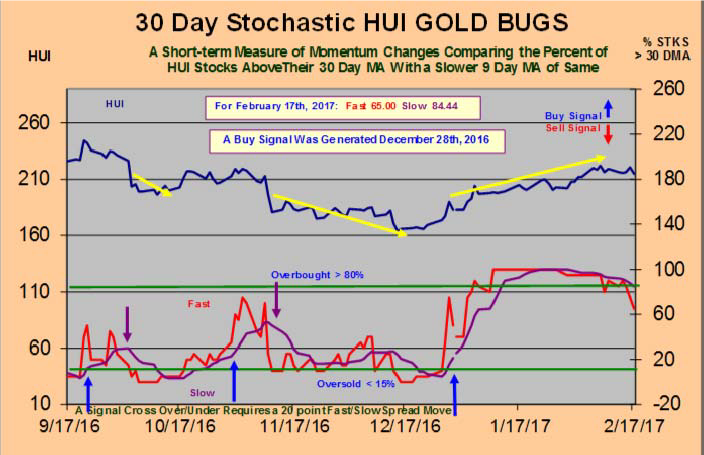
Our HUI Mining Stock Index Key trend-finder indicators remain on a Buy signal this weekend. However, the HUI 30-day Stochastic shown in the chart below is very close to triggering a new Sell Signal, as the Fast has dropped almost 20 points below the Slow measure this past week. This tells us short-term upside momentum is weakening.
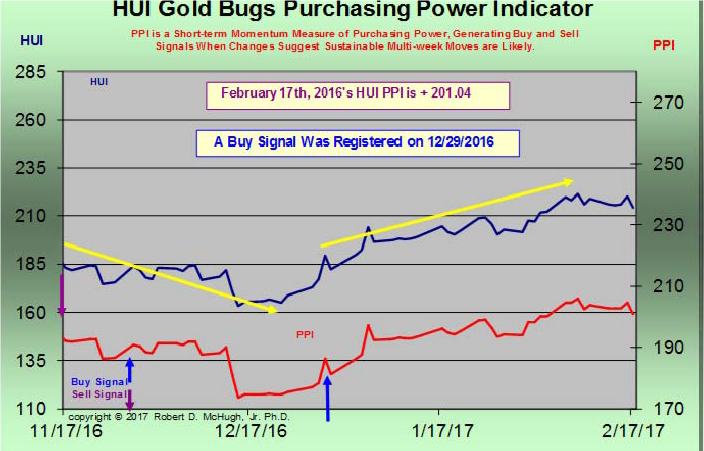
In the next chart, we show the HUI Purchasing Power Indicator and its correlation with Mining stock prices. This indicator is designed to identify the start of meaningful new trends. This weekend it remains on a Buy. Since this Buy signal on December 29th, 2016, the HUI
Mining stock index has risen 32 points, or 17%. Good predictive correlation from this key indicator.
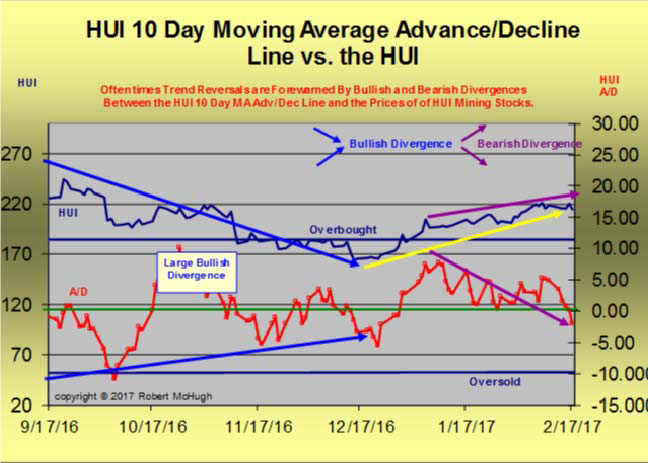
The next chart we show is a correlation between the HUI 10-day average Advance/Decline Line Indicator and Mining stock prices. This weekend this chart is showing a Bearish divergence, as the 10-day A/D indicator is declining while HUI prices are rising, suggesting Mining stocks are approaching a top. A corrective decline inside the larger degree rising trend is likely.
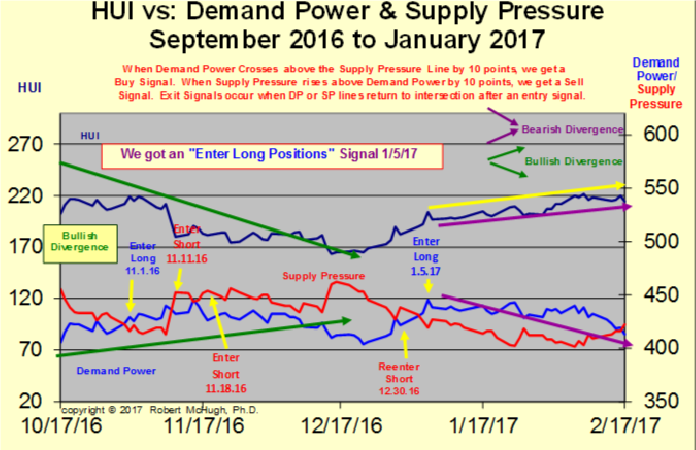
And finally, the next chart we present is a correlation between Mining Stock Demand Power/Supply Pressure measures with prices. Since the HUI Demand Power/Supply Pressure Indicator generated a Buy signal January 5th, 2017 Mining stocks have risen sharply.
However, this weekend we see two issues of concern for this rally. First is that the Demand Power Measure has crossed below the Supply Pressure Measure, not enough to trigger a Sell yet, but getting very close. It needs to drop 10 points below, and it has dropped 9 points below this weekend.
Also, there is a Bearish divergence between Demand Power and Mining stock prices, warning a top is either starting or approaching. It appears Miners are due for a correction within a larger degree rising trend.
********
Every weekend we show these charts and indicators for Mining stocks, which have also done a good job predicting trend turns for precious metals, to our subscribers at www.technicalindicatorindex.com
At www.technicalindicatorindex.com we have developed proprietary key trend-finder indicators and also track and identify high probability starts and conclusions of trends for our subscribers. Any trading program is only as good as the entry and exit indicators used. Get a FREE 30 Day Trial Subscription to receive our Daily and Weekend U.S. and International Market Forecast Reports at www.technicalindicatorindex.com Simply click on the button at the upper right of the home page. We cover stock markets and Gold daily and have Buy / Sell signals. We also offer a Platinum Trading service. Email us at [email protected] for information on that program. When did Noah build the ark? Before it rained. Well, it is starting to rain. We believe it is now time to make sure our arks are built and can float. We can help you at ww.technicalindicatorindex.com with our daily and weekend market updates, or conservative portfolio model, and Platinum educational Trading program.
Do not be satisfied hearing what the market did; learn how to predict what the market is going to do. Join us at www.technicalindicatorindex.com as we study the language of the markets. Markets tell where they are headed. Technical Analysis is the science where we learn and apply the forecasting language of the markets.
Dr. McHugh’s book, “The Coming Economic Ice Age, Five Steps to Survive and Prosper,” is available at amazon.com at http://tinyurl.com/lypv47v


