Precious Metals Supply-Demand Report


Fundamental Developments
The price of gold dropped two bucks, and silver two cents. However, it was a pretty wild ride around the time when some information came out from our monetary masters at their annual boondoggle at Jackson Hole. We will show some charts of Friday's intraday action below.
As always, the question is which moves are driven by fundamentals, and which by speculation? We will show graphs of the basis, the true measure of the fundamentals.
But first, here are the charts of the prices of gold and silver, and the gold-silver ratio.
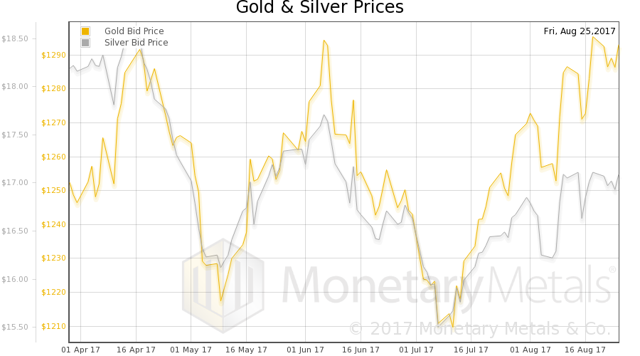
Prices of gold and silver
Next, this is a graph of the gold price measured in silver, otherwise known as the gold to silver ratio. The ratio barely budged.
In this graph, we show both bid and offer prices for the gold-silver ratio. If you were to sell gold on the bid and buy silver at the ask, that is the lower bid price. Conversely, if you sold silver on the bid and bought gold at the offer, that is the higher offer price.
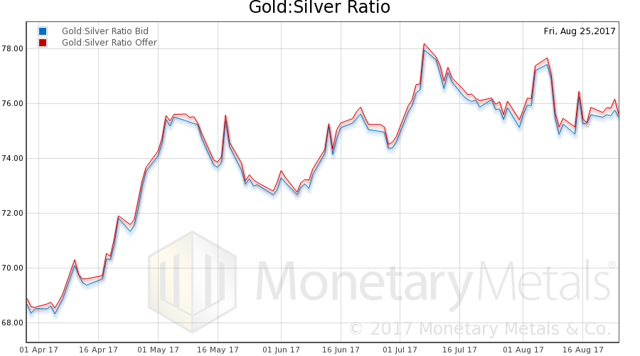
Gold-silver ratio, bid and ask
For each metal, we will look at a graph of the basis and co-basis overlaid with the price of the dollar in terms of the respective metal. It will make it easier to provide brief commentary. The dollar will be represented in green, the basis in blue and co-basis in red.
Here is the gold graph.
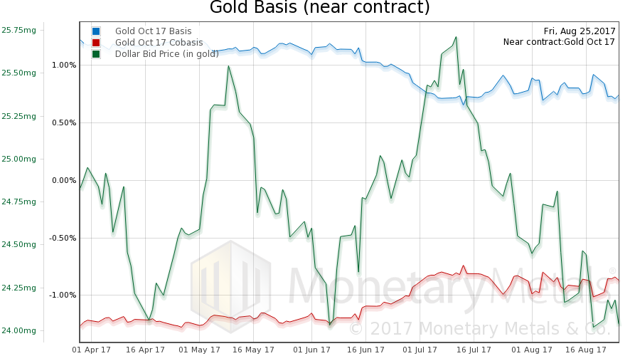
Gold basis, co-basis and the US dollar priced in milligrams of gold
The price didn't move much, and neither did the basis.
So our calculated gold fundamental price was up $5, to $1,330.
More interestingly, let's look at the basis action when the price was gyrating on Friday.
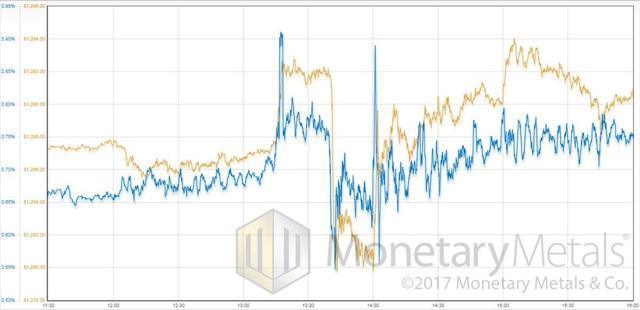
Gold price and gold basis intraday on Friday last week
The correlation between basis and price is uncanny, isn't it? And it works in both directions. Manipulators speculators were buying paper gold from around 13:15 GMT (which is 14:15 BST or 9:15 NY time). Then these same manipulators speculators - or was it a different group who overpowered the first, hm? - started selling at around 13:40. Then buying resumed at 14:00.
We are joking about the manipulation, of course. In our view, superstition thrives where people struggle to explain what they see without a scientific theory. Once upon a time, they saw thunder and lightning and thought the gods were having battle, or perhaps expressing anger at some sin of man. Such mythology could not survive the advent of the field of meteorology (if even that long).
The manipulation myth similarly doesn't belong in a world where there is an arbitrage theory of markets, and daily pictures of the basis and co-basis.
Note also the rise in price at 15:00, without a rise in basis. That likely reflects some buying of physical metal.
Now let's look at silver.
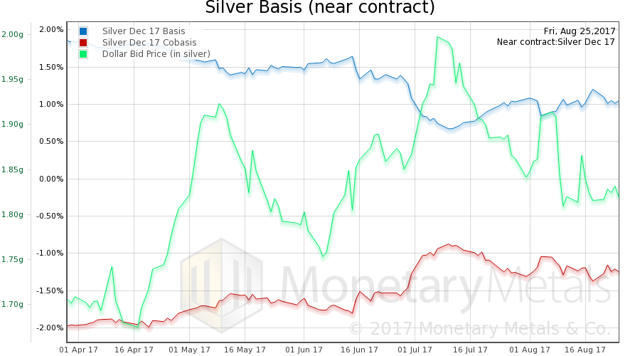
Silver basis and co-basis and the dollar priced in grams of silver
The basis fell and the co-basis rose. Not a lot, but it did lift our calculated silver fundamental price $0.20 to $17.18.
Here is the intraday price and basis graph for silver during Friday's roller-coaster.
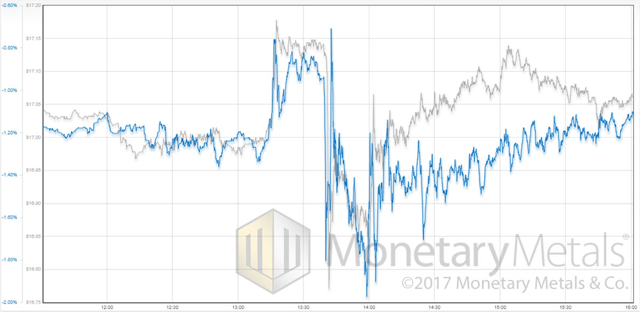
Silver price and silver basis intraday on Friday
As with gold, the basis tracks the price. The moves in both directions were driven by speculative trading.
© 2017 Monetary Metals
 Dr. Keith Weiner is the CEO of Monetary Metals and the president of the Gold Standard Institute USA. Keith is a leading authority in the areas of gold, money, and credit and has made important contributions to the development of trading techniques founded upon the analysis of bid-ask spreads. Keith is a sought after speaker and regularly writes on economics. He is an Objectivist, and has his PhD from the New Austrian School of Economics. His website is www.monetary-metals.com.


