The Recent Price Earnings Ratio Is Forecasting A Stock Market CRASH
 share
share
 share
share
 share
share
 share
share
 share
share

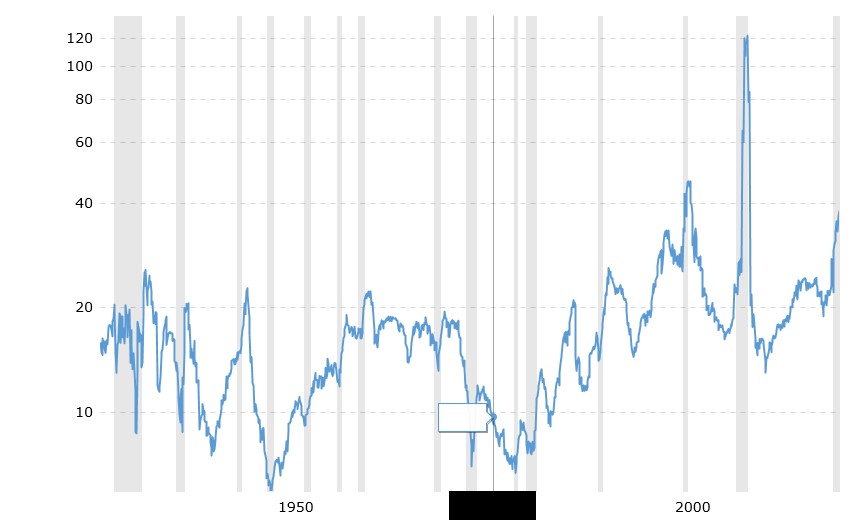
Early this month, the S&P500 P/E ratio was 52% higher than its modern era average. By this valuation, the market is OVERVALUED. To fall back to the modern era average, the S&P500 would need to plunge to around $2,200.
TODAY THE PRICE/EARNINGS RATIO IS 38…AND RISING FAST!
This Is Not Financial Advice
Current Market Valuation is meant to be used as an educational resource to help readers understand today's market in a historical perspective. This might be useful context to have when making investment decisions, but this is absolutely not presented as, or intended to be used as a singular investment strategy.
What Was the Stock Market Crash of 1929?
The stock market crash of 1929 began on Oct. 24. While it is remembered for the panic selling in the first week, the largest falls occurred in the following two years as the Great Depression emerged. In fact, the Dow Jones Industrial Average (DJIA) did not bottom out until July 8, 1932, by which time it had fallen 89% from its Sept. 1929 peak, making it the biggest bear market in Wall Street’s history. The Dow Jones did not return to its 1929 high until Nov. 1954.
HISTORIC PRECEDENT TO REMEMBER
- In October 1929 the Price/Earnings ratio of US stocks was 45.
- In 2000 the P/E ratio before the crash was high (see above chart) …and
- In 2007 the P/E ratio before the crash was also high (see above chart).
- TODAY THE PRICE/EARNINGS RATIO IS 38…AND RISING FAST!
THE BEARS ARE GATHERING…so beware!!
Source: https://www.currentmarketvaluation.com/about.php
********
share
share
share
share
share