Rising Bond Yields ARE NOT Good For Stocks


The Dow Jones (Blue Plot / Left Scale below) closed above 14,000 for the first time since October 2007. Closed above 14,000 in nominal dollars that is. In constant 1979 dollar terms (Red Plot / Right Scale) the Dow Jones today closed 30% below its high of October 2007, and 44% below its highs of January 2000! Unfortunately, your taxes are based on the nominal dollar gains seen below, but your inflation adjusted losses (Red Plot) are all yours. I know I don’t want them! Why anyone is still in the stock market is beyond me. My advice would be to exit the stock market while it is going up, and buy some gold and silver while precious metal prices are still low.
US Treasury yields have been rising since last June. Below is a 30 year Treasury bond with 14 years to go. Its current yield (Red Plot / Right Scale) fell to 1.91% in Barron’s 04 June 2012 issue. But that was a long time ago; this week it closed with a 2.51% yield. Treasury bonds have been losers since last June. The market valuation for this bond is down 7.47% since June. If you’re a fiduciary of other people’s money using T-debt for reserves, that isn’t good.
Now, Doctor Bernanke can always purchase more debt and drive these bond prices back up, but one of these days that old trick isn’t going to work, and then the markets will become very interesting. Lots of talk today about how rising bond yields (declining bond prices) will prove to be beneficial to the stock market. But during the 1980s and 1990s there was lots of talk about lower bond yields being beneficial for the stock market. Well it was, so I don’t understand how today’s rising bond yields will prove to be a positive factor for stocks in the future?
For one thing bond yields and stock dividend yields compete for investment money seeking income, and many institutions and individuals invest for income. Should bond yields rise above 6%, it’s unlikely that the Dow dividends will remain at their current levels of 2.50%. Assuming a constant dividend payout, seeing the Dow’s dividend yield increase from 2.5% to just 5% would cut the Dow Jones nominal dollar value in half; from 14,000 to 7,000. The table below shows the bear-market mathematics I expect we will soon have to become familiar with, and Mr Bear is an excellent mathematician.
Currently, the Dow Jones is yielding 2.49% while paying out $348.61 in cash. If we divide the Dow’s $348.61 payout by its 2.49% yield, we get 14,000 for the Dow Jones valuation. Just $9 off the Dow Jones published closing price for this week. In the table below, to find the value of the Dow Jones at say a 6% yield, and $200 in cash payout, one only has to see where these two variables cross: A Dow Jones value of only 3,333. In other words, a 6% yield and $200 payout would cause the Dow Jones to crash by 76% from the Dow’s highs of October 2007!
These yields above, except the 12%, are all in within the Dow Jones historical range, as seen in the chart below. Also, as it was well know many decades ago (but totally ignored today); bull markets occurred when the Dow Jones dividend yield is above 6%, and continued until the Dow Jones yielded around 3%. Bear markets occurred when the Dow was yielding around 3%, and didn’t terminate until it once again rose to over 6%. This bull/bear market model worked just fine until Alan Greenspan became the Fed Chairman, and inflated the stock market until the Dow Jones was yielding a minuscule 1.30% in January 2000. And he knew exactly what he was doing long before he did this to us!
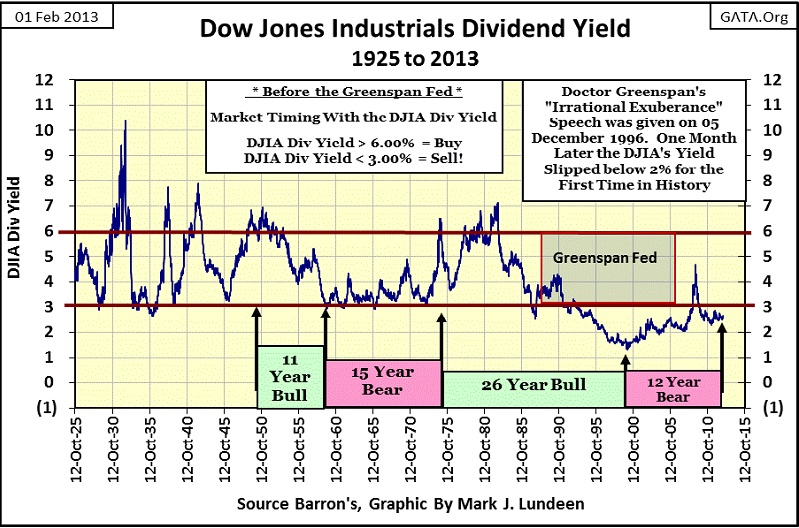
The stock market’s current problem is that one day, the Dow Jones’ dividend yield will once again rise above 6%, and it will be very painful! On 09 March 2009, the Dow Jones was yielding 4.74% when it declined 54%, not even the traditional bear market termination point of a 6% yield. The stock market was so horribly inflated, it only took a 4.74% yield for the Dow Jones to see its #2 bear market bottom since 1885 (chart above).
And we need to also be mindful of the potential for a sharp decline in the Dow Jones dividend payout. From 1929-33 it declined 76.6%.
During a deep economic contraction, cuts in dividend payouts must be anticipated. Could we see a decline in the Dow Jones dividend payout on a scale of 1932? With President Obama’s tax increases and the never ending increases in debt levels weighing down the US economy, I believe we are heading into another Great Depression. So, I expect to see deep cuts in the Dow’s dividend payout of over 50% in the years to come.
If we take the Great Depression’s yield and payout for the Dow Jones; where does that leave the Dow Jones valuation at the bottom of our bear market?
Dividend Payout ------: 76.6% decline from $348.61 = $80.18
Dividend Yield ---------: 10.38%
Dow Jones Valuation : 772.44
That is a big drop, a decline of 95% from the Dow’s high of October 2007. If this is our future, the coming bear market will replace the 89% decline of 1932 as the Dow Jones deepest bear market.
So, here are two stock market facts of life: During bull markets, the bulls value stocks based on anticipated capital gains. “Dividends,” the bulls ask? “What’s that?” But in bear markets, when capital gains become only pleasant memories of times long ago, stock market valuations are then based on dividend yields and payouts. And dividend yields * WILL RISE * with US Treasury yields; and dividend payouts * WILL DECLINE * with the economy.
The current talk about rising bond yields being good for stocks is coming from the same people who pushed the public into high-tech stocks and then recommended real estate during the housing bubble. These “financial experts” only expertise is on how best to separate the public from their money.
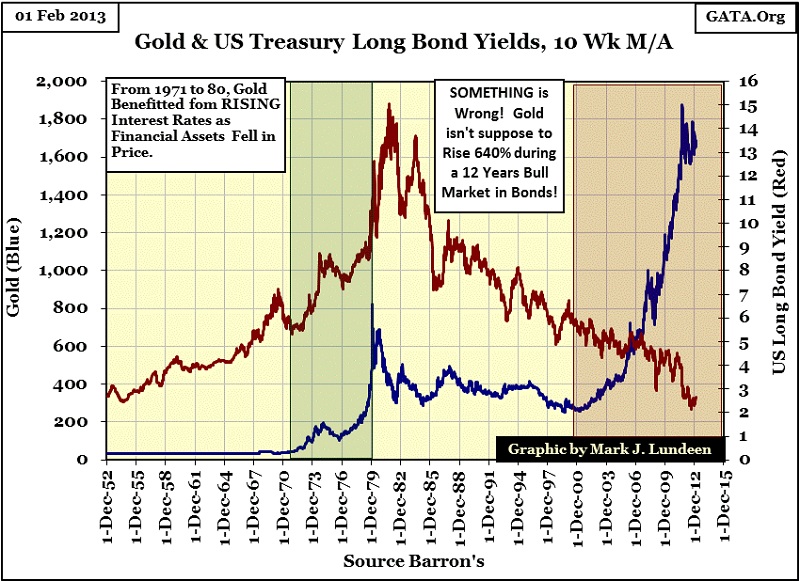
If you want to know what * WILL * go up with bond yields, it’s gold and silver (Blue Plot below). During the 1969 to 1980 bull market in gold and silver, bonds (Red Plot below) were in a horrific bear market. The higher bond yields rose, the higher gold and silver soared. The 1980-2001 precious metals bull market occurred during a rip roaring bear market in bonds.
Then something very strange happened in the chart below; in 2001 gold began to rise up as the bull market in bonds continued for another eleven years. When we consider the current financial situation of the United States’, and the imbecilic “policies” that transformed the United States financially into a banana republic, it makes perfect sense that gold would move up over a thousand dollars above its high of 1980. But seeing bonds continuing on in their bull market, suggests the world believes that the US Government finally became a responsible organization by cutting debt and controlling its monetary inflation. However, that’s not the case at all!
I’ve predicted that gold will one day see $30,000 an ounce, with silver soaring to over $5000 an ounce, but I can’t say when. However, think of what will happen with the $16.5 trillion dollar Treasury market in a state of panic, and when flight capital rediscovers gold and silver. When current yields for the US Treasury’s bond market reaches, and exceeds 6%, the gold and silver markets will be on a whole new level.
Looking at silver’s step sum chart below, I decided to reposition my bear boxes as there’s a bigger picture to see below. Remember that the step sum trend (Red Plot) is a market sentiment indicator, but the price trend (Blue Plot) is market reality. Usually, when the step sum trend is opposing the price trend, forming a step sum box, market sentiment is out of step with market reality. But look at silver and its step sum since September 2011. Market sentiment seems not to care at all about the price trend. Silver’s price and step sum trends have been fighting each other for a year and a half. Are the bulls stupid or something? I don’t think so! Sometime in 2013, I suspect a big move up in silver just because the silver bulls seem determined to have it their way.
Gold’s step sum chart (below) is completely different from silvers’ above. The gold bulls are much more compliant to gold’s price trend. If big news is coming from the precious metals sometime soon, it will be silver making the headlines.
Mendacity is a system of lies, and that best describes the bullish talk coming from Wall Street on bonds and stocks. Be careful out there, because in 2013 the US Government is looking out for the big banks, not its citizens. It’s all about money, and Washington doesn’t have to say “please” when they pick our pockets.
Mark J. Lundeen


