Savers Are Just Collateral Damage


A reader asked us this week about the personal savings rate. Most people can sense that something is wrong if the rate is in a long-term falling trend, or if it falls too low (whatever level that may be). We argue that falling savings is part of the larger process of capital destruction. And unfortunately, one should expect falling savings rates when there is falling yield purchasing power.
The personal savings rate is defined as the ratio of personal saving to disposable personal income. Income excludes capital gains (as it should!) It is a measure of how much is left. This savings will pay for the saver’s own future, and in the meantime it is (presumably) invested to finance the production of new goods and services (and the government’s ever-growing welfare expense).
The personal savings rate is in a secular decline. As with other trends we have examined (e.g. marginal productivity of debt), the decline has a high correlation with the falling interest rate. Here is a graph.
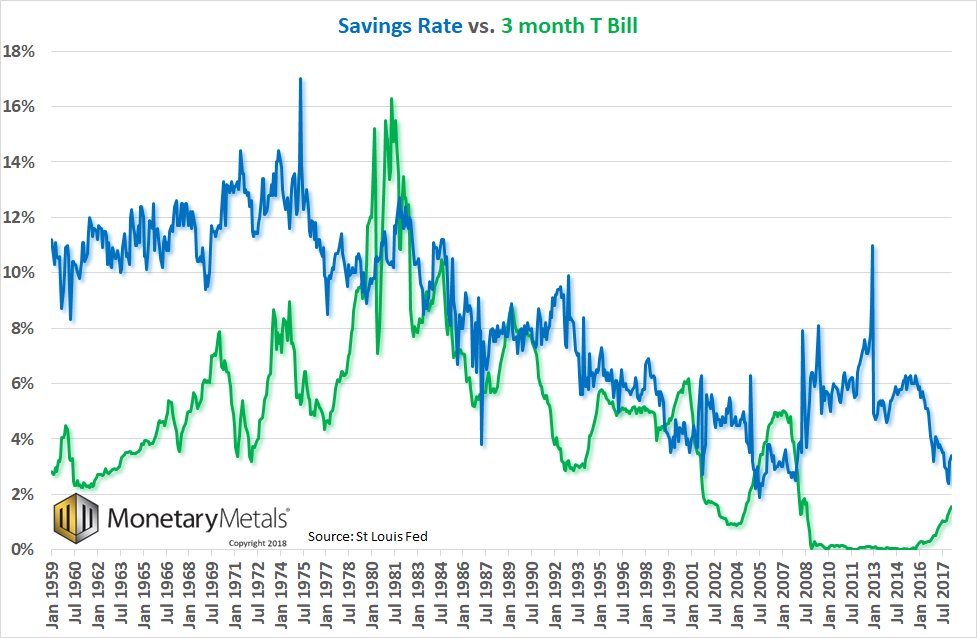
This graph has three phases that must be addressed. One, is the rising interest rate period following WWII. We see no particular correlation between the savings and interest rates. One could argue that the savings rate was in a sideways trend around 11% until just after the interest rate spiked in 1981.
Even though one need not explain why two data series are not correlated, we want to address it, because they become correlated later. So why weren’t they correlated until after 1981? During the period of rising rates and consumer prices, yield purchasing power was almost constant. Prices were rising—but so was the rate earned by savers. Below is a chart we have previously published.
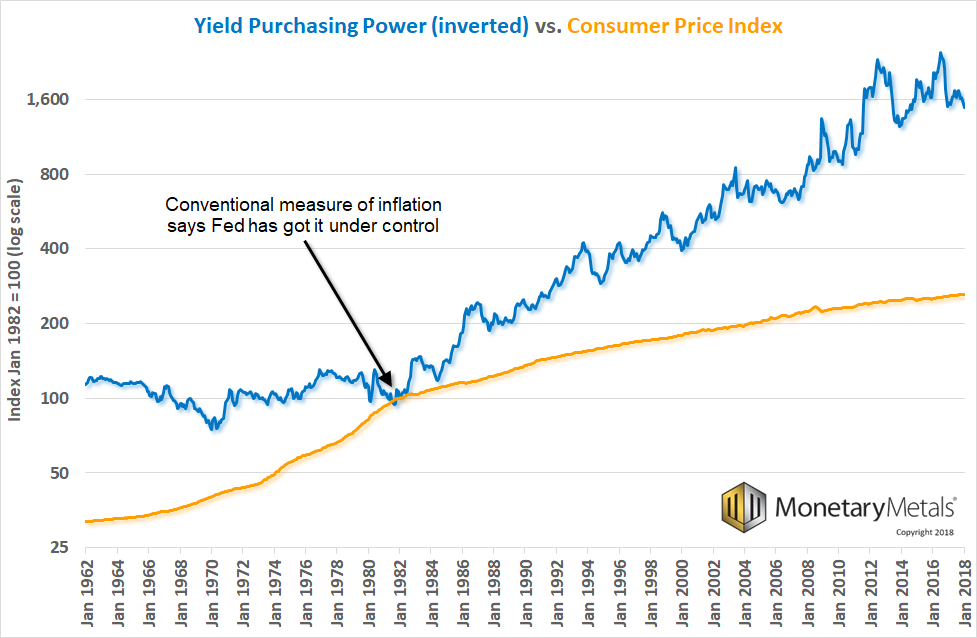
During the rising rates environment, there was no crisis of savings.
Poorer Savers Panic
Back to the graph of the savings rate, the crisis period of 2008-2012 is the second phase that we need to address. The interest rate drops to near zero, but the saving rate spikes. We believe that the cause is simple. With the massive drop in asset prices, people felt much poorer and therefore panicked. Most felt a need to increase their savings to try to get back on track to their retirement goals.
However, since then asset prices have recovered. With rising asset prices, people feel comfortable once again. The urgency of saving subsided.
We address 1981 through the global financial crisis last, because we want to focus on it. And we believe that the post-2012 period should be viewed as part of this trend.
The correlation of falling interest and falling savings is pretty obvious. Normally, we’re pretty suspicious of any claim that correlation proves causality. However, this is a long period of time. It beggars believe that two falling trends for 27 years have no relationship. These are no small data sets, either. The T Bill market is the most liquid market in the world, and the savings rate of the largest economy in the world is taken from a population of hundreds of millions of people. Also it should be noted, savings fell from a range of around 11-12%, to under 2%. This is significant, no matter what.
A facile explanation comes from asking: why should people bother to save, if the rate they earn on savings is so low? Of course, some people will respond to the perverse incentive of low rates by not saving. However, most people want to accumulate wealth and prepare for retirement. So this explanation is lacking.
There are three parts to our explanation of why the falling interest rate pushes down the savings rate. This relationship is no figment of the imagination, conceived in an armchair in an ivory tower (fueled with booze). It is a fact that both interest and saving fell together for decades. We are explaining this fact.
The first part of the explanation is a subtler point than the argument above about incentives. Income includes interest earned on savings. As the rate falls, the interest earned on all extant savings also falls. If Clarence had $100,000 in 3-month T Bills in 1979, he earned about $10,700. By 1994, that same $100,000 earned only $4,300. Indeed, Clarence would have had to increase his savings to $250,000 to earn the same interest in 1994 that he got in 1979.
Liquidating Assets to Cover Expenses
The second factor is, with less interest earned, people are forced to liquidate assets in order to cover expenses. These expenses would have been covered by earning interest, back when interest rates were higher. But now, they have no choice but to sell (and capital gains are not including in income). This is a picture of the economy in liquidation mode, as we have described in other terms.
If John has $100,000, earning under 0.1% until the Fed began its current hiking cycle, then that gives him under $100 of interest. Assuming 2.5% is normal, which would have paid $2,500, John has a $2,400 shortfall to make up somehow. For many people, somehow means selling assets.
The drop in interest reduces John’s savings as measured in the statistic two ways. One, he earns less income. Two, he reduces his net assets. As the Bureau of Economic Analysis explains:
“Personal saving may also be viewed as the net acquisition of financial assets (such as cash and deposits, securities, and the change in life insurance and pension fund reserves), plus the net investment in produced assets (such as residential housing, less depreciation), less the net increase in financial liabilities (such as mortgage debt, consumer credit, and security credit), less net capital transfers received.”
Note the bit about “less the net increases in financial liabilities”. That means if John takes out a mortgage on his house, rather than selling it, that also counts against his saving rate.
As we have said many times, a falling interest rate acts as a continually-increasing perverse incentive. At the same time, that the falling rate is squeezing John’s income, it is doing something else too. The market says to John, “hey would you like to borrow at 8% today?” John says no. A while later “hey would you like to borrow at 7%?” Then 6%, and so on. The rate has kept falling for nearly four decades (with correction along the way). This is the last third of the explanation of the falling savings rate.
John (A) earns less income, (B) must sell assets to make up the shortfall, and (C) has both motive (falling rates) and need (shortfall) to borrow more.
After writing the first draft of this article we saw a commercial, with Tom Selleck, selling reverse mortgages. We don’t know whether this septuagenarian makes a good spokesman for the home-consumption demographic. However, we see this as one more way for retirees to borrow to pay living expenses. One more way for the personal savings rate to drop. And to tie it into our explanation of the period 2009-2012 when the personal savings rate rose in a countertrend move, we would bet that these loans (along with many others) were not offered from 2008 through around 2012. Credit was harder to get, then. But we’re back to “normal” now…
The next time some economist-type recites the standard canard about purchasing power, GDP, and unemployment, as the justification for increasing the quantity of dollars please tell him that these increases are not causing rising prices. They are causing falling interest rates. And the collateral damage of falling interest is unacceptable.
Ask this economist-type what, in his theory of the economy, happens when savings go negative? Tell him that Keynes thought the saver was a functionless parasite. Ask him if he agrees with Keynes, or if he has some other notion of what is supposed to happen when savings goes negative.
Our idea is: this is one more perspective to see the coming heat death of the economic universe.
Keith will give a talk in Las Vegas on May 9. Please contact us if you would like to attend.
Supply and Demand Fundamentals
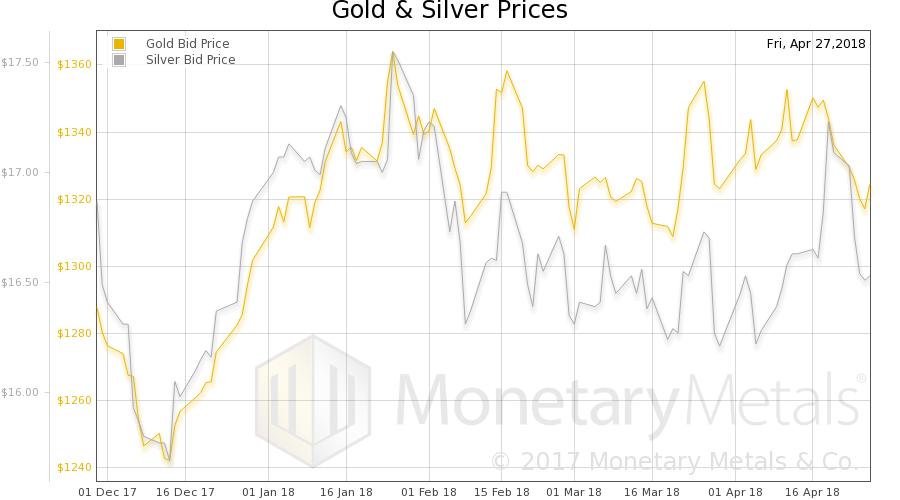
The price of gold fell $12, but that of silver dropped 63 cents. Wassup with silver?!
A prominent analyst wrote on April 19 of the “breakout” in silver. Of course, without the benefit of the basis and the Monetary Metals fundamental price, he could only see the price chart, plus the regular Wall Street indicators such interest rates, oil, and inflation. Based only on those indicators, and blind to the fundamentals, he top-ticked the price of silver almost perfectly. The price hit a high of $17.36 that day, and since then it’s all been downhill, through Friday’s close 89 cents below when he called for the price to take off.
Last week, we said:
“Has the silver fundamental had a breakout? We would want to see more evidence before pronouncing this. Heck, even the market price has not surpassed its level from January yet.”
The week before (April 15), we said:
“The fundamental is now back where it had been in the third week of March. Unlike in gold, there is no rising trend for the silver fundamental. It’s been sideways action since September last year, and arguably a downtrend of lower highs since February 2017.”
The putative replacement for the petrodollar, the petroyuan, has been sagging since the last date given by some gold bugs for the collapse of the dollar (that collapse, by the way, has been re-scheduled for this summer sometime when the “IMF will alter financial laws”), in case you’re keeping a calendar of such predictions).
We remain firm to our idea that any oil producer who wanted gold, could have been selling oil futures and buying gold futures for 40 years In New York. This trade has long been possible, so instead of looking for a new market that offers it, we should look for an explanation of why the oil producers don’t want to sell their oil for gold (Keith discusses reasons why they would want to do it in his talk at the Harvard Club).
We will look at the picture of the silver fundamentals and discuss the prognosis below. But first, here is the chart of the prices of gold and silver.
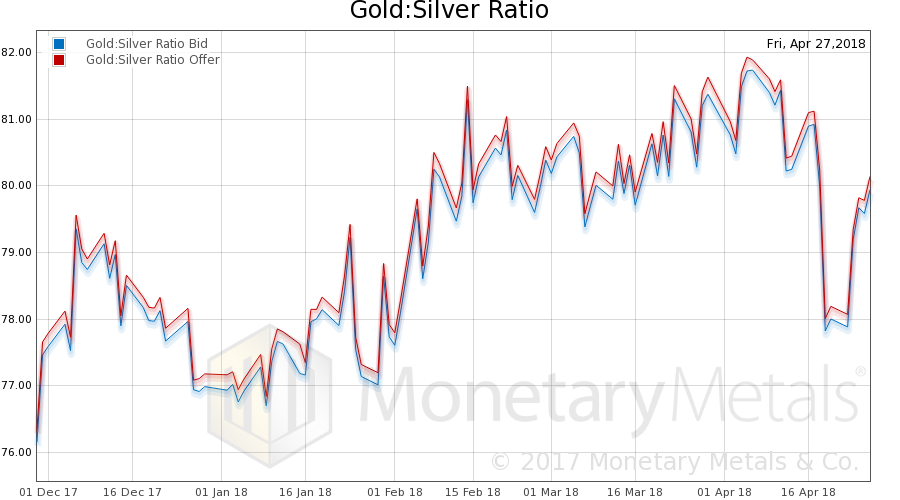
Next, this is a graph of the gold price measured in silver, otherwise known as the gold to silver ratio (see here for an explanation of bid and offer prices for the ratio). Big rise in the ratio.
Here is the gold graph showing gold basis, cobasis and the price of the dollar in terms of gold price.
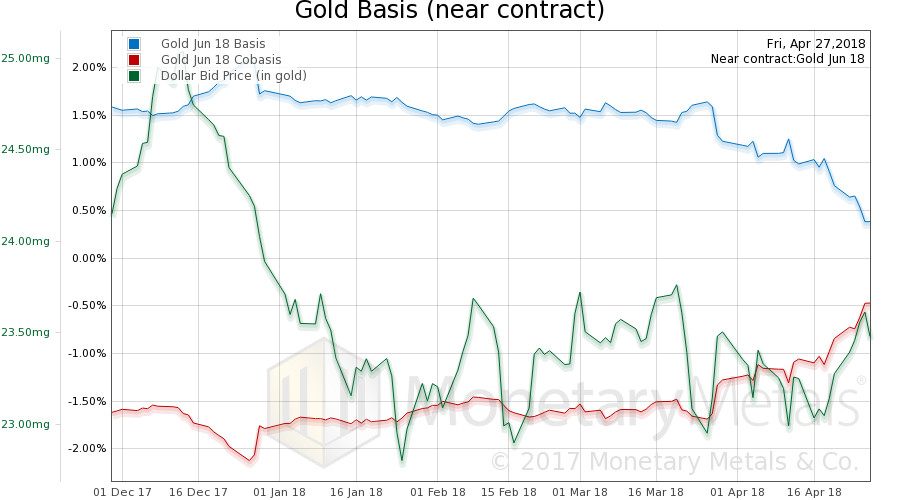
The market price of gold fell, but scarcity (i.e. cobasis, red line) rose.
The Monetary Metals Gold Fundamental Price rose $31 this week to $1,538.
Now let’s look at silver.
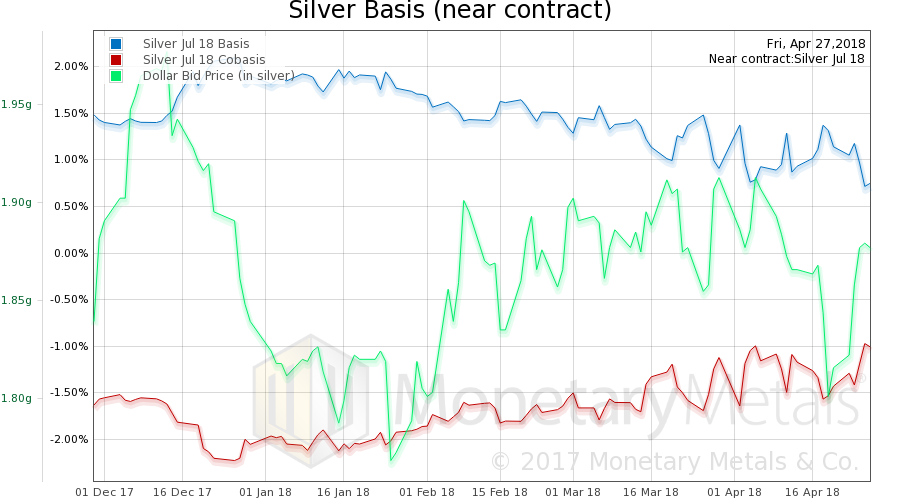
In silver, the pattern this week was the same as in gold. The scarcity increase a bit as the price fell. However the price of silver fell considerably more than the price of gold did. Perhaps the selling this week was liquidations of those who bought metal last week…?
The Monetary Metals Silver Fundamental Price fell 28 cents to $17.49.
With that drop, the fundamental price of silver is back in the sideways range it has occupied since at least June last year. And arguably since July 2016.
Look, we can argue over whether the price of silver “should” react to China, interest rates, unemployment (record lows, we hear, if you don’t count 96 million people in the workforce), etc. However, this reaction will be a self-fulfilling prophecy of futures traders all trying to front-run the rush to buy the metal that they imagine “should” occur. And they will be front-running only themselves.
What we can’t argue—not this is not technical analysis, GATA—is that a shift to sustained buying of real metal will be pulling metal out of the warehouse. Which is the opposite of the current trade. The continuous silver basis is about 2%. Thus it makes sense for traders to buy the metal and sell it forward, to pocket 2% annualized (net of bid-ask spreads, but not including trading commissions).
Another way to look at this is that buying of real metal will push up the offer price on spot. Remember:
Basis = Future(bid) – Spot(offer)
Buying of real metal will cause a drop in the basis. For whatever reason, or reasons, there is a high basis right now. Could the price rally on futures exuberance only? Sure it could. How far could it rally? In past years, we recall a market price three bucks above the fundamental. So twenty bucks or so. How long could it hold? It can hold longer than you can stay solvent shorting it (to paraphrase one of our least favorite economists).
But one does not bet that the price of something will move against its fundamentals.
NB: the fundamental price is above the market. So you could bet on a rising market price to a point. The above discussion was about the possibility of a breakout, which we assume no one thinks means up a dollar to $17.50.
© 2018 Monetary Metals
 Dr. Keith Weiner is the CEO of Monetary Metals and the president of the Gold Standard Institute USA. Keith is a leading authority in the areas of gold, money, and credit and has made important contributions to the development of trading techniques founded upon the analysis of bid-ask spreads. Keith is a sought after speaker and regularly writes on economics. He is an Objectivist, and has his PhD from the New Austrian School of Economics. His website is www.monetary-metals.com.


