The Short Position in SLV Jumps Almost 20 Percent
 share
share
 share
share
 share
share
 share
share
 share
share
The gold price began to struggle higher starting minutes after 10 a.m. China Standard Time on their Friday morning -- and that rally attempt was capped and turned lower minutes before 2 p.m. CST -- and for the final time at the London open. It was then stair-stepped somewhat unevenly lower until the market closed at 5:00 p.m. in New York...with the rally starting at the noon silver fix in London, running into "all the usual suspects" at the COMEX open.
The high and low ticks in gold were recorded by the CME Group as $1,803.70 and $1,786.50 in the October contract -- and $1,806.00 and $1,788.20 in December. The October/December price spread differential in gold at the close yesterday was $2.20...December/February was $2.10 -- and February/April was $1.70 an ounce.
Gold was closed on Friday afternoon in New York at $1,786.80 spot, down $7.40 on the day -- and also on its low tick. Net volume was ultra light at a hair over 129,000 contracts -- and there was about 7,900 contracts worth of roll-over/switch volume on top of that.
Silver's high tick was printed around 1:50 p.m. CST on their Friday afternoon -- and the price pressure after that began in earnest around 10 a.m. in London. That uneven engineered price decline also lasted until trading ended at 5:00 p.m. in New York.
The high and low ticks in silver were reported as $24.345 and $23.76 in the December contract. The September/December price spread differential in silver at the close yesterday was 4.5 cents...December/March was 4.9 cents -- and March/May was 3.1 cents an ounce.
Silver was closed in New York on Friday afternoon at $23.68 spot, down 32.5 cents from Thursday -- and also on its low tick of the day. Net volume was exceedingly light at a bit under 38,500 contracts -- and there was only about 1,120 contracts worth of roll-over/switch volume in this precious metal.
The platinum price dipped a bit in morning trading in the Far East on their Friday -- and then crawled a bit higher until selling pressure appeared in it around 11:30 a.m. in Zurich. From that juncture it was stair-stepped lower in price until 4 p.m. in after-hours trading in New York...with the biggest step down coming after the 11 a.m. EDT Zurich close. It didn't do a lot after that. Platinum was closed on Friday afternoon in New York at $952 spot, down another 18 dollars on the day.
The palladium price crept higher until around 2 p.m. China Standard Time on their Friday afternoon. Then, after a down/up dip centered around 9:30 a.m. in Zurich, the serious price pressure began around 1 p.m. CEST. That continued until the 1:30 p.m. COMEX close -- and it didn't do much of anything after that until trading ended at 5:00 p.m. in New York. Palladium was closed lower yet again, this time by 38 bucks the ounce at $2,070 spot.
Based on the kitco.com spot closing prices in silver and gold posted above, the gold/silver ratio worked out to 75.5 to 1 on Friday...compared to 74.8 to 1 on Thursday.
And here's Nick's 1-year Gold/Silver Ratio chart, updated with the last five days of data. Click to enlarge.

The dollar index closed very late on Thursday afternoon in New York at 92.479 -- and opened higher by about 4.5 basis points once trading commenced around 7:45 p.m. EDT on Thursday evening, which was 7:45 a.m. China Standard Time on their Friday morning. It then wandered very quietly sideways until 10 minutes before the London open. It then headed rather sharply lower until it appeared to get saved at 9:30 a.m. BST. The ensuing 'rally' lasted right until the 5:00 p.m. close in New York.
The dollar index finished the Friday trading session in New York at 92.582...up just about 10.5 basis points from Thursday -- and about 6 basis points below its indicated spot close on the DXY chart below.
Here's the DXY chart for Friday, thanks to Bloomberg as always -- and the above-mentioned discrepancy should be noted. Click to enlarge.

Normally I'd have the 5-year U.S. dollar index chart in this spot in my Saturday column, but for whatever reason, I wasn't able to download it or any other yearly chart from the stockcharts.com Internet site, so I'm stuck with the usual 6-month chart. The delta between its close...92.59...and the close on the DXY chart above, was less than 1 basis point above its spot close on the DXY chart above. Click to enlarge as well.

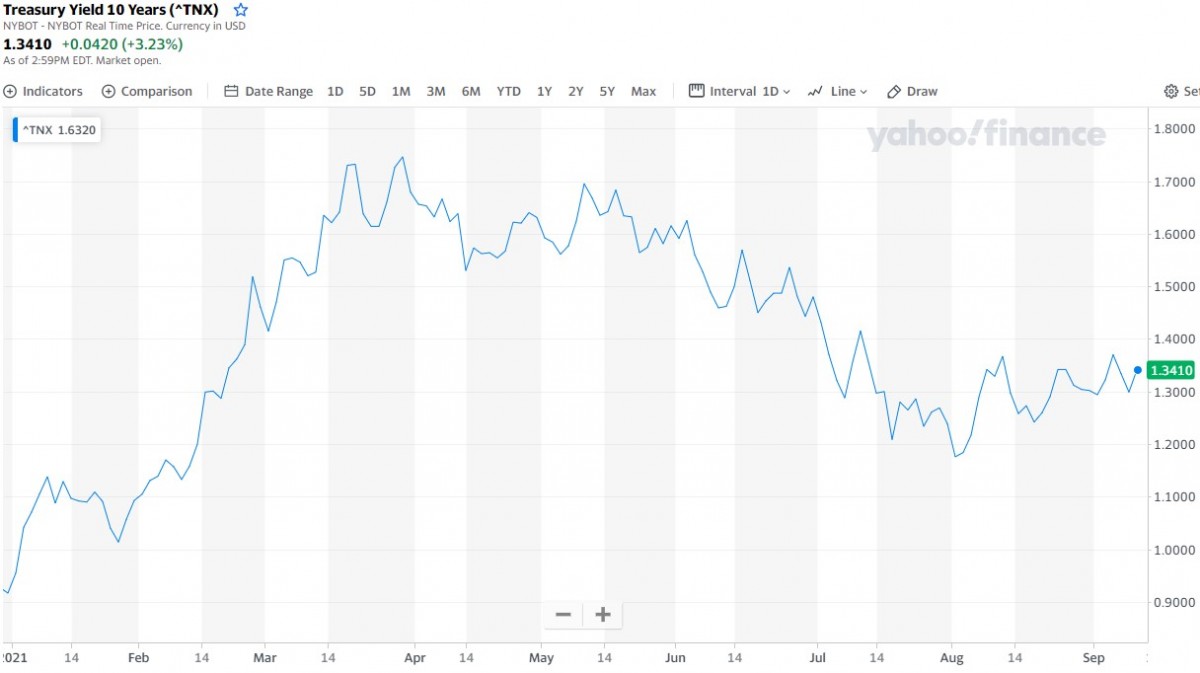
U.S. 10-Year Treasury: 1.3410%...up 0.0420 (+3.23%)...as of 2:59 p.m. EDT.
Here's the one-year 10-year U.S. Treasury chart, courtesy of finance.yahoo.com as always -- and as I keep pointing out, you can see where the Fed began yield curve control in March. But it should also be noted that the trend line changed to a bit of an upward bias starting at the beginning of August. Click to enlarge.
*********
share
share
share
share
share


