Signatures of A Bull Market


There are never ending arguments by many market participants as to what constitutes a bull market, and a bear market. There are many definitions, interpretations, and downright confusions. Many technicians are so preoccupied with trend lines, moving averages, momentum indicators, and often, they neglect what really matters, and that is price itself. One of the first things and quite possibly the best thing I ever learned as a beginner technician years ago was discovering a very simple technique to identify a bull market from a bear market, and all you need is a price chart and a pencil.
Left translation = bear market
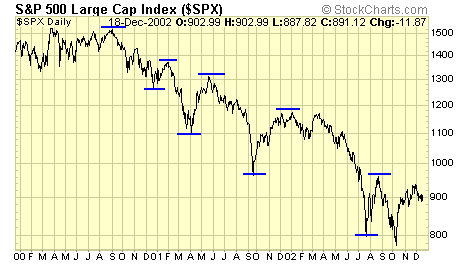
A simple price chart of the SP500 from 2000 to 2002. What do we see? A series of declining tops and bottoms, which constitutes a bear market. But to the trained eye, we see more than just tops and bottoms. We see a "left translation" (LT) which is a signature of a bear market, and you can spot that early in the cycle thus avoiding the pain of suffering drawdowns and losses. Bear markets reflect supplies overwhelming demand and therefore, sellers are in control. Sell offs are interrupted by a sharp and sudden bounce which is often described as a short covering rally, for that is when short sellers take profits thus resulting in a sharp rise, which is short lived as sellers re-enter their positions after banking their profits. These short but sharp rises result in a LT because both the bottom and the top take place on the left side of a cycle.
Right translation = bull market
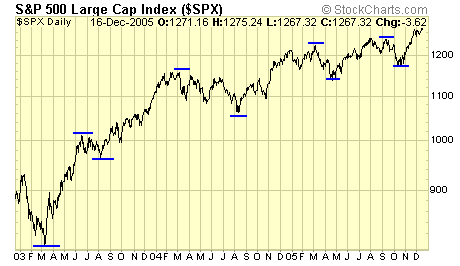
SP500 price chart from 2003 to present. Opposite to a bear market, a bull market is reflected by demand overwhelming supplies, and buyers are in control. Profit taking often creates a sudden down draft, but as buyers step in, a bottom is reached. Sometimes after a substantial rise, a longer correction takes place such as the period during the first half of 2004, but as soon as the bull market returns, the RT resumes again. These patterns of a prolonged rise interrupted by sudden plunges create the "wall of worry" for the investing public, but savvy traders seize these buying opportunities quickly and accumulate positions. These tops and bottoms take place to the right side of a cycle and thus the term "right translation".
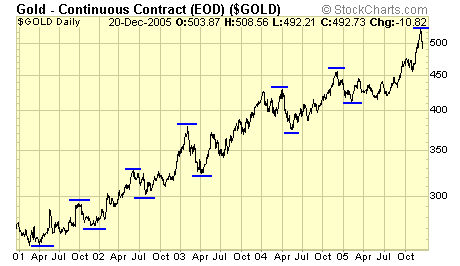
Gold is in a classic bull market. The prolonged rises are periodically interrupted by sudden plunges, and each time that occurs, some "experts" jump on the bear wagon and announce the end of a bull market. I recall clearly when gold was rejected at $300 in Oct 2001 with a sharp plunge, gold bears were quick to forecast $200 gold. The current plunge marks the sixth time of such "right translation" in this gold bull market, and once again, some analysts are quick to conclude that that was it, that was THE top for gold. It's over, finito, kaput, toast. Sure, one of these times they will be correct. But until we see a left translation, each plunge is a good buying opportunity.
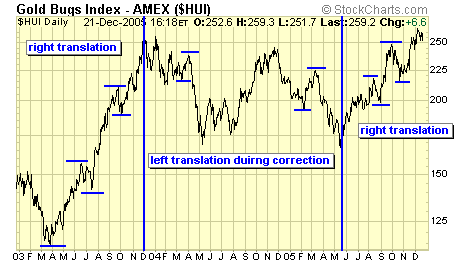
How about gold stocks? Armed with this new found knowledge, can you identify the bull markets? If you invest for the long term, are you still afraid of the sudden plunges? Or do you now see them as buying opportunities?
Summary
Some of our subscribers spend hundreds and even thousands on state of the art software programs, and countless hours in studying all the indicators, with the purpose of trying to figure out the markets. This only makes matter more complex, more confusing, and that is precisely what the "experts" want us to believe in, that the markets are very difficult, and to be successful, we must constantly buy and upgrade hardware, software, books, tapes, and of course, subscribe to many different pay services for their hot tips, stock picks, advices and opinions; and if all that fails, turn your money over to the experts who will make you a millionaire. Folks, I don't pretend that I have the holy grail, nobody does. But trading and investing could be very simple if we let it. All we need is some basic skills in charting, so that we can identify the major trends, and continue to buy the dips, and cash out when the bull is over. I hope my articles have helped to make things simple, and most important of all, provide some inspiration to those who are committed to take care of their own finances. Those sudden plunges in the markets are very intimidating, but if we are aware of the overall structure of the markets, and when these plunges occur during a bull market, we welcome them with open arms, because that is when we can buy stocks at discounts.
Jack Chan at www.traderscorporation.com
23 December 2005

Jack Chan is the editor of Simply Profits, established in 2006. Chan bought his first mining stock, Hoko Exploration, in 1979, and has been active in the markets for the past 37 years. Technical analysis has helped him filter out the noise and focus on the when, and leave the why to the fundamental analysts. His proprietary trading models have enabled him to identify the NASDAQ top in 2000, the new gold bull market in 2001, the stock market top in 2007, and the US dollar bottom in 2011.


