The Silver to Gold Ratio


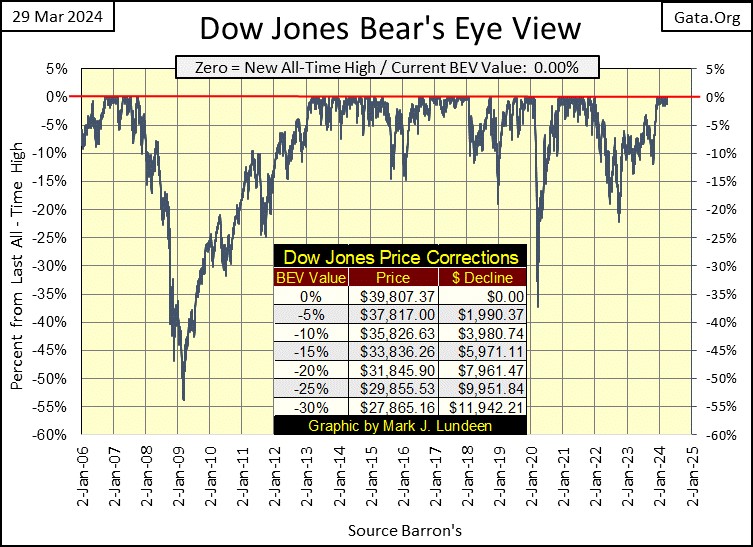
This week, the Dow Jones made its 24th BEV Zero (new all-time high) of its current advance into market history, beginning last December 13th, when the Dow Jones made its 1st BEV Zero of this advance. Since this advance into market history began some three months ago, the farthest the Dow Jones had deflated from any of these 24 BEV Zeros was -1.40%, on March 5th. This can be seen in the BEV chart below, how for the past three months, the Dow Jones’ BEV plot has refused to stray far from its red BEV 0.00% line, as the Dow Jones itself has advanced 3,229 points into market history.
For good or bad, this is a market that wants to go up. How could an advancing stock market be bad? If the money pouring into it is coming from the Federal Reserve, pumping monetary inflation into it – ultimately that will be bad when their bubble pops.
How much more of this, in terms of points and of time can be expected? I’m not the guy to answer that question, except to say possibly longer than you and I could believe possible, and then maybe it could end next week. I will say this with some certainty; as long as daily volatility for the Dow Jones remains low, this advance should continue.
Another way of saying that is, as soon as Dow Jones 2% Days, days of extreme market volatility, days the Dow Jones moves up or down in excess of 2% from its previous trading day’s close become frequent market events, I’m going to then assume this advance is over.
The Dow Jones’ BEV plot above should then decline below scoring position (BEVs of -0.01% to -4.99% - less than 5% from a new all-time high). Soon after that, we should see the Dow Jones break below its BEV -5% line, and then sink into deeper BEV levels in the chart above. Or so that is how I believe this advance will terminate.
Being Easter Week, the financial markets had only four trading days, but the week ended strongly on Wednesday and Thursday, as seen by the many BEV Zeros in my table of major-market indexes’ BEV values below. The NASDAQ Bank Index (#20) is advancing, but that doesn’t mean the banks have become more viable since last May, when their BEV values fell below their BEV -50% level; losing half of their market valuation since their last all-time high of late 2021.
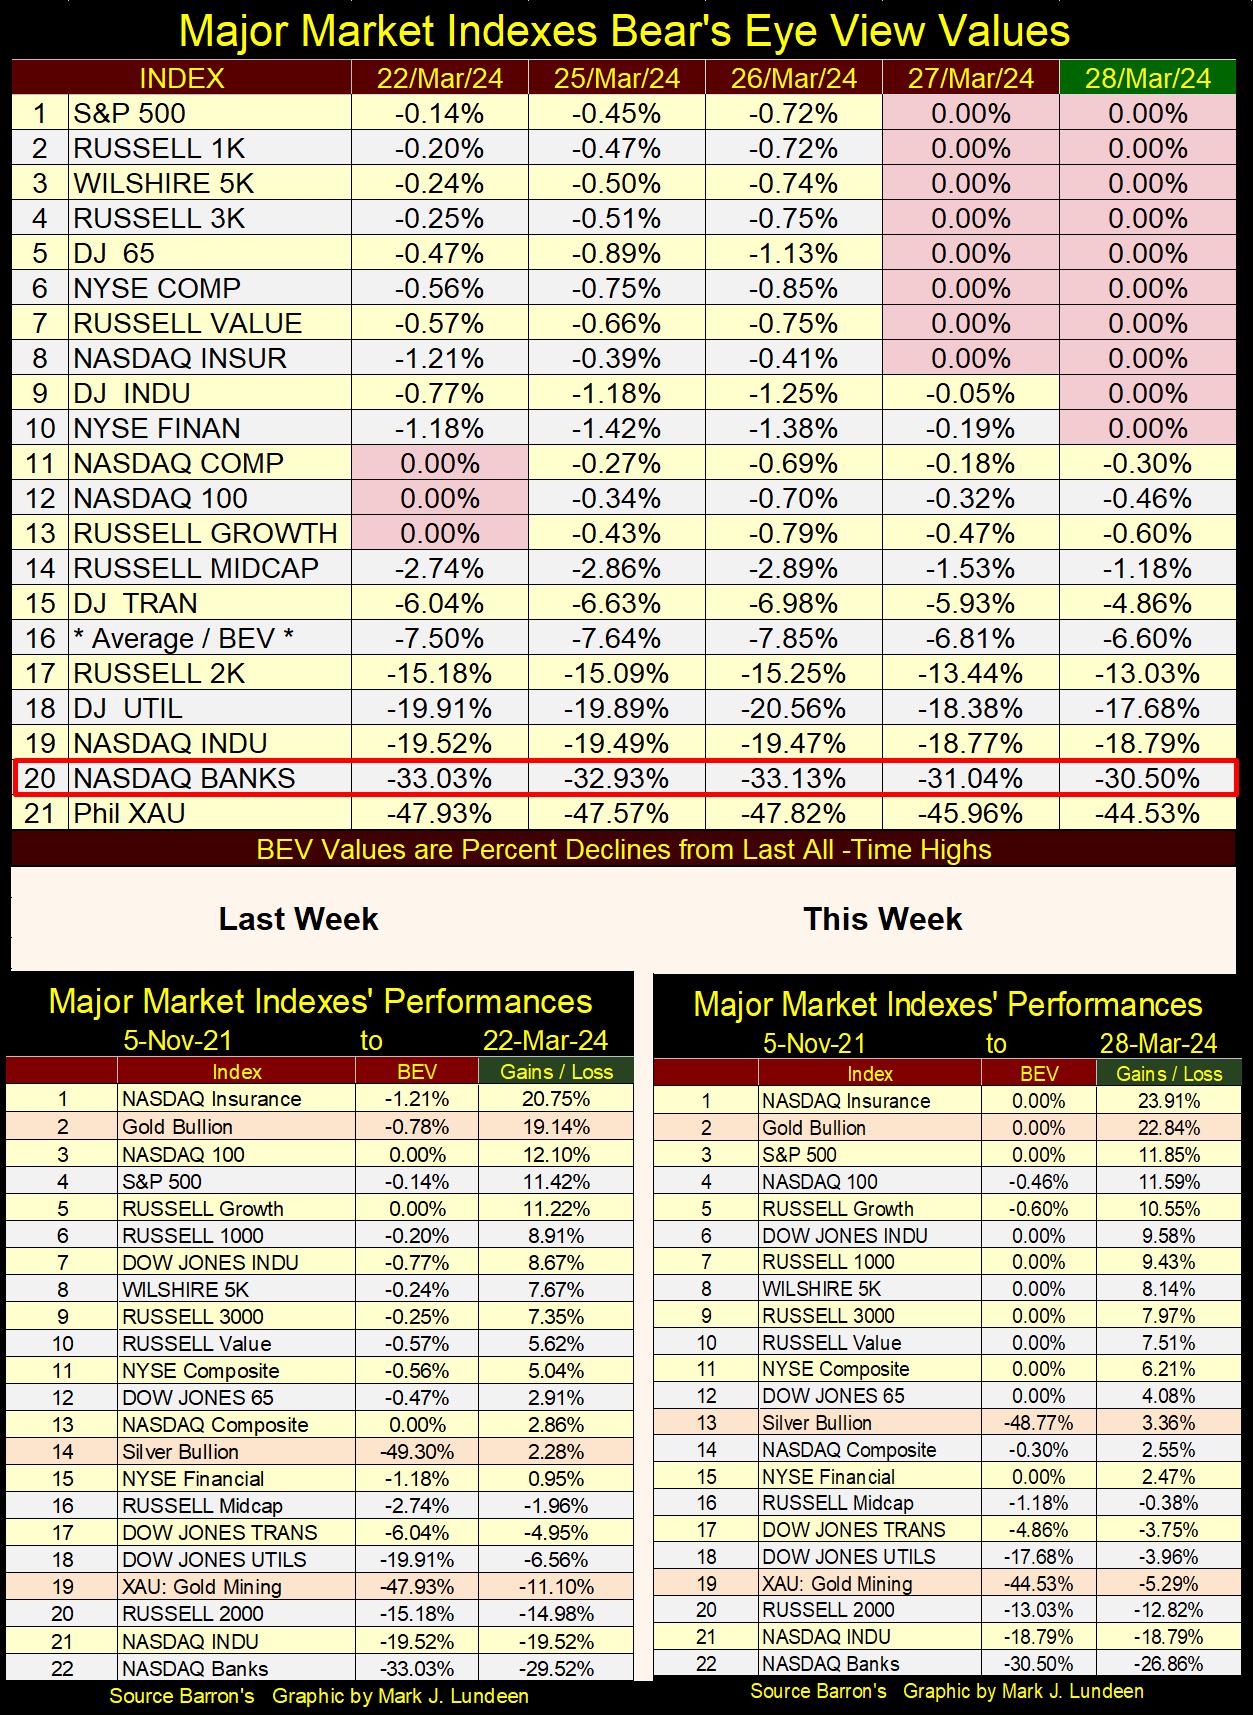
Gold in the performance tables above remains in the #2 spot, and has been there for a while, closing the week 22.84% higher than it did on 05 November 2021. At this week’s close, gold also closed at a new all-time high for the day, week, month and quarter. For those who stare at charts for a living, you can be sure they’ve noticed this.
Silver (#13) was up a little more than 1% for the week, but is advancing like an old man walking up a hill. That is something that I can personally attest to, being something not very impressive. But I like the gold and silver miners in the XAU (#19), they were up 5.81% from last week. If money is beginning to flow into the gold and silver miners, it won’t take much to move the XAU much higher in these performance tables, something I believe is going to happen this year.
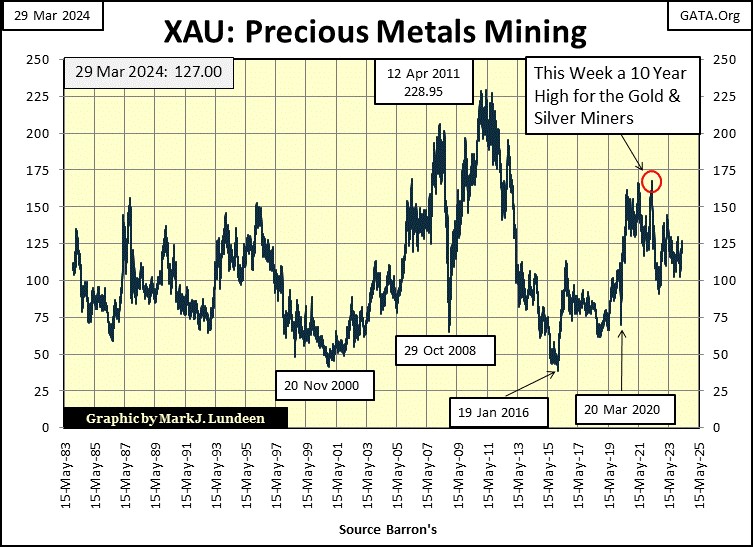
The XAU’s last all-time high was in April 2011; thirteen years ago. Following that, the XAU descended into massive 83.40% bear-market valuation collapse in January 2016, making the gold and silver miners to this day, about as popular with managed money as a loathsome disease. I’m not kidding, looking at the Barron’s Gold Mining Index’s BEV chart below, a chart that goes back to 1920, the April 2011 to January 2016 bear market (Box C) was the deepest bear market decline the BGMI had seen in the past 100 years.
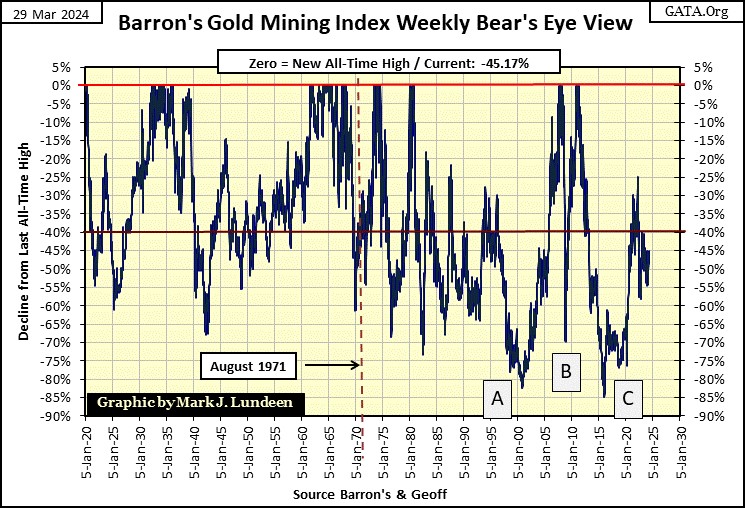
How can this be good? It means the gold and silver mining industry is priced at rock bottom valuations, which is when savvy investors want to buy.
Since its very hard bottom in January 2016, the XAU, and other gold and silver mining indexes have recovered some. Two years ago, the XAU almost broke above 175, just before it did break below 100. Today it closed above 125, making 150 the next level for the bulls to take these miners to. In a good market, this could happen by June. It’s time the bulls in the gold and silver mining sector, spread their tiny wings – and once again begin to fly.
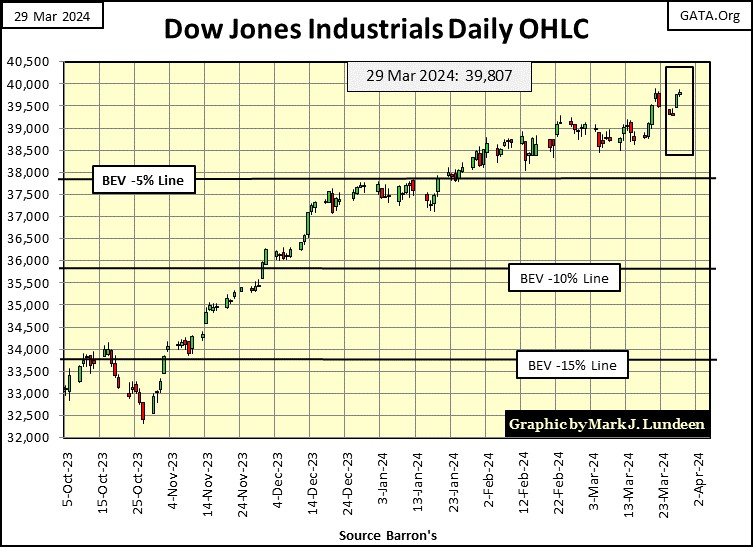
The Dow Jones in its daily bar chart below is looking good. Dow Jones closing above 40,000 by the close of next week? At the close of this week, it was only 193 points away from doing exactly that. It would be a very easy jump for the Dow Jones to close above 40,000 next week.
Let me think about this;
- The Dow Jones has been advancing in the chart below since October 2023,
- No big Dow Jones 2% days, days of extreme market volatility,
- No NYSE 70% A-D days, days of extreme market breadth.
Considering the above, I expect we’ll soon see the Dow Jones closing over 40,000 very soon, if not by next week.
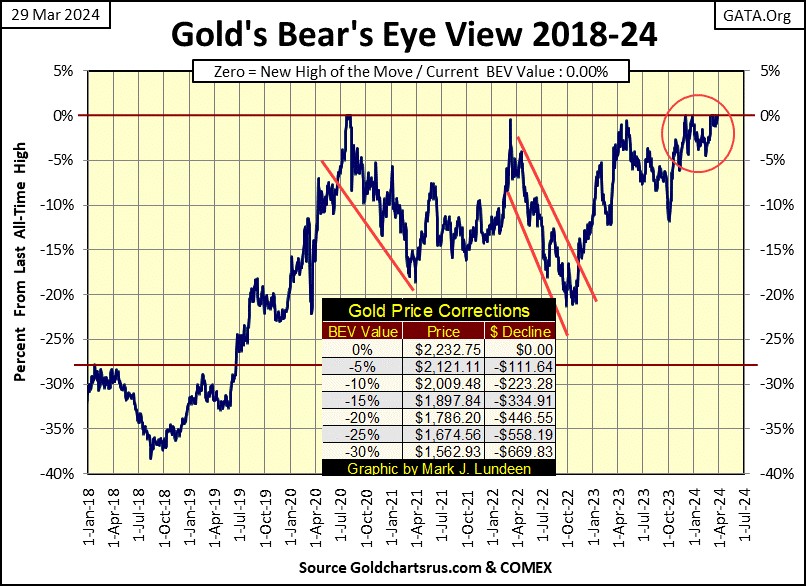
Let’s look at gold’s BEV chart. At Thursday and Friday’s close, gold closed at a new all-time high, the 10th and 11th of the current advance. Gold has been in scoring position since mid-November, which motivated me to say gold was advancing. But for the first three months of this advance, gold had only two new all-time highs to show for it. Then came March, during which gold made nine new BEV Zeros in its BEV chart below. I’m hoping April will be as generous to the bulls as March was.
Moving on to my chart of indexed values for gold and silver below, against my better judgement, last week I predicted gold would break above its 55.0 line ($2400) by the end of August. Last Friday, gold was at 49.78 ($2165.5). In the four trading days since, gold advanced $67.25, closing the week at 51.33 ($2,232.75), only $167.25 from $2,400. So far, so good.
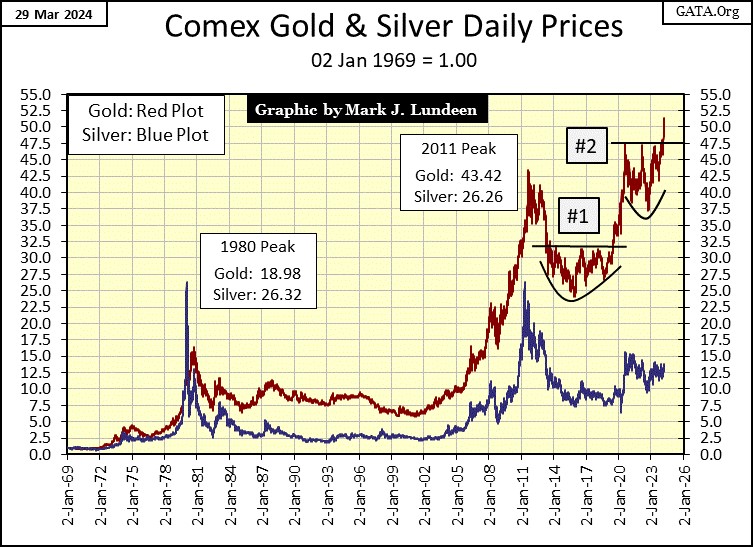
As far as silver goes, I’m not going to get excited until it breaks above its 17.5 level ($32.50). I’m not going to set a time for that to happen, but it would be nice seeing silver close above its 15 level ($27.80) sometime in the next few weeks. Will it? Like I said, it would be nice if it did. Should gold continue advancing as it has all this month, it could light a fire beneath the silver market.
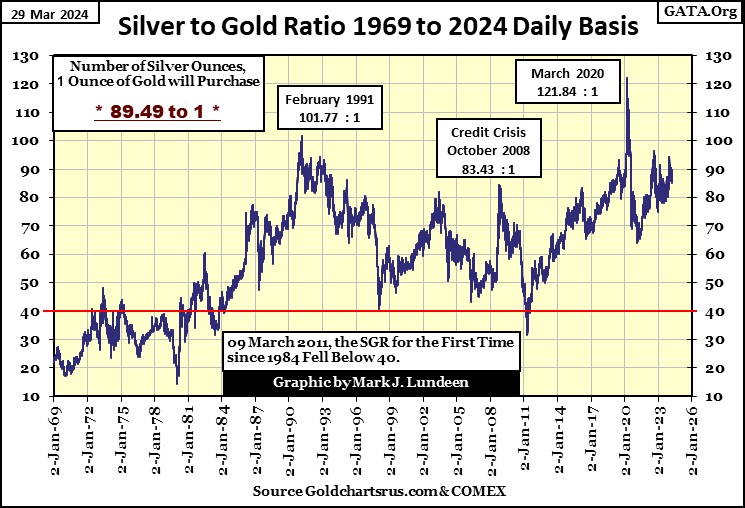
Let’s look at the Silver to Gold Ratio (SGR), also known as the Gold to Silver Ratio (GSR) for reasons I don’t understand, as either way, this ratio is always looking at how many ounces of silver one ounce of gold can purchase. This week closed with the SGR at 89.49 ounces of silver / 1 ounce of gold. So what?
Well, during the gold standard, a $20 gold double-eagle could be exchanged for twenty silver dollars at a bank, and twenty silver dollars could purchase anything a single $20 gold double-eagle could. Why was this ratio of 20 to 1 set in US coinage before 1913? It seems in Earth’s crust, that is the approximate ratio of silver to gold to be found there. Though that will vary from place to place, and from one precious metal ore body to another. So, why since 1971 has the SGR in the chart below spent so little time at around its 20 level?
I would argue the US Government got involved managing the price of silver, and have been for a long time. Here is a quote from then President Johnson on removing silver from US coinage in 1965;
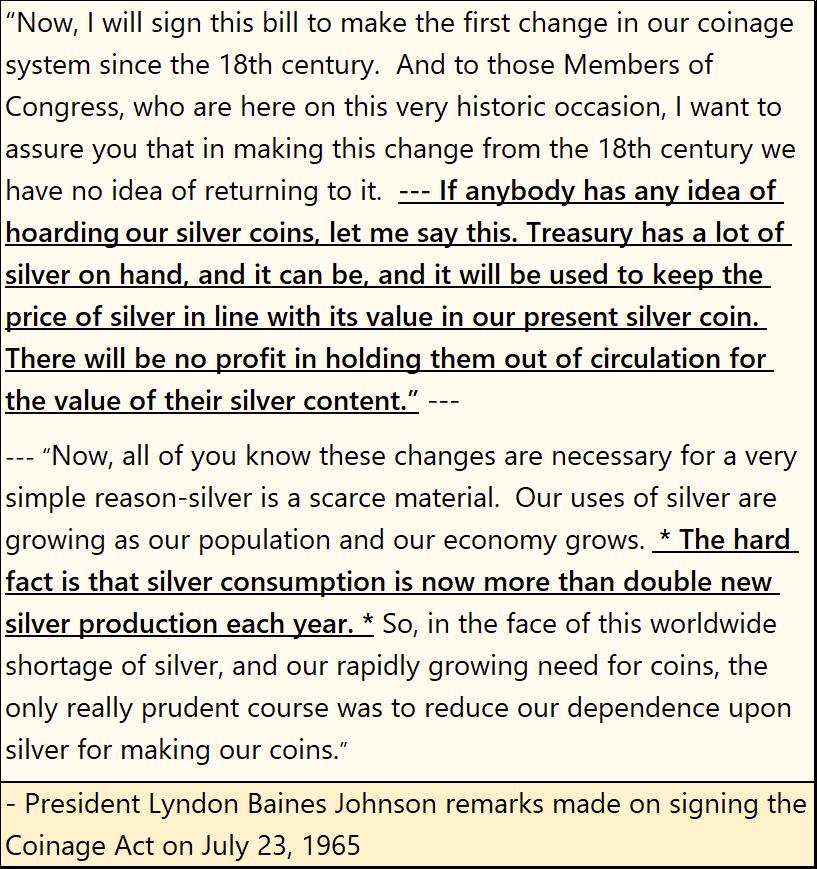
President Johnson talked about the supply of silver becoming critical as the reason for eliminating silver from US coinage. And he threatened to use the billions of ounces of silver then in the government’s possession, to keep the price of silver down, a silver reserve that was totally depleted, down to zero ounces in 2011.
But he didn’t mention what was probably the biggest reason for demonetizing silver in 1965. In 1934 the Federal Government removed gold from its “monetary system.” Thirty-one years later they also removed silver from US coinage, and for the same reason: precious metal coinage inhibited paper-dollar inflation, paper money “injected” into circulation far above what a precious metals monetary system would allow.
If the US Treasury still minted $20 gold coins, and silver dollars for economic use, coins to be carried and spent as we do paper money today, we would not today be talking about the Dow Jones breaking above 40,000 in the weeks to come.
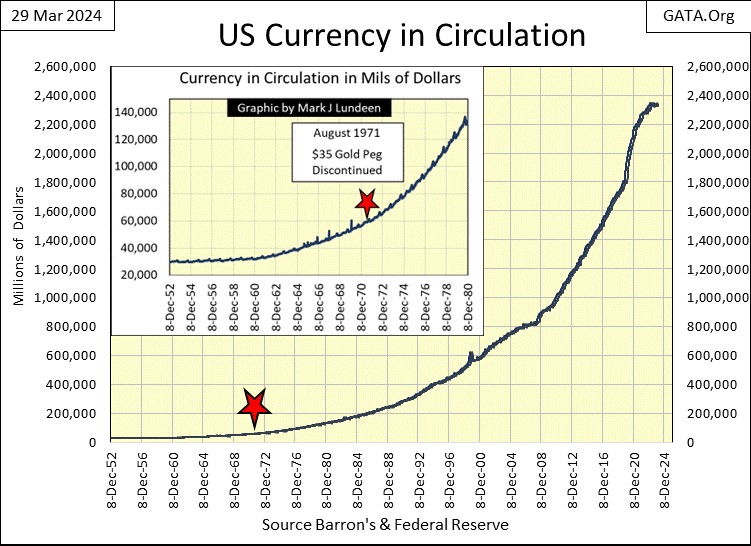
In the chart below plotting US Currency in Circulation (CinC), when President Johnson made this address to Congress on demonetizing silver, US CinC was around 50 billion dollars. At this week’s close, CinC was at 2,342 billion dollars. Had gold and silver remained in the monetary system, this massive inflation in paper dollars (digital dollars too) would not have been possible, so they got rid of gold and silver coins.
Note in the SGR chart above, in the late 1960s to the first years of the 1970s, the SGR never strayed far from 20. But since August 1971, when US “policy makers” took the dollar off the Bretton Woods $35 gold peg, the SGR has strayed far from 20, and most likely because of official sector price manipulation in the silver market, to do what President Johnson promised; to keep the price of silver low, and speculation in the silver market unprofitable.
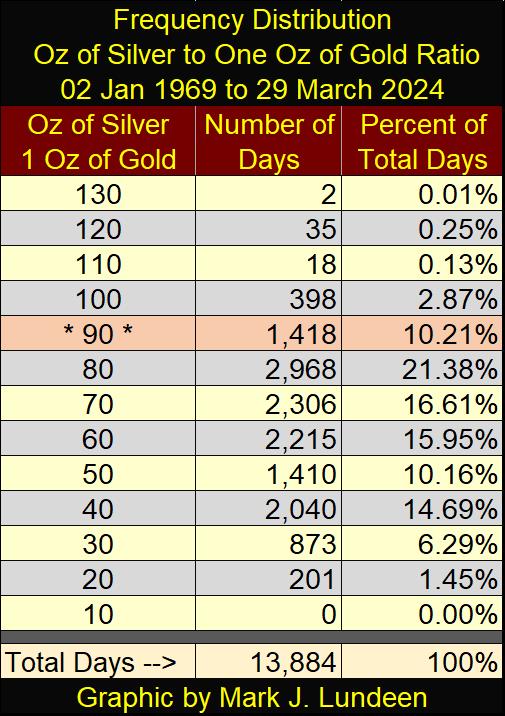
Below is a frequency distribution table for the SGR. Since January 1969, the SGR has been around its 20 level for only 201 trading days, of the total 13,884 plotted, or only 1.45% of the trading days for the past fifty-five years. There is something very wrong with that, or so it seems to me.
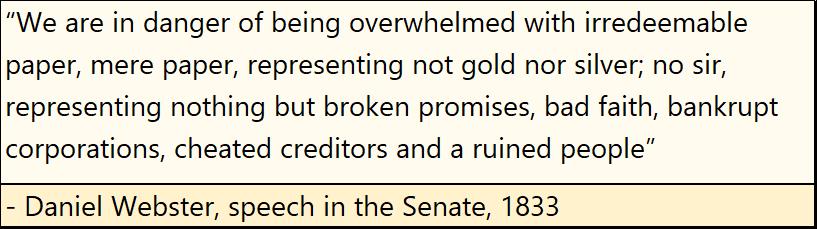
Few people care about that today, but someday they will. Below are comments from Daniel Webster from the early 19th century in the US Senate. Bankrupt corporations? A ruined people? That is the history of paper money inflation, and early in the 19th century, Senator Webster and most people knew that too. That “educated people” don’t today, says much about our “system of education.”
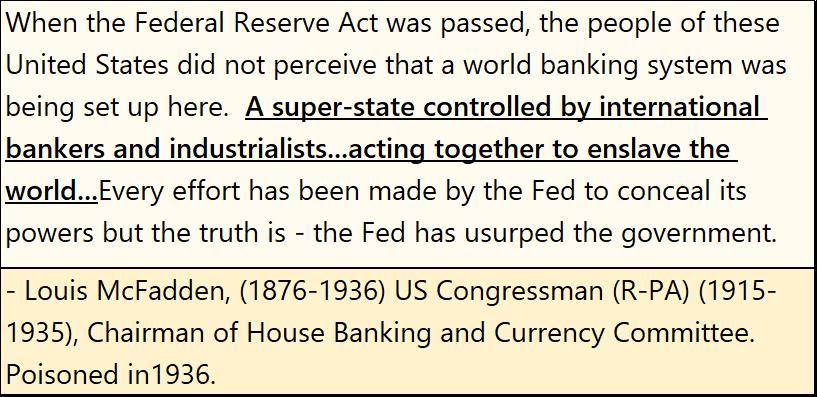
This has been going on for a long time. Here is a quote from by Representative Louis Mc Fadden (R-Pa), chairman of House Banking and Currency Committee. He died from poison in 1936.
That is something to think about as the stock market rises into market history, after over 100 years of monetary inflation via the Federal Reserve System. When this bubble pops, and Daniel Webster’s bankrupt corporations and ruined population become fully manifest, will the NYSE still function as it had before?
Gold in its step sum table below is looking good. It was overbought in early March, as seen by its 15-count rising to a +9. Markets don’t like being overbought, so some down days followed, and gold’s 15-count declined to a neutral +3 at the close of this week. No matter, gold was still making new all-time highs (BEV Zeros) following those down days.
This is a strong market, something gold hasn’t seen for quite a while. Can gold keep it up? Like me, you are going to have to wait to see if it does, but I’m going to remain positive, and believe it will.
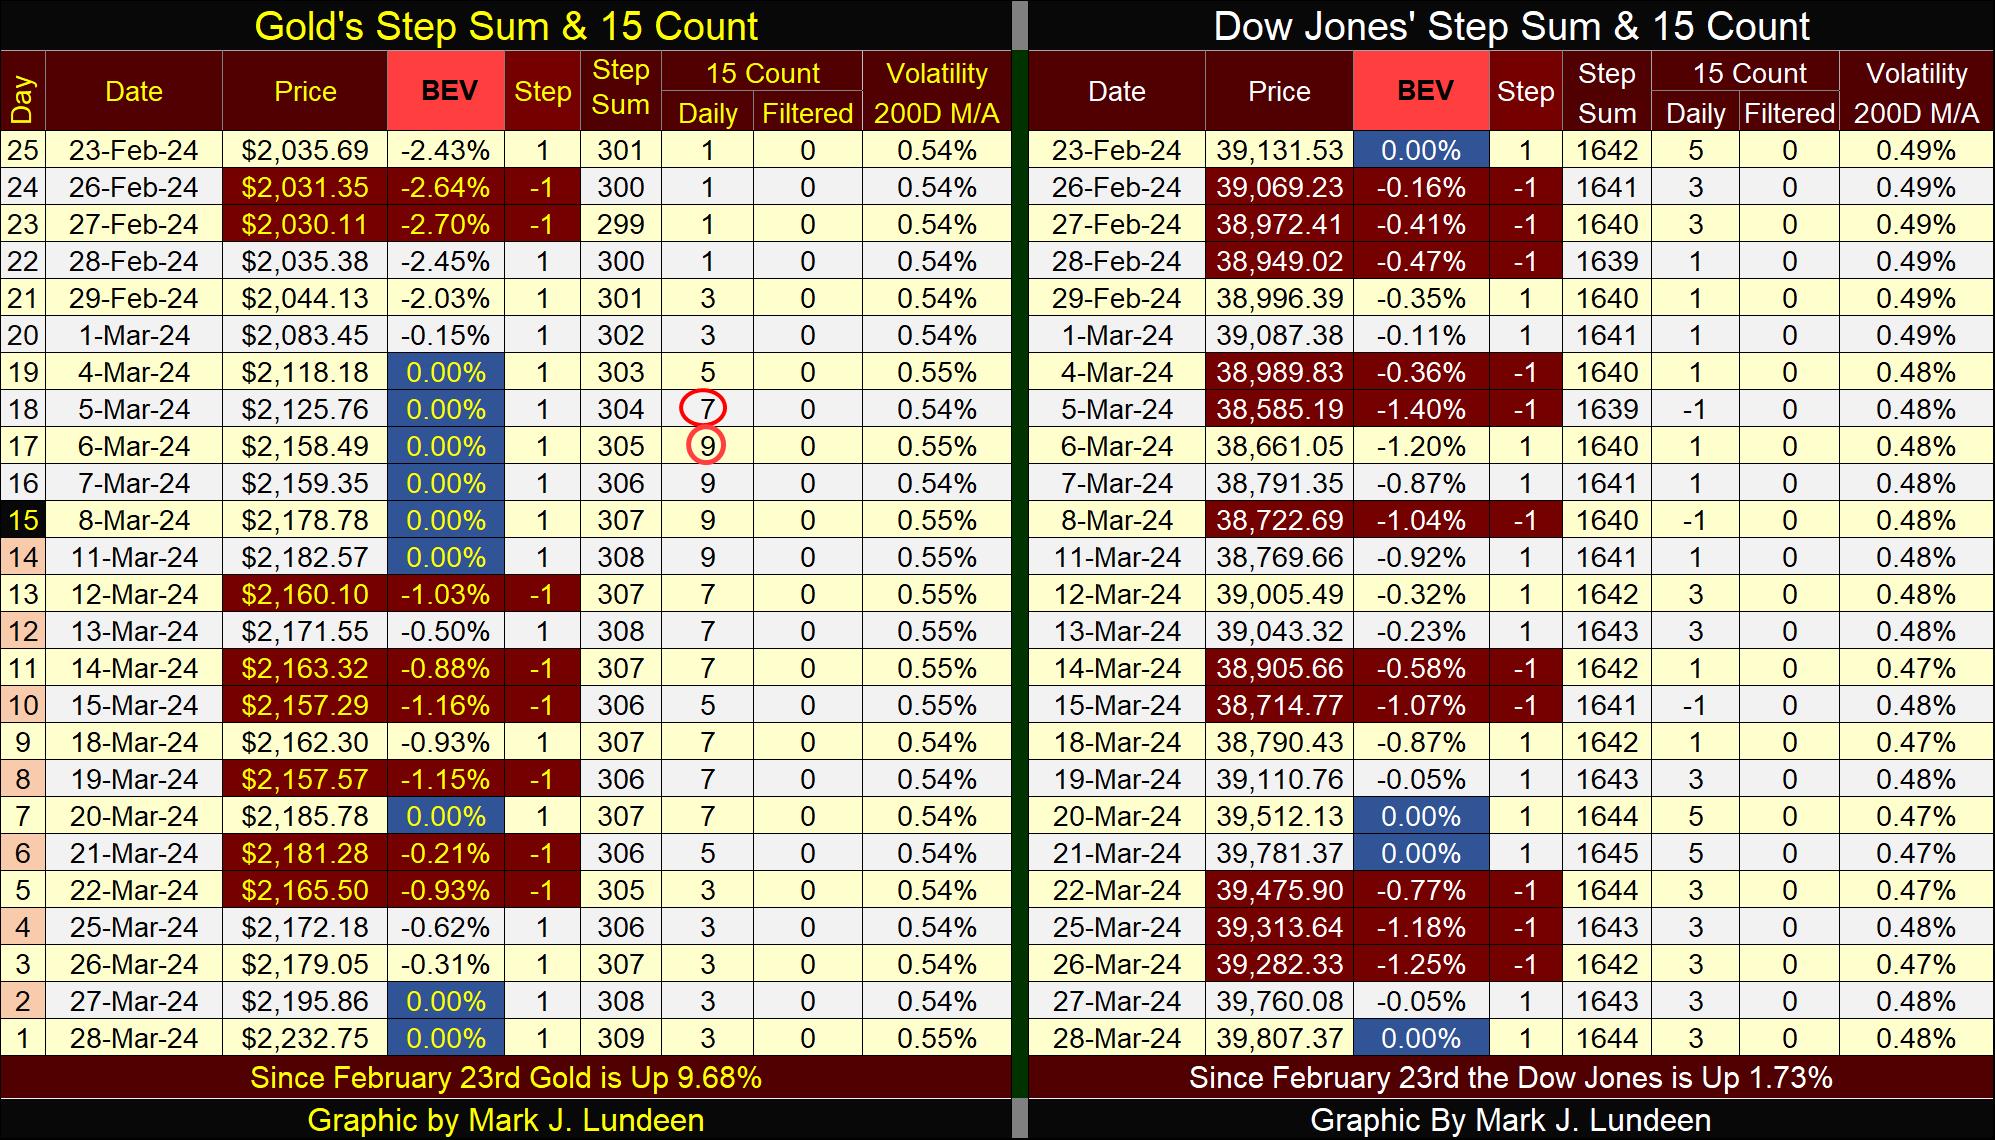
On the Dow Jones side of the table, it too remains strong, though BEV Zeros (the blue boxes) aren’t coming as fast and furiously as before. But that could change quickly in the weeks to come.
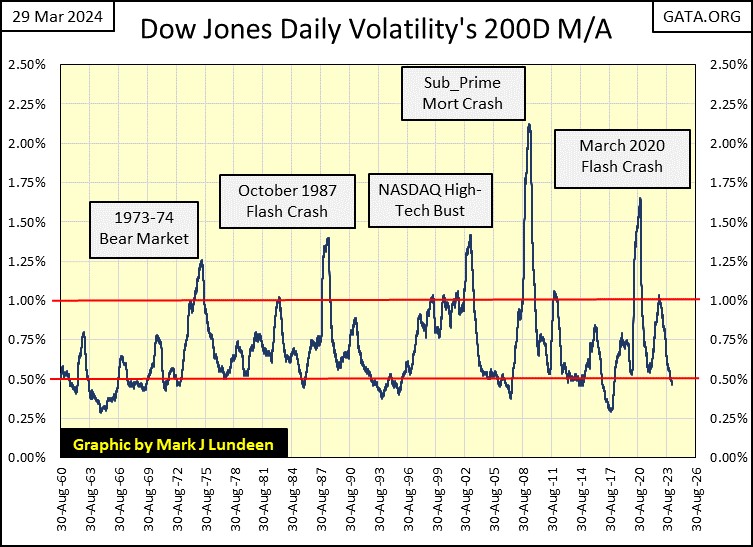
I see the Dow Jones daily volatility’s 200D M/A is having problems keeping at 0.47%. Will this advance see a 0.46%, and lower in daily volatility? Maybe, but I don’t think it matters, as seen in the Dow Jones daily volatility chart below; 0.48% indicates the stock market is approaching an ultimate market top. What follows that won’t be good for the bulls when this plot reverses, and trends towards, and then rises above 1.00%.
Given the choice between the gold and silver mining sector, gold and silver bullion, or the broad stock market, from what I can see in these two markets; unloved, and under owned gold miners and precious metal bullion is the place to be in 2024. I’m assuming we’re all adults here, so you make up your own mind.
I tried to come up with something appropriate for this year’s Easter commentary, but I couldn’t think of anything better than what I wrote two years ago. So, for the first time in my commentary, I’m going to cut and paste something from years ago, and include it in this week’s commentary.
* From My 15 April 2022 Market Commentary *
This being the Passover / Easter weekend, I thought I’d spend some time commentating on this holy occasion, as well as on some secular history the skeptically minded will find interesting. Go ahead, read it to the end. You’ll like it whoever ye be!
People, as well as life are complicated. France’s King Louis XIV was Europe’s biggest supporter of the Roman-Catholic Church in the 17th century. Untold thousands of Protestants, and Jews were burned at the stake is testimony of his loyalty to the Pope. But there is reason believing King Louis was at best an agnostic.
He once asked Blaise Pascal:
“What proof do you have there is a God?”
To which Pascal replied:
“The Jews your Majesty, the Jews!”
Pascal’s reasoning was simple enough; since the Children of Israel departed Egypt, innumerable kings and nations attempted to “kill them all.” Yet, after 3500 years, this weekend the Jews are still here, celebrating Passover as God ordered them to do at Mount Sinai.
Today, and every day, the Iranian mullahs shout “death to Israel.” They’ll be no more successful than the Edomites or Nazis were, for the same reason Pascal pointed out to King Louis; God’s promise to protect the Jewish people, if not individual Jews, to the end of time.
Where are the Babylonians, the Assyrians today? Rome was once the greatest city and military power on Earth. In 70 AD they destroyed Jerusalem, and expelled the Jews from the Holy Lands. By the time Christopher Columbus discovered America, the eternal city, Rome, was in ruins, uncared for rubble where Jupiter hadn’t been worshiped for a thousand years. Instead, all of the old Roman Empire now worshipped Jesus Christ, a humble Jew from Galilee.
The greatest gift the Jews have passed along to the gentiles is their Bible, a truly unique book. How so? Take for example Plutarch’s Lives, a book of notable individuals of antiquity, written by a Greek Historian who lived during the time of Caesar Augustus. Include too Homer’s Iliad and Odyssey into this standard; literary masterpieces where heroes are heroes who perform amazing deeds, and the villains, who excel only at being bums, worthy of eradication. This is how kings and their nobles, the patrons of historical chronicles, insist their scribes document their lives, and the lives of the villains who opposed them.
The one exception to this genre of history I’m aware of is Plutarch’s life of Mark Antony. The Antony who supported Julius Caesar, was a hero who errored little. The Antony who opposed Augustus, was a villain who errored much. It’s easy seeing who Plutarch wanted to please – the winner of this war; his patron the Roman Emperor Augustus.
When Antony was coming to his end, after all he attempted with Cleopatra fell apart, and he saw his once glorious life in ruins, he visited the grave of Timon of Athens, who had a then famous epitaph.
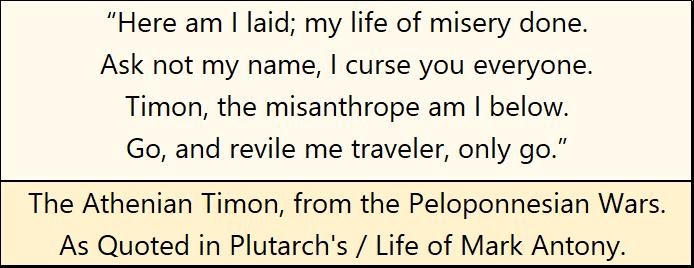
Whether Timon’s epitaph cheered Antony up or not, Plutarch doesn’t say. I suspect it didn’t. Maybe his epitaph is more uplifting in the original Greek.
The Jewish Bible is completely different, as it tells all; both the good and the bad of the people who lived in ancient Israel. The pagan histories primarily focus on glorious deeds of kings and their mighty men of war. The Bible does too, noting when Israel’s Kings were assisted or thwarted by God. But uniquely, a significant proportion of the Bible’s commentary is on the little people, who very often are as corrupt as their leaders, and their society suffered for it.
Did you know Moses was a murderer? He murdered an Egyptian, and was forced to flee Egypt for his crime.
King David was a murderer too. David took the wife of Uriah the Hittite into his bed, one of his mighty men of war when Uriah was fighting the Ammonites for David. Bathsheba became pregnant with David’s child. David ordered Uriah to visit his wife, intending to hide his crime with a night of passion between the husband and his wife.
That didn’t work. Uriah refused to sleep anywhere but outside his house, alone under the stars, until he defeated the Ammonites for David. So loyal was Uriah to David, David had no choice but to send Uriah back to the front, and ordered his commanding general to make sure Uriah died in battle.
Dear reader; this is how political leaders and their minions were; as they are now. They betray and abuse us, then tell us, “their citizens,” it was all for our own good.
The Bible is relentless in telling the truth of the people covered in its pages. The good and bad of political leaders, priests, and the mass of humanity they hold power over. These people from long ago are no different than those we have today, so there is much to learn from reading the Bible.
There are people who chuckle when believers say the Bible was inspired by God. That once was me. But no historical chronicle written by humans reads like the Bible, like the 3000-year-old warning from Ecclesiastics below.
America, Canada, Mexico, and Christendom’s birthplace; Europe are decaying for want of God’s moral guidance from the Bible. Our elite rather have chosen “science” for their moral compass. A 21st Century “science” that is confused about how many genders humanity has. This is so sad. Life on Earth doesn’t have to be this way. But the choices we make, or refuse to make all have consequences.
I remember a line from an old Frank Zappa song:
Do you love it? Do you hate it? Here it is the way you made it.
As this weekend is Easter, I wanted to praise Jesus for all he did for us on the cross. He was the willing sacrificial lamb who took away the sins of the world. That’s not saying people don’t sin anymore – oh they do. But Christ’s death on the cross Paid in Full the penalty of our sins – eternal death. His resurrection from the grave is his promise to those, who believe and love him, will share eternity with him. That sounds good to me.
Here's a good song for Easter; Ain't No Grave (LIVE) - Bethel Music & Molly Skaggs.
https://www.youtube.com/watch?v=nGncW_ueyHA
That wraps it up, see you next week.
Mark J. Lundeen
********


