Some Key Levels In Gold


The bearish target at 1059.70 (see chart) seems clear and compelling to me — so much so as to beg the question of why the futures have been thrashing around for the last two weeks just above it.
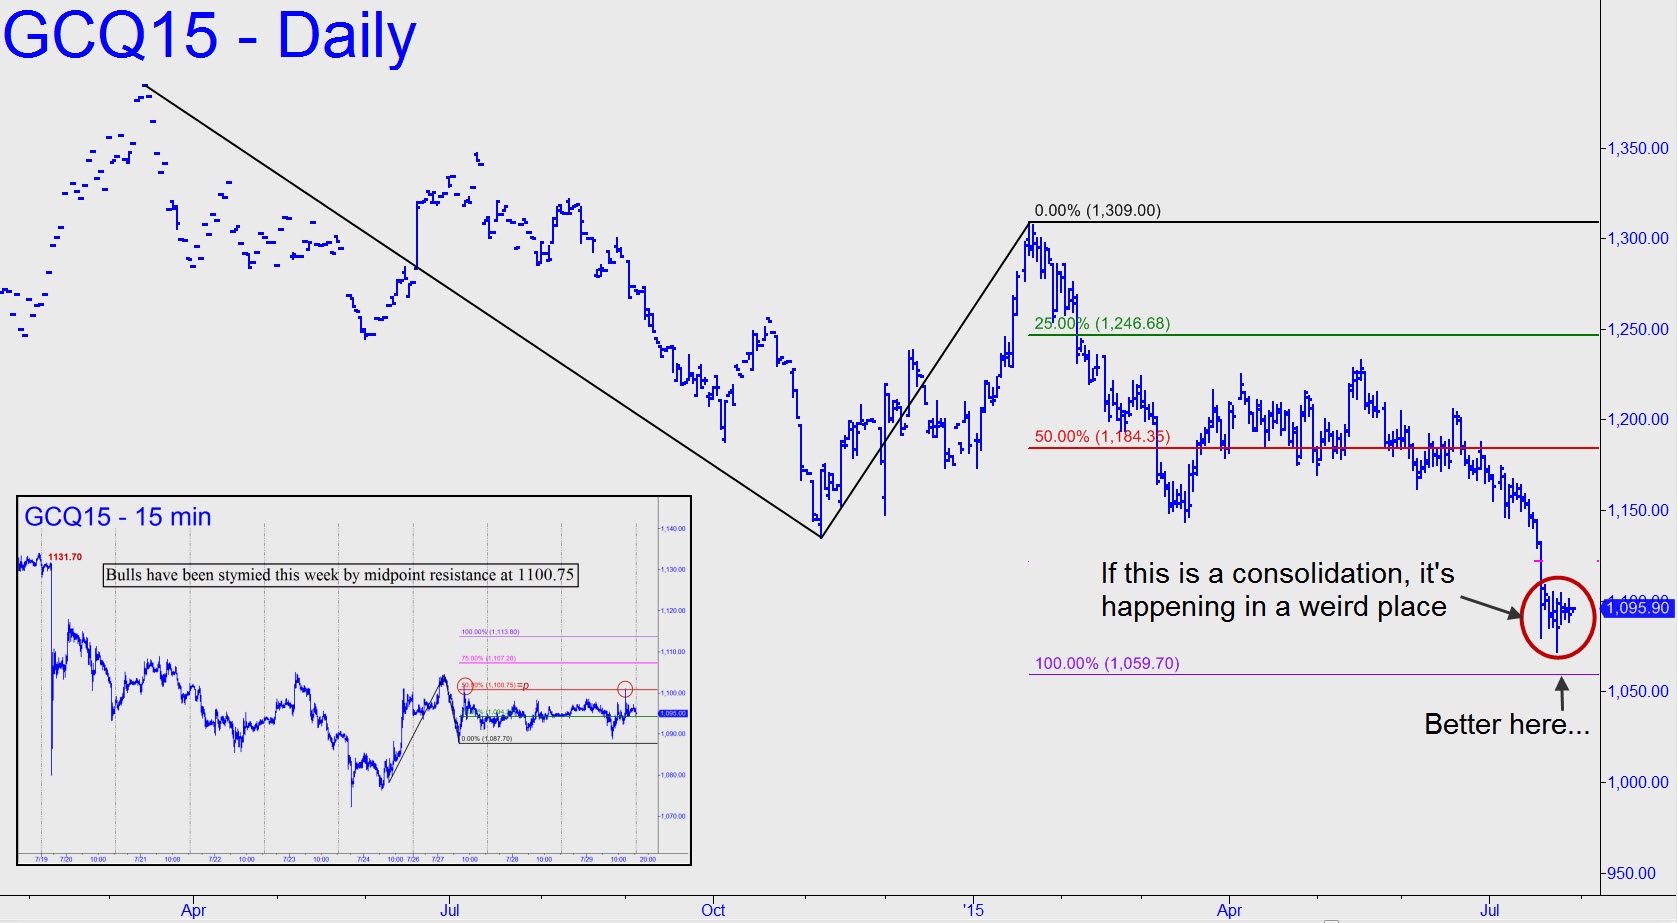
Is this a bullish consolidation? A bearish distribution? Regardless, it is happening in an odd place relative to some clear Hidden Pivot support and resistance levels. My hunch is that the chop is distribution, and that we will see August Gold fall to at least 1059.70 before bulls can mount a decent rally. However, I am not married to this scenario and will be watching the lesser charts closely for the subtlest sign of an upward lurch out-of-nowhere. So far, any such effusion has been stymied precisely by the 1100.75 midpoint resistance shown in the small inset chart. However, were that resistance to be brushed aside on Thursday, I’d infer more upside over the very near term to at least 1113.80, the D target of the pattern shown. A move exceeding the ‘external’ peak at 1131.70 in the upper-left quadrant of the chart would be even more impressive, hinting of strength sufficient to carry into next week and beyond.
********
Click here for a free two-week trial subscription to Rick’s Picks that will give you access not only to daily trading ‘touts’, bulletins, updates and impromptu trading sessions, as well as to a 24/7 chat room that draws veteran traders from around the world.


