S&P Squirms; Gold Firms


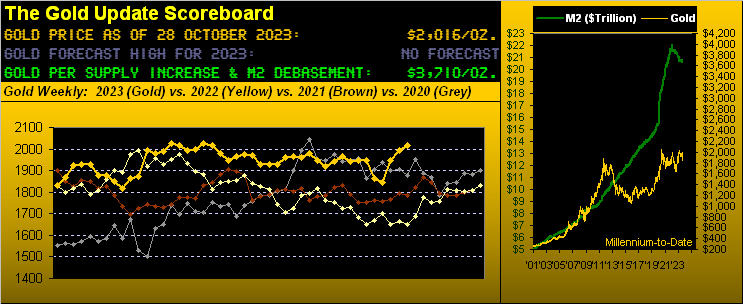
Welcome to this week’s missive featuring your favourite end-of-month graphics as we put the wraps on October, (albeit with two trading days in the balance followed by Wednesday’s EuroSide holiday). And sadly as the Mid-East mayhem continues, the safe-haven bid has further fed into the price of Gold toward settling yesterday (Friday) at 2016, the highest weekly close since 05 May.
However, per this piece’s title, as is our occasional wont we start with stocks, specifically as regards the S&P 500’s state of squirm. To wit from the “‘Tis Not About Us Dept.” you may recall that herein penned back on 22 July:
►“As we tweeted (@deMeadvillePro) last Thursday [20 July]: S&P only -0.7% today (Thu) but the MoneyFlow drain was the most for any one day since 13 Sep ’22. Suggests near-term top is in place.”
‘Course you regular website readers know the MoneyFlow is a directionally-leading characteristic of the S&P 500 which had settled this past 20 July at 4535. From whence, ’tis all gone rather wrong as depicted by the following daily graphic of the S&P’s closings year-to-date:
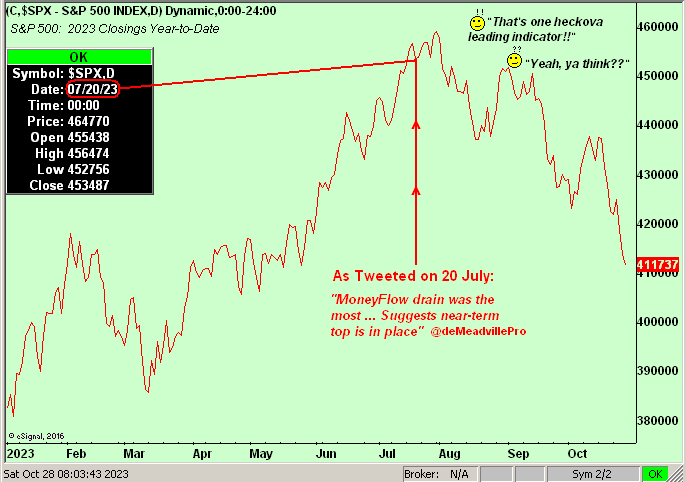
Indeed since that tweet, the S&P 500 has declined -9.2% (from 4535 to now 4117). However for the moment, the S&P has become “textbook oversold” such that it perhaps gets a bounce before the next trounce. That’s technically.
But fundamentally our “live” price/earnings ratio of the S&P 500 remains high in the sky at 34.6x. And to be sure, Q3 earnings season isn’t helping the situation, regardless of the FinMedia’s fawning. For example: last evening, once-revered Barron’s ran with “Why a Solid Earnings Season Isn’t Good Enough for the Stock Market”. But because we actually do the math, of 596 companies (including 226 S&P constituents) having thus far reported for Q3, just 51% have bettered Q3 of a year ago. That’s considered “Solid”?
“But 67% beat estimates, mmb…”
You know Squire had that comment ready to go. But were we ever to risk dipping a toe into the equities market, we’d desire our shareholdings to be in companies that grow the bottom line rather than shrink it. Yet such has been the illogical lean to the latter that exists in today’s Investing Age of Stoopid. Nuff said. To Gold we go.
And what better segue than to bring up the BEGOS Markets standings year-to-date, Gold having moved from fourth position just at September’s end to now first, +10.2% to this point in 2023. (Note therein the Dollar Index being +3.0% which by conventional wisdom doesn’t happen when Gold rises … except for the fact that “Gold plays no currency favourites” as you regular readers well know). ‘Course the Bond has been creamed, price -12.1% in 2023 whilst yield has risen from 3.975% at year-end 2022 to now 5.023%. As for Sister Silver lacking pace, she’s not getting the geo-political gain garnered by Gold, especially with Cousin Copper on the skids. Here’s the whole gang:

As for Gold’s weekly bars from a year ago-to-date, we’ve locked in the rightmost second blue dot of the new parabolic Long trend, the prior Long trend having failed miserably only to have then been saved by an equally poor trend (the three red dots) for the Shorts. Although we’re rah-rahing away there, should there hopefully be some resolution to the Mid-East mayhem, Gold typically would then drop like a stone. For as we opined a week ago, Gold shan’t become moon-bound until the current All-Time High (2089) is eclipsed; thus it remains for now range-bound, all as herein detailed a week ago. Either way, from Gold’s recent low just on 06 October at 1824, price has since risen to as high (yesterday) as 2020, or +10.7% in 16 trading days. Here are the weeklies:
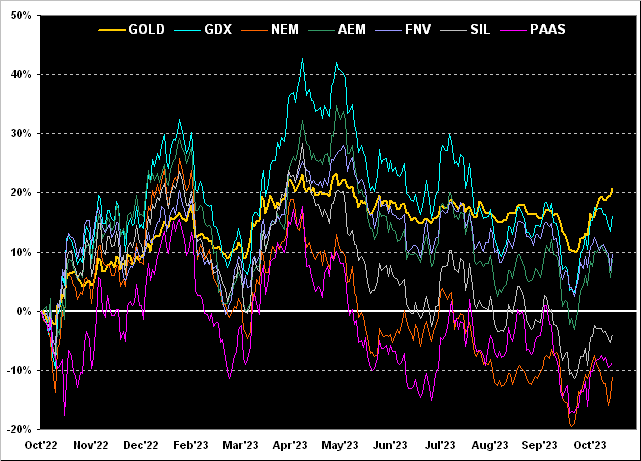
Now let’s stay in the year ago-to-date mode in turning to Gold and its percentage track along with those of top-tier precious metals companies, wherein not all have positively fared. From the bottom up we’ve Newmont (NEM) -11%, Pan American Silver (PAAS) -9%, the Global X Silver Miners exchange-traded fund (SIL) -4%, Agnico Eagle Mines (AEM) +9%, Franco-Nevada (FNV) +10%, the VanEck Vectors Gold Miners exchange-traded fund (GDX) +16%, and Gold itself +21% from this day a year ago. What stands stark in this construct is all these equities lagging Gold! Simply look mid-chart ’round May when Gold was as high as ’tis now, but every equity itself was materially higher than now! The expression may go: “Dere’s Gold in dem dere hills!”, but dere’s real value in dem dere equities! Wow!
Meanwhile, is the StateSide economy Golden? Ehhhh, not really.
“But the Econ Baro had a good week, ehhhh mmb?”
Indeed it did Squire. In fact, of the ten incoming metrics for our Economic Barometer, eight of them improved period-over-period. However, let’s focus on two of those “improvers”. First is the first peek at Q3 Gross Domestic Product: an annualized +4.7% real growth. Impressive. However, again as we do the math: 42% of the otherwise unreported nominal +8.4% growth pace was due strictly to inflation. Unimpressive. And the so-called “Fed-favoured” Core Personal Consumption Expenditures Price Index — after increasing just +0.1% in August — leapt by +0.3% for September: annualized that’s +3.6% and the 12-month summation is +3.5%. Yes, the latter is a two-year low … but is it near the Federal Reserve’s target of +2.0%? No. Still, our best guess for Wednesday’s Open Market Committee Policy Statement is that they’ll unanimously again lie low. Heaven forbid the Fed actually be ahead of the curve. Here’s the Baro:
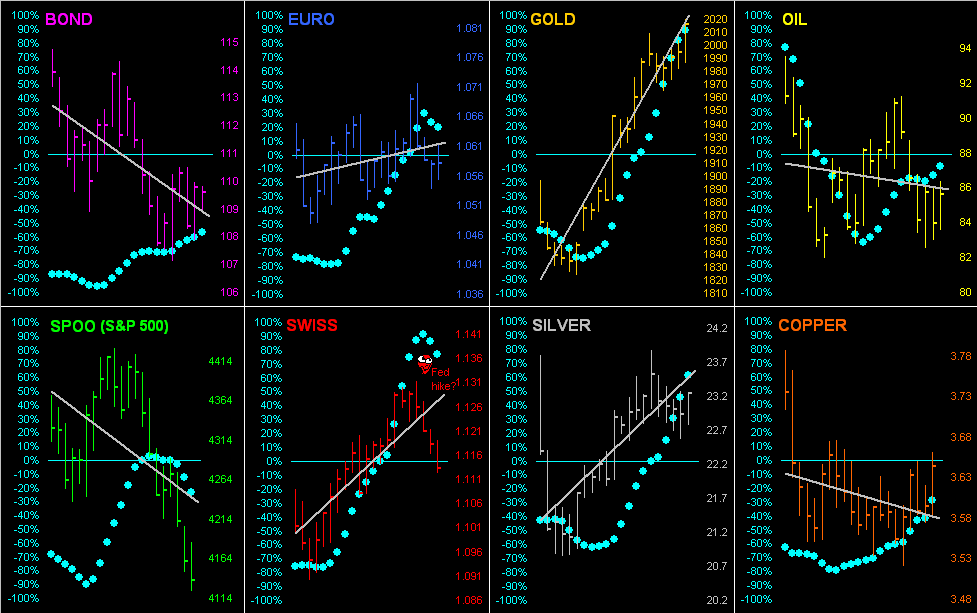
Let’s next go ’round the horn for all eight components that comprise the BEGOS Markets. Here we’ve their daily bars across the past 21 trading days (one month). Each market has its grey linear regression trendline, four at present rising (Euro, Swiss Franc, Gold and Silver) and four thus falling (Bond, Copper, Oil and S&P 500). ‘Course, the consistency of each trend is denoted by the “Baby Blues” which specifically for the Swiss Franc have just dipped below their +80% axis, suggestive of a cheaper Franc near-term. Is that merely coincident that the FOMC may just raise rates, in turn increasing Dollar strength? ‘Tis one of those things that makes us go “Hmmmm…”:
We’ve already alluded to the white metal not getting the geo-political bid that’s been boosting the yellow metal, the Gold/Silver ratio now 86.8x vs. its millenium-to-date average of 67.8x. Priced to that average, Silver today at 23.24 would instead be +22% higher at 29.73, (just in case yer scorin’ at home). Reflective below of Sister Silver not keeping pace is price being mid-10-Day Profile on the right whereas Gold essentially tops its stack on the left:
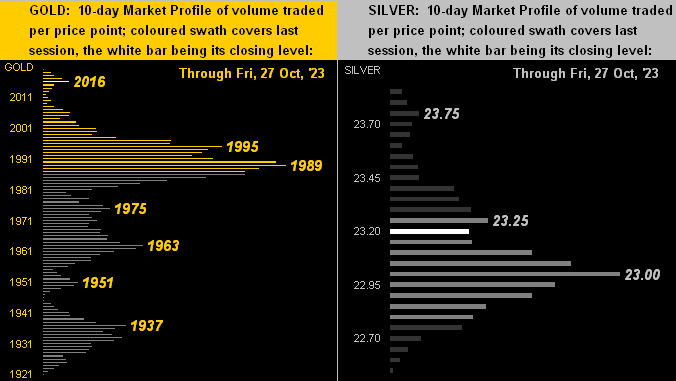
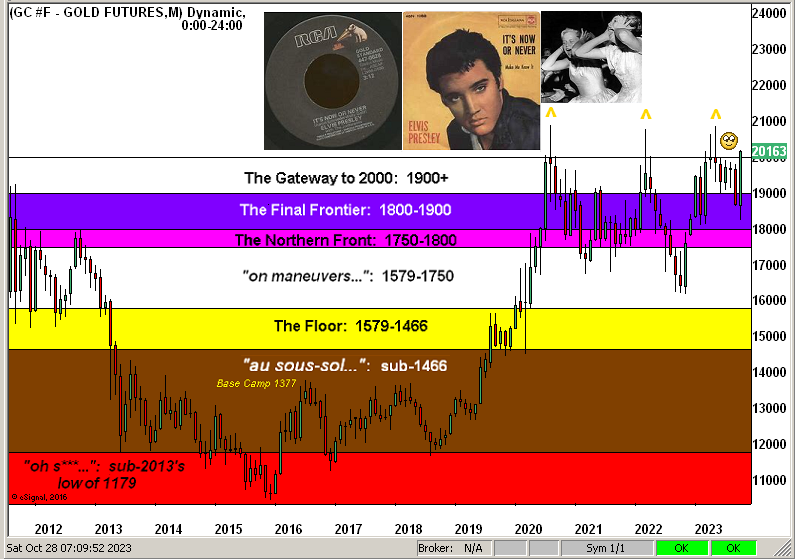
So with but two trading days remaining in October, here now is our stratified Gold Structure by the month across these past dozen years. As oft previously shown, now courtesy of the “Here We Go Again Dept.” we’ve Gold’s triple top which “is meant to be broken” as highlighted by the three Golden arrows. Moreover, we’ve anticipated on occasion throughout this year’s missives that Gold shall record a fresh All-Time High in 2023: obviously the momentum is there, barring a post-geo-political price retrenchment (as is the rule rather than the exception). Nonetheless, let’s cue Elvis from back in ’60 with “It’s now or never…”:
Through these 10 months we’ve emphasized the importance of doing the math to get to the truth of such critical metrics as economic inputs, p/e calculations, and so forth. And whilst nothing light can be made of the horrific Mid-East mayhem, as this past week unfolded a mathematical “challenge” shall we say “came to light” over at the United States Department of State. Hat-tip ExecutiveGov which reported: “The Department of State has issued an advisory cautioning United States citizens against travel to more than 200 countries amid rising geopolitical tensions and conflict.” ‘Course, you can see where this is going, given (hat-tip Quora) stating: “Today, there are 197 countries in the world…“ The bottom line here being: if you’re in the States, you’re sorta stuck from going anywhere, nor beyond! Best therefore not to squirm; rather stay firm and stuck in Gold!
Cheers!
…m…
www.TheGoldUpdate.com
www.deMeadville.com
*********

Mark Mead Baillie has had an extensive business career beginning in banking and financial services for two years with Banque Nationale de Paris to corporate research for three years at Barclays Bank and then for six years as an analyst and corporate lender with Société Générale.
For the last 22 years he has expanded his financial expertise by creating his own financial services company, de Meadville International, which comprehensively follows his BEGOS complex of markets (Bond/Euro/Gold/Oil/S&P) and the trading of the futures therein. He is recognized within the financial community of demonstrating creative technical skills that surpass industry standards toward making highly informed market assessments and his work is featured in Merrill Lynch Wealth Management client presentations. He has adapted such skills into becoming the popular author each week of the prolific “The Gold Update” and is known in the financial website community as “mmb” and “deMeadville”.
Mr. Baillie holds a BS in Business from the University of Southern California and an MBA in Finance from Golden Gate University.


