Stock Market: Big Sell-Off Looming!


 Last time I wrote, I was expecting the stock market to fill the gap left on the SPX near 2081-82 by Friday last week. That was accomplished on Thursday when the SPX fell to 2077. What I saw on my indicators showed more a lack of buying then true selling and it also presented a looming Head and Shoulders Pattern Top. We went long on the dip and sold into strength on Friday. In fact, we started to short late in the day as the strength of the move was not enough to offset the damage done on the charts. We plan on completing our short selling Monday on the open.
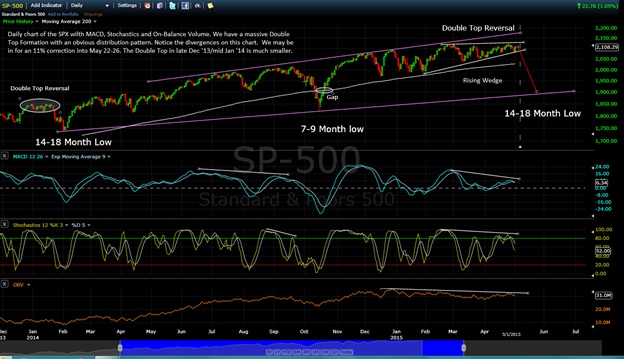
If you remember, I had recently written that ‘normally, with fewer and fewer stocks participating with this kind of pattern, you would soon expect a 9-10% correction’. Well, I believe that correction is finally at hand.
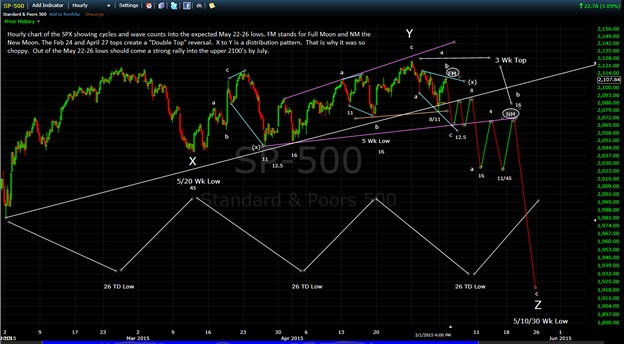
Astro-wise, we have Mercury opposing Saturn Sunday on the Full Moon and then Saturn sesqui-squaring Uranus Monday (usually an outlier event signature that can cause panic). To top that off, we have the Sun T-Squaring Jupiter, which can exaggerate the move. We have a Bradley turn due Monday coming off what appears to be the end of a counter trend ‘b’ wave. All this tells me we have a ‘c’ wave down into late Monday or early Tuesday to the SPX 2064/65 zone. Top to bottom, this would be about a 2% drop. From what I’m reading, this is just the beginning of the down move. Things are likely to get volatile.
Below are hourly and daily charts of the SPX with cycles and e-wave denotation:
We are entering the ‘trader’s dream’ and the ‘investor’s nightmare’. “Oh, the stock market will always come back”, they say, and they are right. These types of patterns are strongly bullish once resolved, but they don’t realize that some of fastest and easiest money is made when the stock market drops like this and then rebounds. I keep saying: the days of ‘buy and hold’ are coming to an end. The easy money has been made.
Regarding silver, the 25 week low is probably going to come late this time, as the last low ran 22 weeks. The last time this happened, the next low ran 29 weeks. If this pattern repeats, we may not see a good bottom to buy until the week of the expected stock market low at the end of the month. Keep in mind, we are in a bear market in precious metals that will likely last until at least the fall of 2016.
********
The BluStar Market Timer was rated #1 in the world by Timer Trac in 2014 (and from April 1,2014 through March 31, 2015), competing with over 600 market timers. This occurred despite what the author considered to be (and still considers to be) a very difficult trading environment.
Brad Gudgeon, editor and author of the BluStar Market Timer, is a market veteran of over 30 years. The subscription website is www.blustarmarkettimer.info
To view the details more clearly, you may visit our free chart look at www.blustarcharts.weebly.com This web site is also updated periodically as events unfold.
Copyright 2015 BluStar Market Timer. All Rights Reserved.
Disclaimer: The information provided by the BluStar Market Timer is to be used for educational purposes only. We do not recommend the buying or selling of any securities, are not registered investment advisers and do not offer investment advice. Stock market investing is considered risky. Market timers can and do make mistakes. Past performance is never a guarantee of future performance.


