Stock Market Correction At Hand As Gold Is About To Rally?


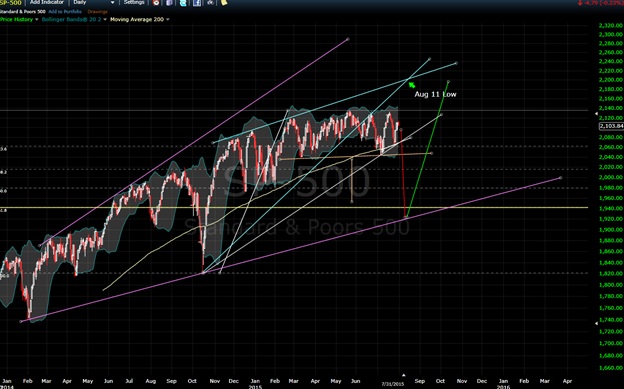
The stock market likely put in a failing 'b' wave top Friday at SPX 2114. The chart below shows potential down as low as SPX 1920 for the coming decline into the expected August 11, 2015 low. The actual 40 week low is due on August 7, so I don't know if August 7 to 11 creates a double bottom reversal or not. Usually, these types of bottoms are spike bottoms.
The last 20 week low in March ran 7 TD's down to its low. The rise last week reminds me of the late Nov/early Dec topping pattern (only that time it made a new high while this one has failed) and it projects down to August 11 and SPX 1930 based on the percentage differences, this one being 1.69 times as potent.
The recent head and shoulders pattern is projecting a minimum of 1952 SPX and the .618 retrace line is 1941. The magenta "Irregular Megaphone Pattern" has support at 1920, but usually these types of declines (at this point in time - the third drop) fail just shy of the rising bottoms line of the Irregular Megaphone Pattern making 1930 seem more likely. 2134 (late May top) to the 1920 target represents about a 10% decline.
The blue rising bottoms and tops line on the chart meet on August 11, suggesting we see an important bottom on that date. I call these TLC or "Trend Line Convergence" lows. The last 3 of importance occurred on May 27, June 30 and July 8.
Statistics: The last time we saw greater than 13% of NYSE stocks at new 52 week lows was last October 2014. From top to bottom, the SPX fell 199 points or about 9.85%. To match that number, we need to see the SPX move down to around 1924 SPX, just above the 1920 level on August 11.
More statistics: There is evidence we are seeing the last gasps higher just before a nasty bear market. The last times we saw less than 27% of investment advisors bearish; an 18 or higher PE; less than 60% of stocks above the 200-day moving average occurred in November 1972, March 2000 and October 2007. Only the Nov 1972 occurrence gave us a couple of months warning and the high was 4% higher than the signal.
I believe that this drop in early August will set up one more screaming rally into late September/early October to perhaps the 2200 plus area and then we go down hard into late 2016/early 2017 to at least the 1700 area or about a 22% decline minimum. The last bear markets with these statistics went down 40% plus, so I am probably too conservative.
I don't believe this coming bear market will be the BIG one. That is due to occur from 2018 to 2020/21 (so we may expect a huge rally from 2017 to 2018 before the final drop).
Another note: Usually the hardest part of a 7 trading day decline occurs in the last 3-4 trading days. There are 2 potential catalysts for a decline this week.... the Chinese PMI report on Tuesday and the US employment report on Friday. Thursday next week should be the 4 TD cycle top from Friday so Thursday to the following Tuesday should be the hardest part of the drop.
The Dow Industrials just snapped back to their 200 day moving average, so I expect that once we break the new trend line support and 200 day moving average on the SPX (quite possibly Tuesday this week) we may experience a choppy "up, down, up" into Thursday before the final break lower.
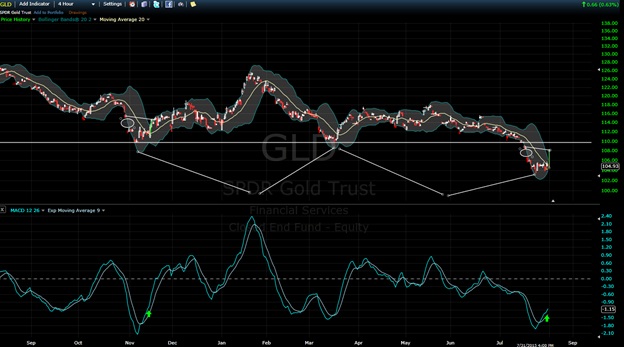
Gold looks like it is ready to explode upward within the next 1-2 trading sessions. The last time we had this many short futures contracts, the gold market moved up strongly for two months. The COT tells us that the net commercial positions are bullish. The short specs must cover their shorts by buying back via going long gold, which should begin starting early next week.
The initial pops off these secondary 'b' wave lows can be quite dramatic, occurring within one trading day in many instances. The last time the gold market popped up in the same situation, it came within a hair's reach of its large gap down all in one day and then continued somewhat higher over the next few days and dramatically higher over the next few weeks.
If gold does not start trading up by trading day 5 off the maximum low (July 24- July 31), it has in the past done so on trading 6 or 7 (August 3 or 4), which translates to Monday or Tuesday this coming week (likely Tuesday). The wave pattern doesn't quite look done to the down side and we may have one more attempt to take it down some before a big 'one day' short covering rally begins either Monday or Tuesday. Initial support is $9 lower than the Friday close or at about $1086 +/-.
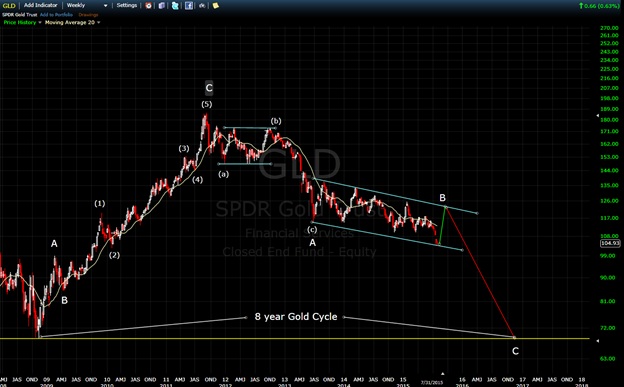
I believe that gold and silver are still in bear markets. The weekly projection below explains gold in e-wave language along with the expected gold and silver bottom due in the Fall of 2016.
********
Brad Gudgeon, editor and author of the BluStar Market Timer, is a market veteran of over 30 years. The subscription website is www.blustarmarkettimer.info
To view the details more clearly, you may visit our free chart look at www.charts.blustarmarkettimer.com
This web site is also updated periodically as events unfold.
Copyright 2015 BluStar Market Timer


