Supply And Demand Report


 The prices of the metals rose a bit this quiet, holiday week. Merry Christmas!
Speaking of Christmas, Keith’s brother who is an amateur woodworker of growing skill, gave him this present on Friday.
Regular readers may recognize the design as our logo. Each “M” is made of a single piece of wood. They are stained or painted in the correct colors. The minute hand is silver and the hour hand is gold (paint, alas!) It now occupies a prominent place in the office. :)
It is worth taking this time to review something that, based on some reader comments, may be the source of some confusion. The Monetary Metals fundamental price is measuring just that, the fundamentals. As with stocks or any other asset, our centrally banked, government-distorted markets can experience price volatility and even prices that deviate from the fundamentals for a long period of time. Just because we have been calculating a fundamental price for gold that is well over a hundred bucks above the market price, does not mean that the market price has to spike up $100 tomorrow morning. It might—and we certainly would not short gold when the market is in such a state. But as the market has proven since August, it might remain depressed for quite a while.
We have one other comment on this topic. For the longest time, we were calling for the silver price to drop sharply. It stubbornly did not, or when it did drop it would soon recover. We received some hate mail, and a lot more skepticism. In the end, it turned out that we were right and all the silver bulls were wrong. The silver price hit our lowest target, with a 13 handle.
We will continue to show our data, discuss our theory, and call ‘em like we see ‘em. Speaking of which, read on for the only true look at the fundamentals of gold and silver…
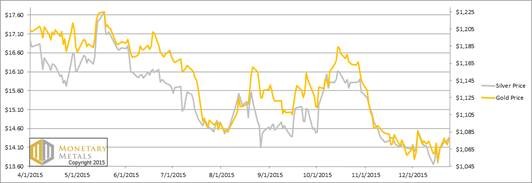
But first, here’s the graph of the metals’ prices.
The Prices of Gold and Silver
We are interested in the changing equilibrium created when some market participants are accumulating hoards and others are dishoarding. Of course, what makes it exciting is that speculators can (temporarily) exaggerate or fight against the trend. The speculators are often acting on rumors, technical analysis, or partial data about flows into or out of one corner of the market. That kind of information can’t tell them whether the globe, on net, is hoarding or dishoarding.
One could point out that gold does not, on net, go into or out of anything. Yes, that is true. But it can come out of hoards and into carry trades. That is what we study. The gold basis tells us about this dynamic.
Conventional techniques for analyzing supply and demand are inapplicable to gold and silver, because the monetary metals have such high inventories. In normal commodities, inventories divided by annual production (stocks to flows) can be measured in months. The world just does not keep much inventory in wheat or oil.
With gold and silver, stocks to flows is measured in decades. Every ounce of those massive stockpiles is potential supply. Everyone on the planet is potential demand. At the right price, and under the right conditions. Looking at incremental changes in mine output or electronic manufacturing is not helpful to predict the future prices of the metals. For an introduction and guide to our concepts and theory, click here.
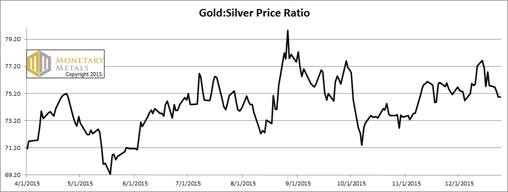
Next, this is a graph of the gold price measured in silver, otherwise known as the gold to silver ratio. The ratio fell this week.
The Ratio of the Gold Price to the Silver Price
For each metal, we will look at a graph of the basis and cobasis overlaid with the price of the dollar in terms of the respective metal. It will make it easier to provide brief commentary. The dollar will be represented in green, the basis in blue and cobasis in red.
Here is the gold graph.
The Gold Basis and Cobasis and the Dollar Price
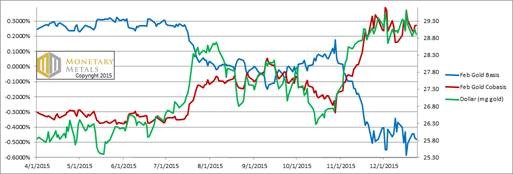
The cobasis (i.e. scarcity of gold) and price of the dollar (which is inverse of the price of gold, measured in dollars) continue their uncanny tracking. We say that these price moves are unimportant.
Obviously—this should go without saying—it’s very important to anyone who has made a bet on the gold price. That’s not what we mean.
We are saying that nothing fundamental changed. If the price went up—as it did this week—then it was speculators buying to front-run a larger price move that they hope is coming. If the price fell, as it did in other weeks, it was speculators selling. These waves of speculative buying and selling do not generally change the fundamentals of the market.
Now let’s look at silver.
The Silver Basis and Cobasis and the Dollar Price
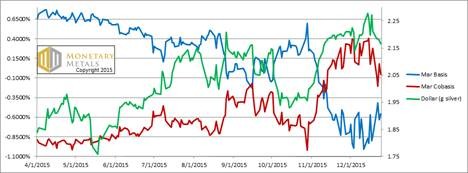
As the dollar dropped in silver terms, so did the scarcity of silver. The scarcity dropped a bit faster, and now the backwardation has faded away. On Thursday, at $14.35, silver is no longer really scarce. We would not call it abundant, nor scarce.
The fundamental price of silver fell a few cents this week. It’s now basically at market.
© 2015 Monetary Metals
 Dr. Keith Weiner is the CEO of Monetary Metals and the president of the Gold Standard Institute USA. Keith is a leading authority in the areas of gold, money, and credit and has made important contributions to the development of trading techniques founded upon the analysis of bid-ask spreads. Keith is a sought after speaker and regularly writes on economics. He is an Objectivist, and has his PhD from the New Austrian School of Economics. His website is www.monetary-metals.com.


