Technical Analysis Of The Markets


Contrary to every publicized commodity and stock market expert on this planet earth, gold did not, I repeat did not top at $1,923.70 an ounce in the month of September, 2011. Gold topped at $1,033.90 in the month of March 2008.
The proof of this fact is based on the rarest of corrective patterns ever seen on any commodity or stock chart. This pattern is so rare that it can only be the result of an equally rare occurrence.
This is the pattern that is rarely if ever seen.
Running flat
“In a rare variation on the 3-3-5 pattern, which we call a running flat, wave B terminates well beyond the beginning of wave A as in an expanded flat, but wave C fails to travel its full distance, falling short of the level at which wave A ended. Apparently in this case, the forces in the direction of the larger trend are so powerful that the pattern becomes skewed in that direction.” E. W. P.
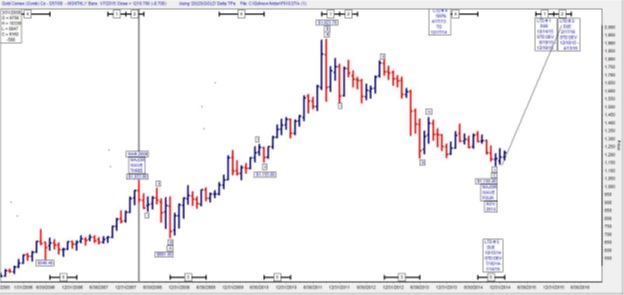
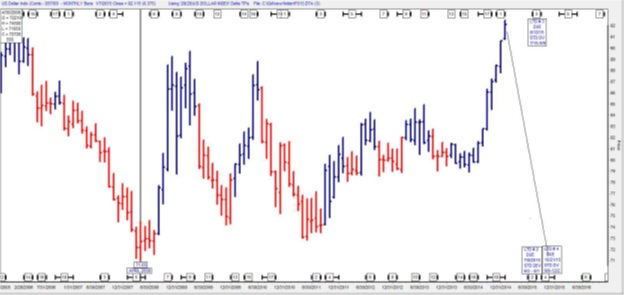
Gold topped at $1,033.90 an ounce in March 2008. The Dollar Index bottomed one month later in April 2008. Gold never would have risen almost $1,000.00 an ounce while the Dollar index was rising dramatically unless the rise in gold was part of an extremely rare correction. The extremely rare corrective pattern in gold was the result of an equally rare cause.
GOLD MONTHLY
DOLLAR INDEX MONTHLY
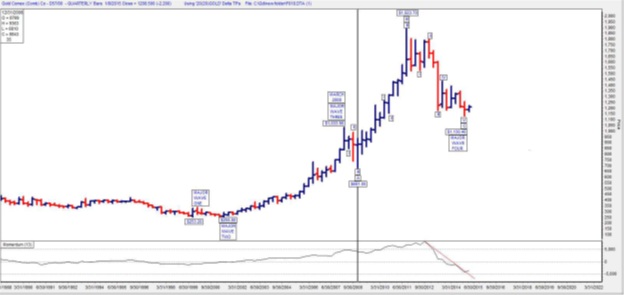
The next chart shows the extremely rare running flat correction positioned so it can be seen to have taken place beyond any doubt. With three waves down, three waves up, and a final five waves down this extremely rare running flat correction is complete. The momentum indicator beneath this chart has turned up.
GOLD QUARTERLY
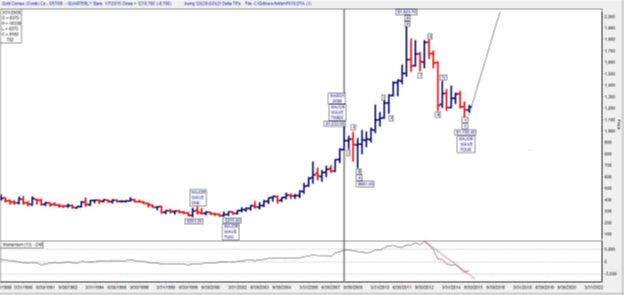
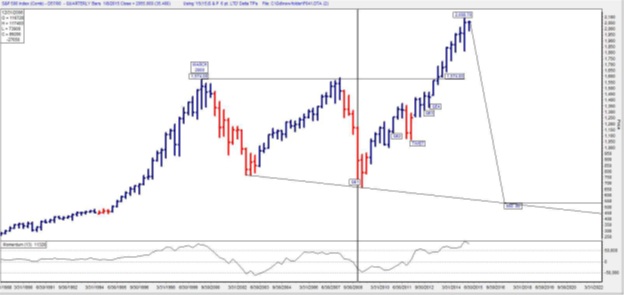
What cause could be so rare as to effect an extremely rare running flat corrective pattern in gold? It is so obvious it should be beyond any doubt whatsoever! The beginning of the Federal Reserve’s extremely rare Quantitative Easing policy is the cause that effected the extremely rare running flat corrective pattern in gold. A normal correction in gold was underway when the advent of the QE’s turned it into a running flat corrective pattern. The pattern is complete. The momentum indicator beneath the gold chart has turned up. The momentum indicator beneath the S & P 500 chart has turned down. What can we expect the price of gold to do from here on out?
S&P500 QUARTERLY
GOLD QUARTERLY
********
For subscription information https://www.deltasociety.com/content/ron-rosen-precious-metals-timing-letter
Disclaimer: The contents of this letter represent the opinions of Ronald L. Rosen. Nothing contained herein is intended as investment advice or recommendations for specific investment decisions, and you should not rely on it as such. Ronald L. Rosen is not a registered investment advisor. Information and analysis above are derived from sources and using methods believed to be reliable, but Ronald L. Rosen cannot accept responsibility for any trading losses you may incur as a result of your reliance on this analysis and will not be held liable for the consequence of reliance upon any opinion or statement contained herein or any omission. Individuals should consult with their broker and personal financial advisors before engaging in any trading activities. Do your own due diligence regarding personal investment decisions.


