Technical Analysis Of The Markets


Current Position of the Market
SPX: Long-term trend – The bull market is continuing with no sign of a major top in sight.
Intermediate trend – Possible short-term high.
Analysis of the short-term trend is done on a daily basis with the help of hourly charts. It is an important adjunct to the analysis of daily and weekly charts which discusses the course of longer market trends.
SPX At Key Support
Market Overview
In the last letter, I suggested that SPX could have a final thrust to 2690+ which could turn out to be the final high before it was pulled down into the January cycle lows. On Monday, it obliged with a high of 2695 followed by a decline of 18 points before stabilizing. It then rallied back to 2693 in what looks like a secondary high before declining again to 2679 on Friday, and closing the day with a bounce of a few points.
There are good reasons to believe that 2695 is, at least, a temporary high which should bring about a decent, though not excessive, correction. One of the most reliable cycles is expected to make its low between January 4 and January 12 (if the full span is achieved) which, when you take away the holidays, is not that many trading days away; especially when, in a bull market, the cycle has the habit of topping a couple of weeks before it makes its low.
Also, 2695 was the target for the P&F count taken across the 2636 line, which was confirmed by another projection from the 2654 low. But, as mentioned before, ad nauseam, the index must now show us that it has reversed. Fortunately, we won’t have long to wait. On Friday, SPX found support at a key level which will be shown clearly when we analyze both daily and hourly charts. So, let’s get-on with it.
Chart Analysis (These charts and subsequent ones courtesy of QCharts)
SPX Daily Chart (+GDX)
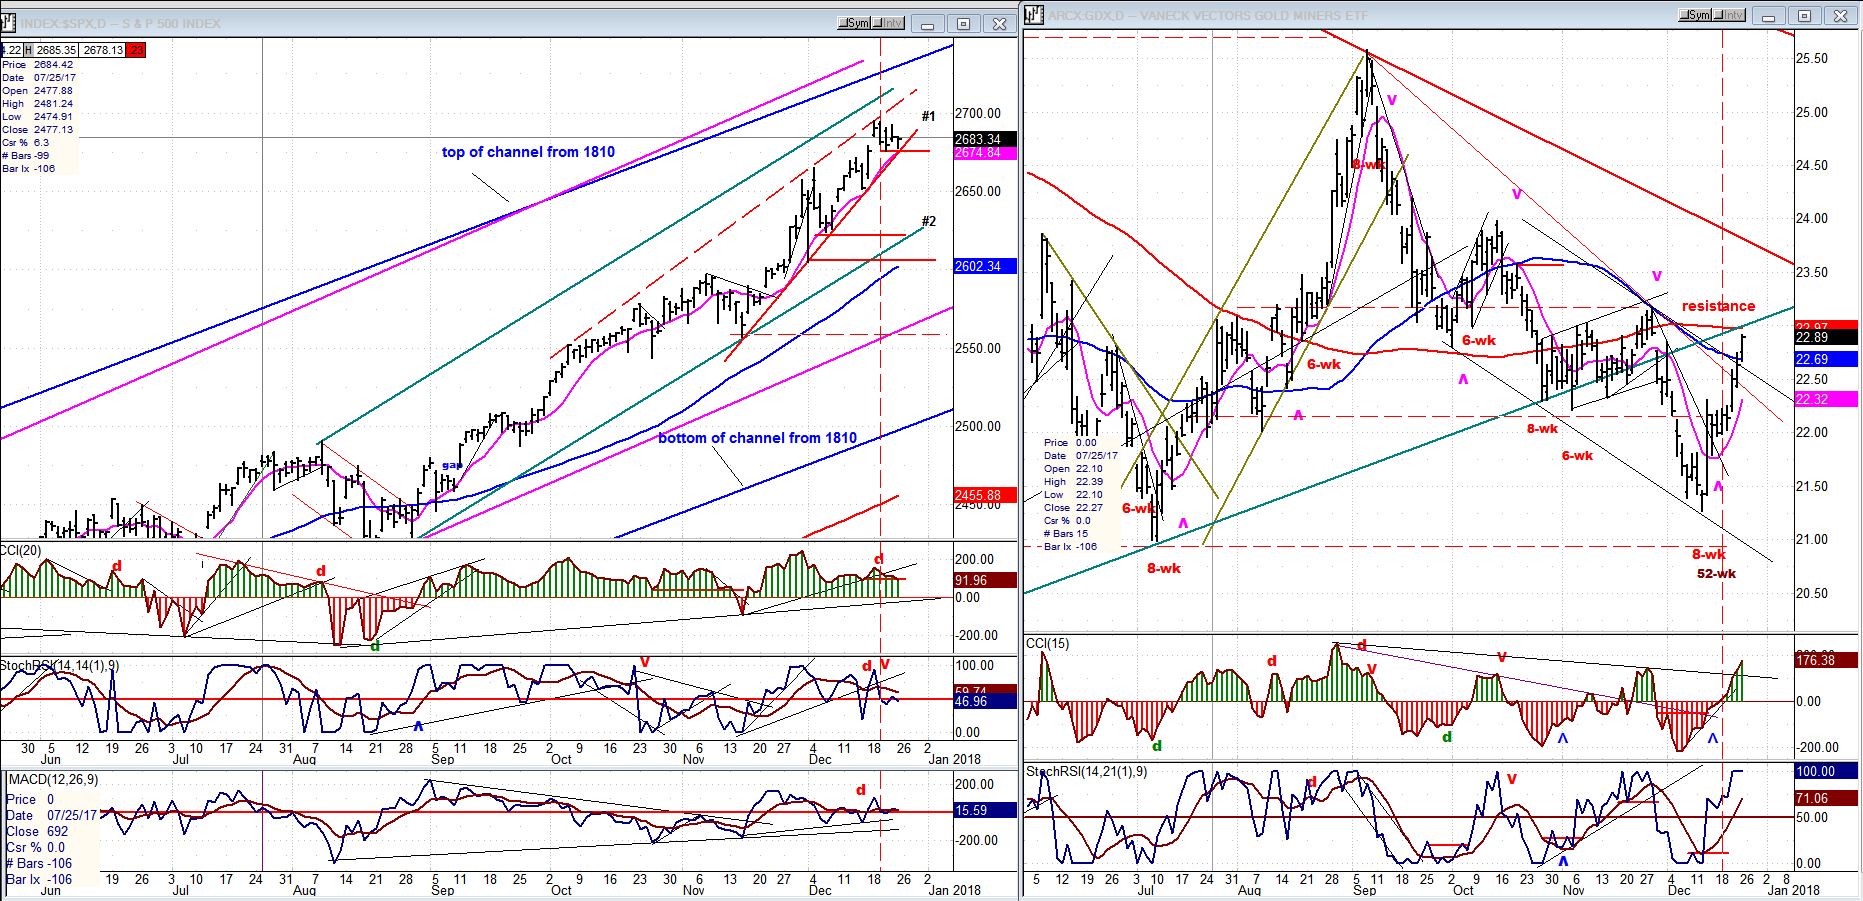
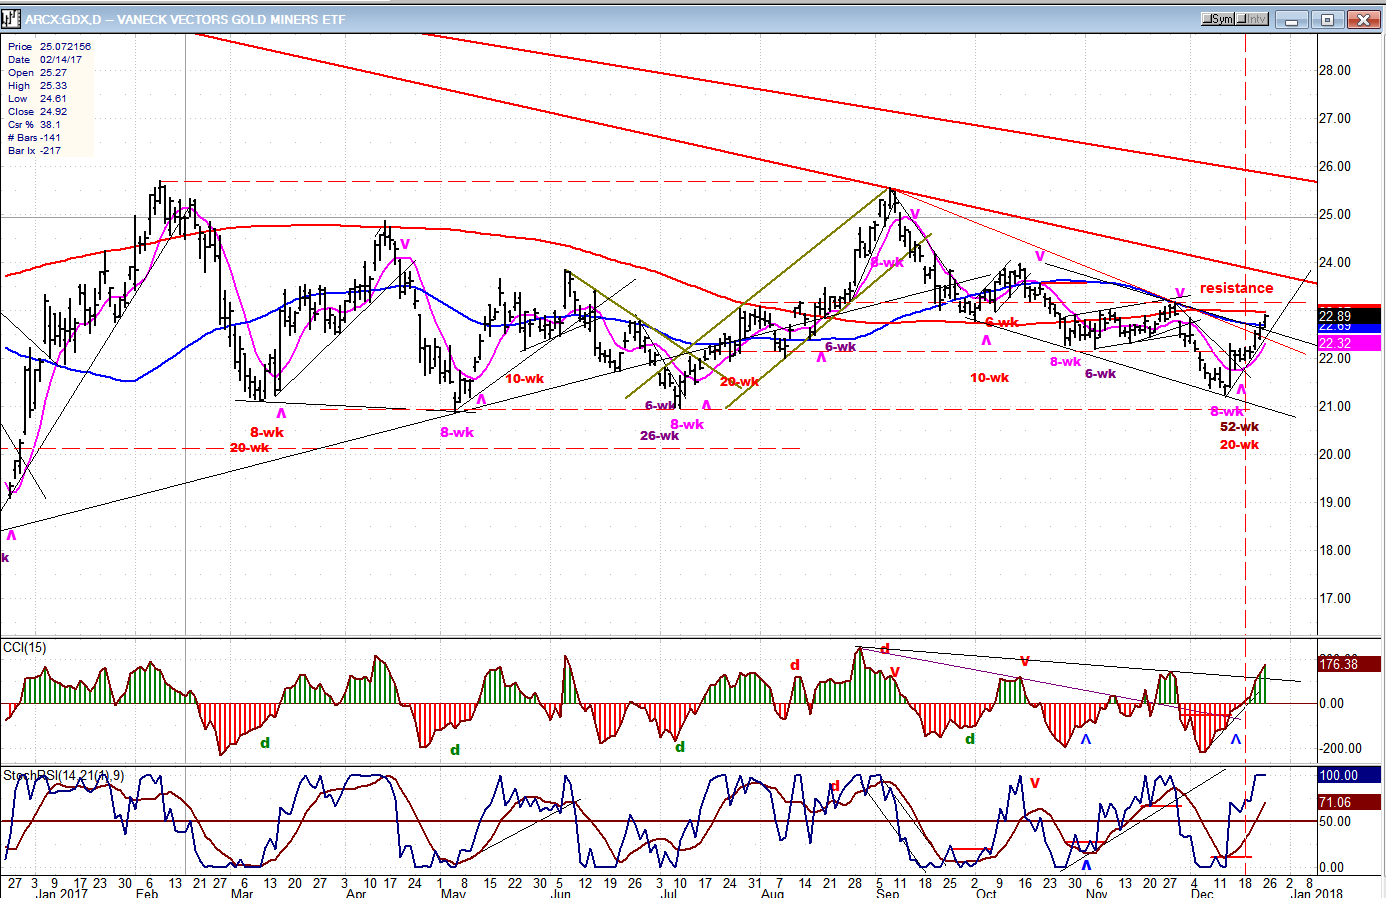
This week, I want to show you the daily charts of SPX and GDX, side by side. If you recall, last week I mentioned that SPX tended to make a high when GDX made its 52-wk low, and I drew a vertical dashed line on the charts a few weeks ago to identify that date. Although GDX appears to have made its 52-wk low a little early (I’m splitting hairs now), I believe there was an 8-wk cycle bottoming just ahead of it and there is also a 10/20-wk cycle in there somewhere. You can see that GDX was very obedient and turned up precisely in that time frame. So far, if SPX made its high at 2695, it would be spot on with the low in GDX but, as mentioned above, it will have to prove that it has, so we need to wait until next week – possibly only until Tuesday morning – to have that confirmation.
The proof should come if, as was also discussed, we break below the steep red trend line (#1) as well as below the 2676 low (red horizontal line), and keep going. Considering Friday’s action, doing so at the opening on Tuesday would not be surprising; and if we did, we would also break below the pink MA at the same time. The three oscillators at the bottom of the chart are certainly in a perfect position to give a sell signal by declining into their lower range. Negative divergence occurred when the index made its high; and the two lower oscillators – always leading the top one – appear ready to go below the zero line.
I am not expecting a devastating decline at this time. The amount of distribution which has taken place – if that’s all we get – points to a move bottoming in the vicinity of the pink uptrend line. There is more than one cycle pressuring the market over the short and intermediate terms, and some are considerably larger than the one bottoming in January, but these are in the process of topping, and that could take some time. It is therefore likely that after a moderate decline, SPX will go on to make a new high in preparation for a far more severe correction a little farther down the line.
SPX Hourly Chart
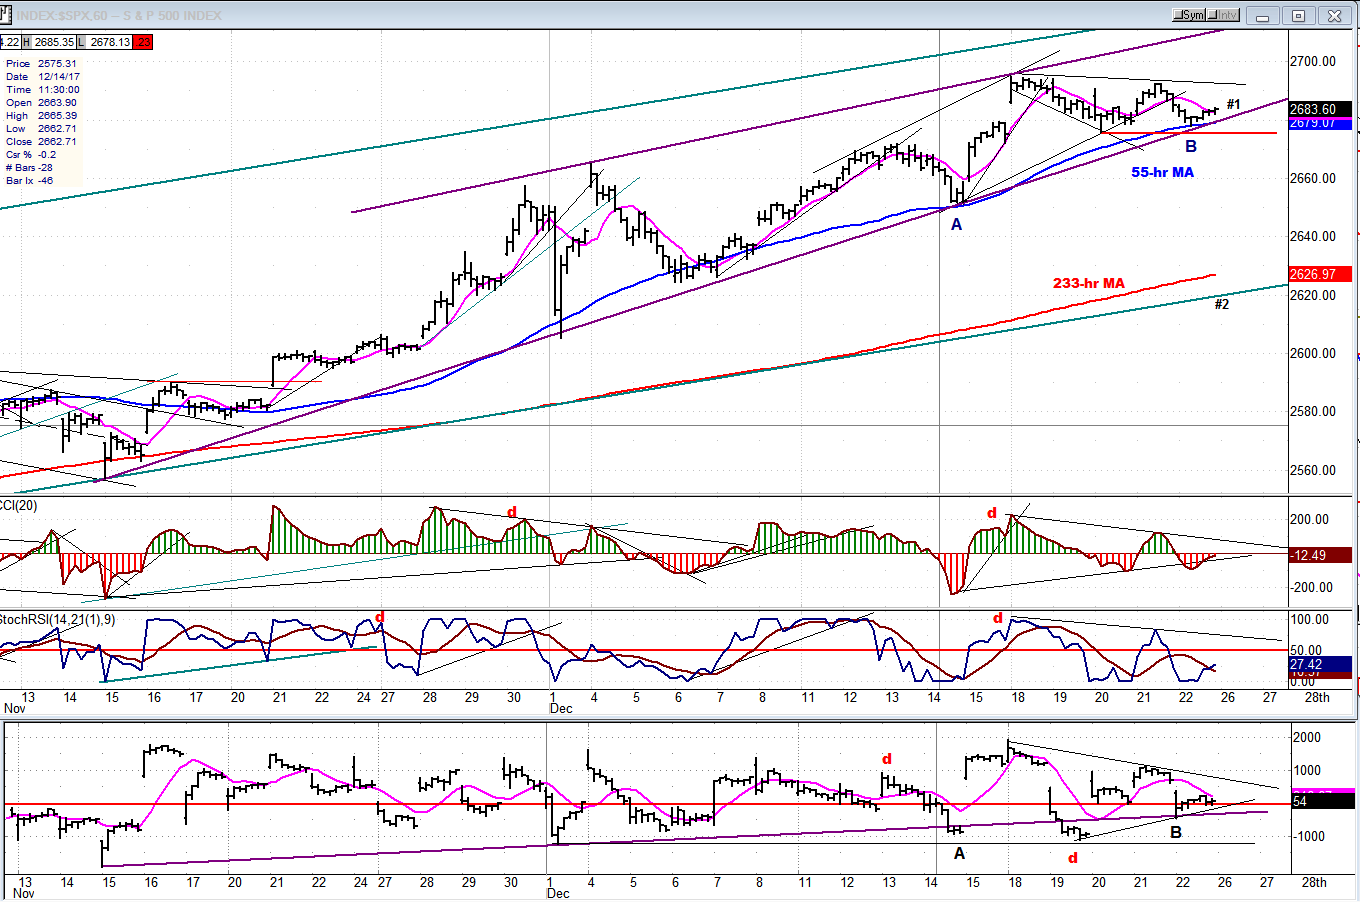
We can derive a lot of good technical information from the hourly chart. Let’s start with the structure! If you remember, the pattern which ended as a short-term top in early December was also an ending diagonal triangle. I say also, because the current pattern also looks like an EDT. The December pattern turned out to have a truncated e-wave which failed to make a final high. Why can’t we have the same situation here? Friday’s secondary top could be a failed fifth wave as well. I’ll let the EWT experts hash that out, and turn to other aspects of the chart which I find even more prophetic.
On the chart, I have marked two recent lows as points A and B, and done the same with the A/Ds oscillator (below the chart) which is made up of the net difference between advances and declines. Let’s look at ‘price’, first. The index came down to its trend line both times before turning up. And I might point out before going any farther, that the last touch on Friday was the fifth point of contact. Something keeps pulling the index back to that trend line (a bottoming cycle maybe?). Until Friday, we had a good reason to keep bouncing off of it: the tax bill deliberations! But now that it’s history, it’s old news and it has lost its mojo!
Now let’s observe ‘how’ the price bounced off the trend line at point A as compared to point B! At the latter, we seem to have lost the trampoline effect and that, combined with this being bounce #5 (and the cycle low drawing closer and closer) strongly suggests that we are ready to go through that trend line. You can see the same action in the A/Ds where I have connected the matching lows with a trend line. Here, the ‘last bounce’ at point B is non-existent.
One final point! During the last few days, the trend line has pretty well followed the course of the blue 55-hr MA. It’s fair to say that if we break below that MA, it will be a little more serious than breaching the shorter pink MA. That could be followed by a move down to the red 233-hr MA which may also be broken if we get there before the cycle low.
Enough said! You get my point.
An Overview Of Some iImportant Indexes (Daily Charts)
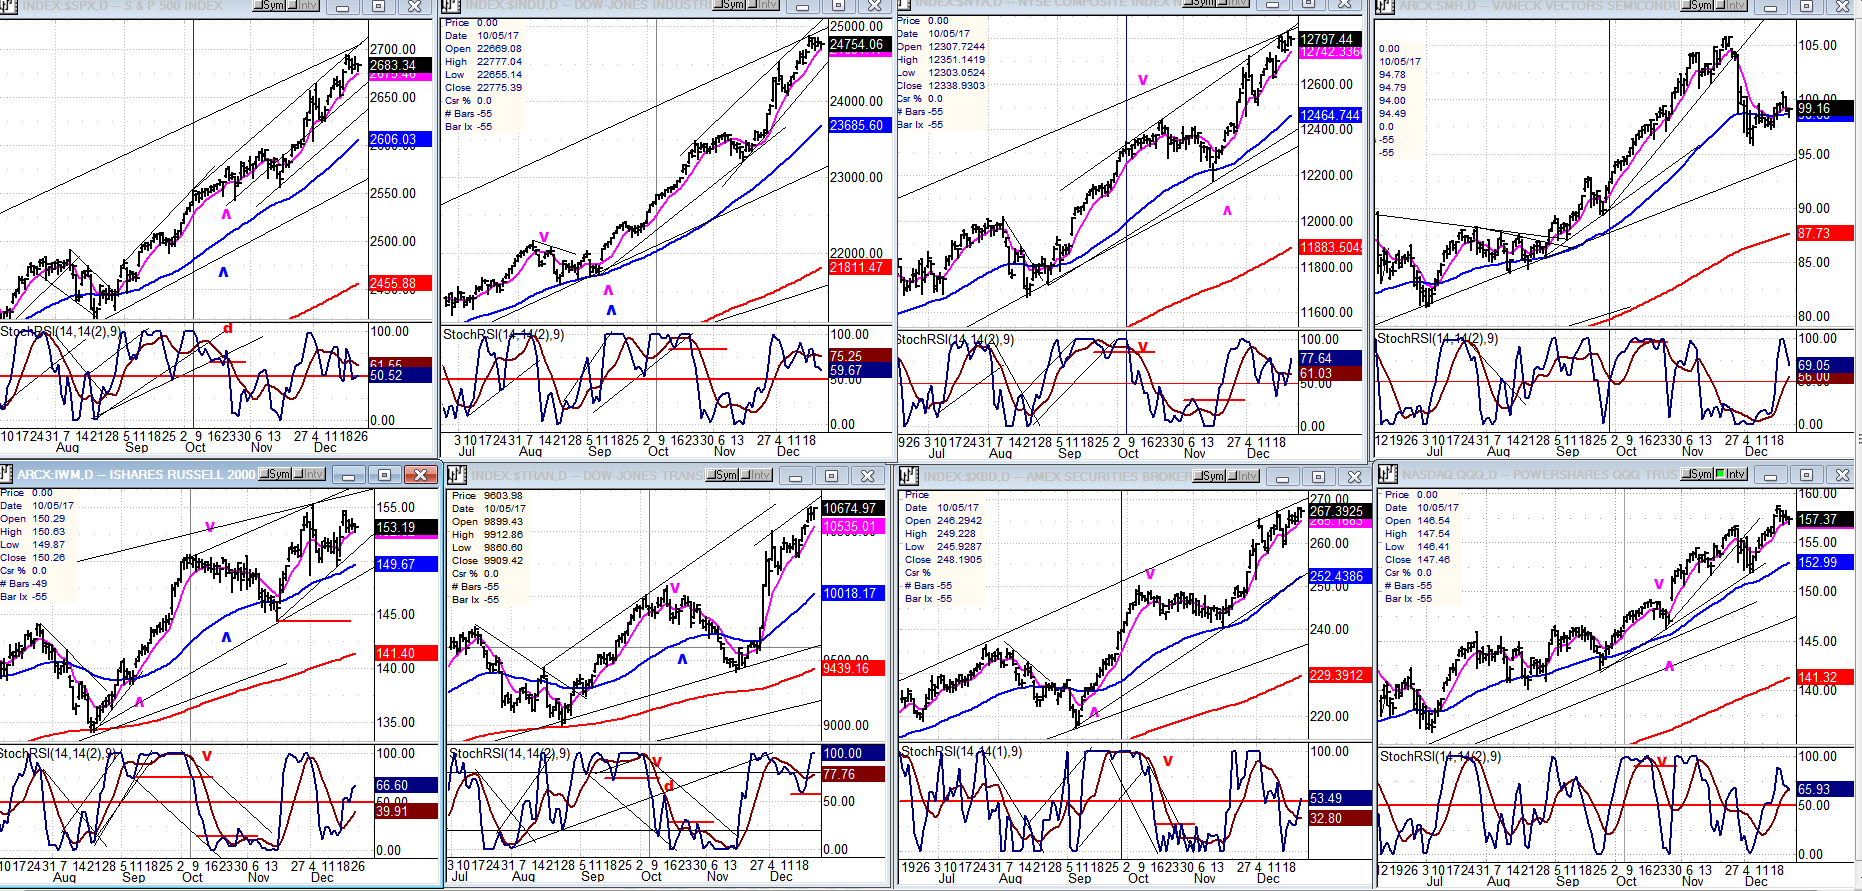
With the market trend being essentially sideways for the past few days, a small congestion pattern has begun to appear on all the charts. The two standouts continue to be SMH (top right) and IWM (bottom left) which appear to have already made secondary highs while the others have not, including the TRAN (second from left, bottom). So, it’s too soon to say if the laggards are leading or if they will play catch-up in the near future. If the others join them, we know that we have the start of a correction.
UUP (Dollar ETF)
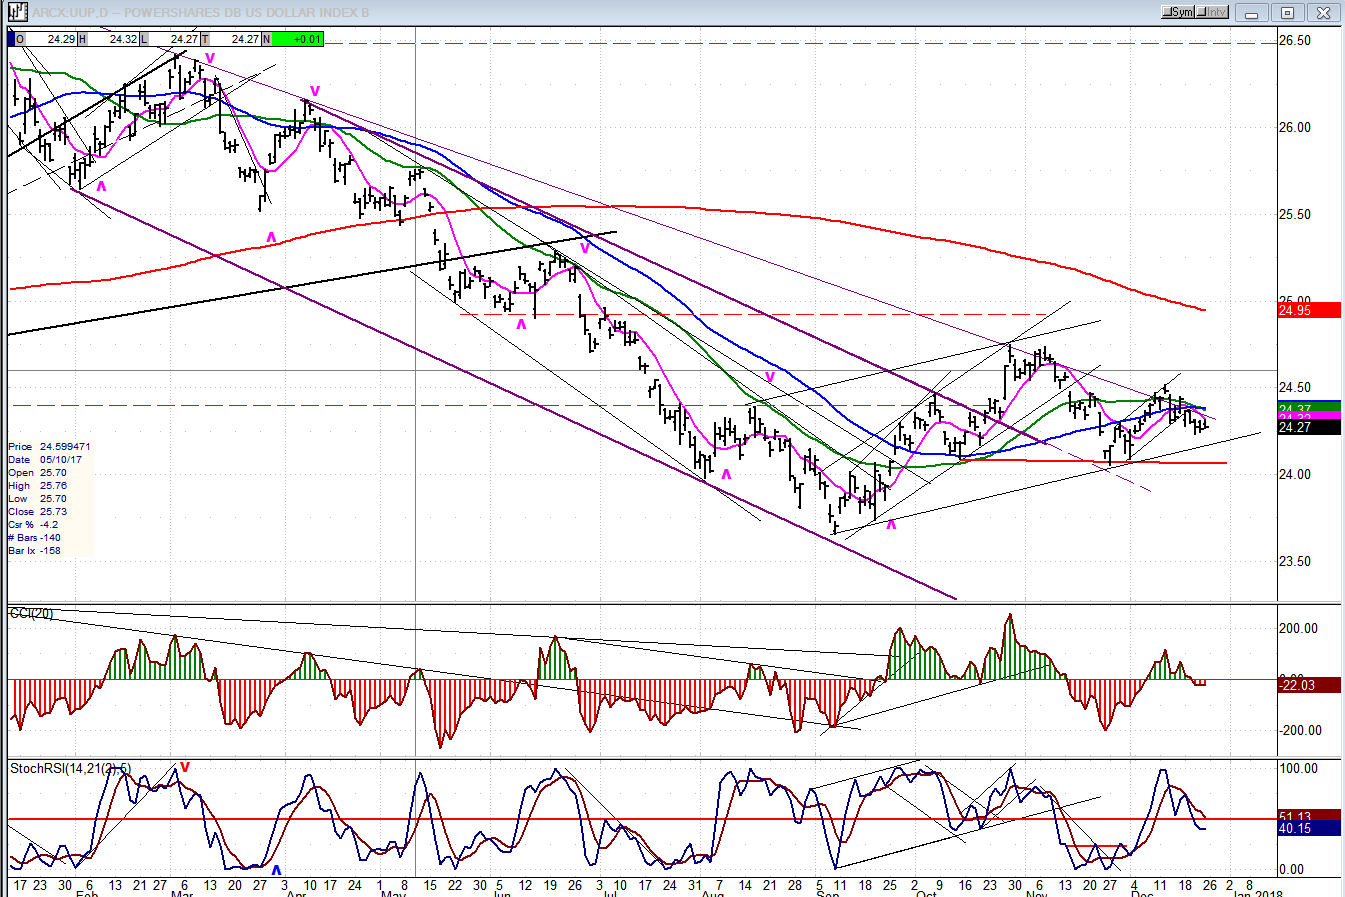
UUP has now stalled twice at its downtrend line. It runs the risk of dropping below the former short-term lows and penetrating what could be the red neckline of an apparent H&S pattern.
GDX (Gold Miners ETF)
We can now say with certainty that GDX (22.89) has reversed at a convergence of cycle lows which includes the 52-wk, the 20-wk (recently added) and 8-wk cycles. Its immediate challenge will be to overcome the (red) 233-DMA (22.97) and the former short-term peak of 23.17.
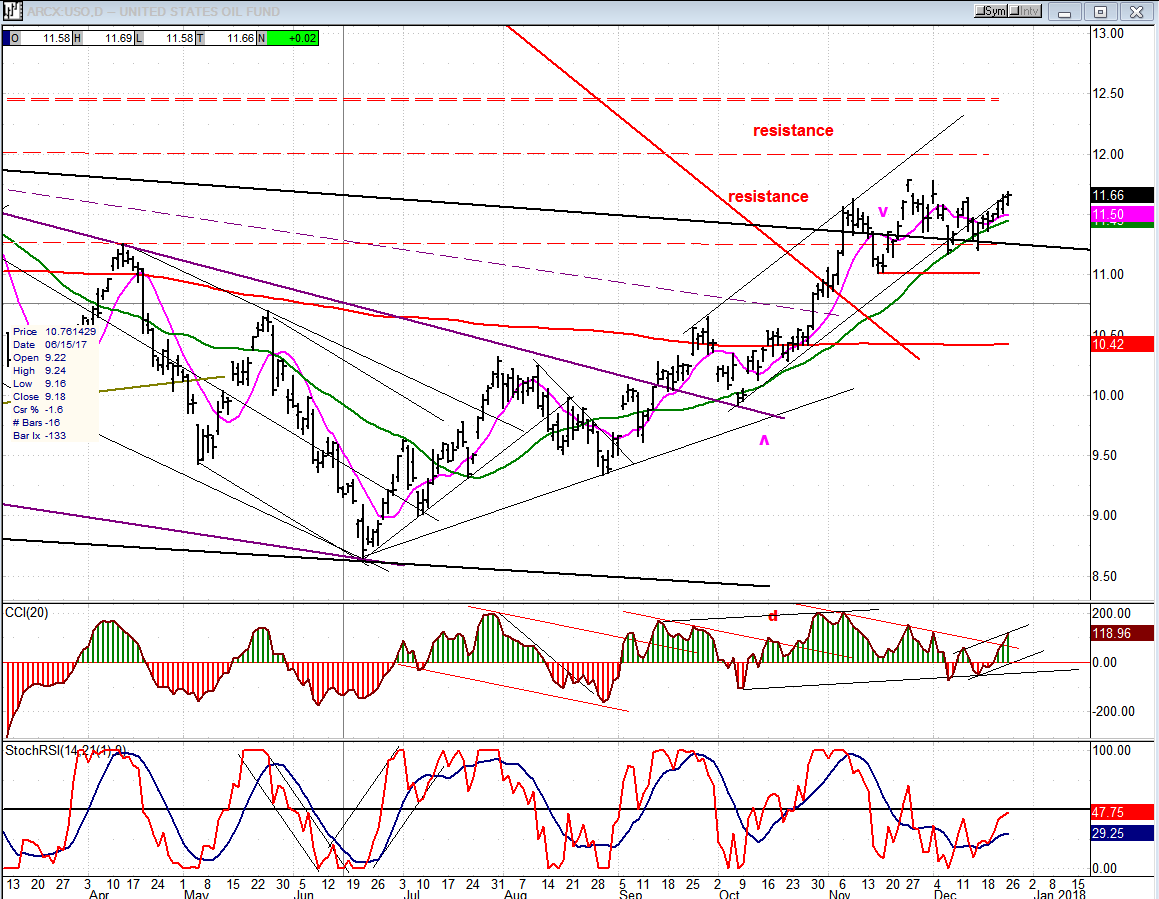
USO (United States Oil Fund)
USO may need to consolidate a little longer before resuming its uptrend. Once it does and gets past 11.80, it should continue to 13.00 short-term and 17.5-18.5 longer-term.
Summary
SPX may have made a temporary top at 2695 on 12/18, followed by a possible secondary high of 2693 last Thursday. On Friday, it declined down to 2678.13, which is a critical support level, and bounced weakly to 2684. The 20-wk cycle is due to make its low in the first or second week of January. This suggests that the decline should resume next week. If so, the precise downside target of the correction will be made available to subscribers as soon as it is confirmed.
I want to wish all my readers Happy Holidays
and
a healthy and prosperous new year
*********
FREE TRIAL SUBSCRIPTON
Market Turning Points is an uncommonly dependable, reasonably priced service providing intra-day market updates, explanations, and commentary, plus detailed weekend reports. It is ideally suited to traders, but it can also be valuable to longer-term holders since price projections are provided using Point & Figure analysis along with best-time estimates obtained from cycle analysis.
For a FREE 4-week trial, Send an email to: [email protected]
For further subscription options, payment plans, and for general information, I encourage you to visit my website at www.marketurningpoints.com.
The above comments about the financial markets are based purely on what I consider to be sound technical analysis principles. They represent my own opinion and are not meant to be construed as trading or investment advice, but are offered as an analytical point of view which might be of interest to those who follow stock market cycles and technical analysis.

When Andre Gratian was a stock broker years ago, a friend introduced him to technical analysis of the market. Consequently, it is not an exaggeration to say that Andre fell in love with this approach! Ever since then, it has become an increasingly important part of his professional life. Gratian has studied the works of Wyckoff, Edwards & Magee, Edward J. Dewey (cycles) and many others. However, one of my most profitable undertaking has probably been to study Point & Figure charting, which he finds invaluable in analyzing stocks and indices. If he were restricted to one methodology, this is the one that he would choose. This well-rounded background has given him what he feels to be a special insight into the stock market, facilitating the recognition of meaningful patterns and the ‘turning points’ in all trends, whether they be short or long term. Andre feels very comfortable discussing the stock market and passing on meaningful information to others. His subscribers include individuals and money managers throughout the world. Moreover, his Newsletters are currently published on several financial sites, here and abroad.


