Technical Analysis Of The Markets


Current Position of the Market
SPX: Long-term trend – The bull market is continuing with a top expected in the low 3000s.
Intermediate trend – The intermediate correction from 2873 has ended and we are in a new intermediate uptrend which should take SPX to a new all-time high.
Analysis of the short-term trend is done on a daily basis with the help of hourly charts. It is an important adjunct to the analysis of daily and weekly charts which discusses the course of longer market trends.
Consolidating In An Uptrend
Market Overview
On 6/13, SPX reached a recovery high of 2791.47 and started to correct the rally which started two weeks earlier and 102 points lower. On Friday, the index sold down to 2762 and closed at 2779. A three-day correction of thirty-two points does not look sufficient to prepare for a new up-phase and, as of Friday’s close, the daily and hourly indicators did not suggest that it had ended. Most likely, this was only the first phase of the correction and some additional backing and filling will be necessary before it has run its course. However, if the rebound that started on Friday should continue and exceed the former high with good breadth, it would be an indication that the correction has already ended.
There is no sign of near-term weakness in the weekly indicators. Therefore, even if the current retracement runs longer and deeper, it should be followed by another rally that brings us closer to the former high of 2872 before a more important correction takes place. As for the top of the bull market which started in March 2009, the end of 2018 would be a good time to start looking for it. Fortunately, the recent correction has made a congestion pattern on the P&F chart that will help us assess the level at which we can expect a major top to form.
Chart analysis
(The charts that are shown below are courtesy of QCharts)
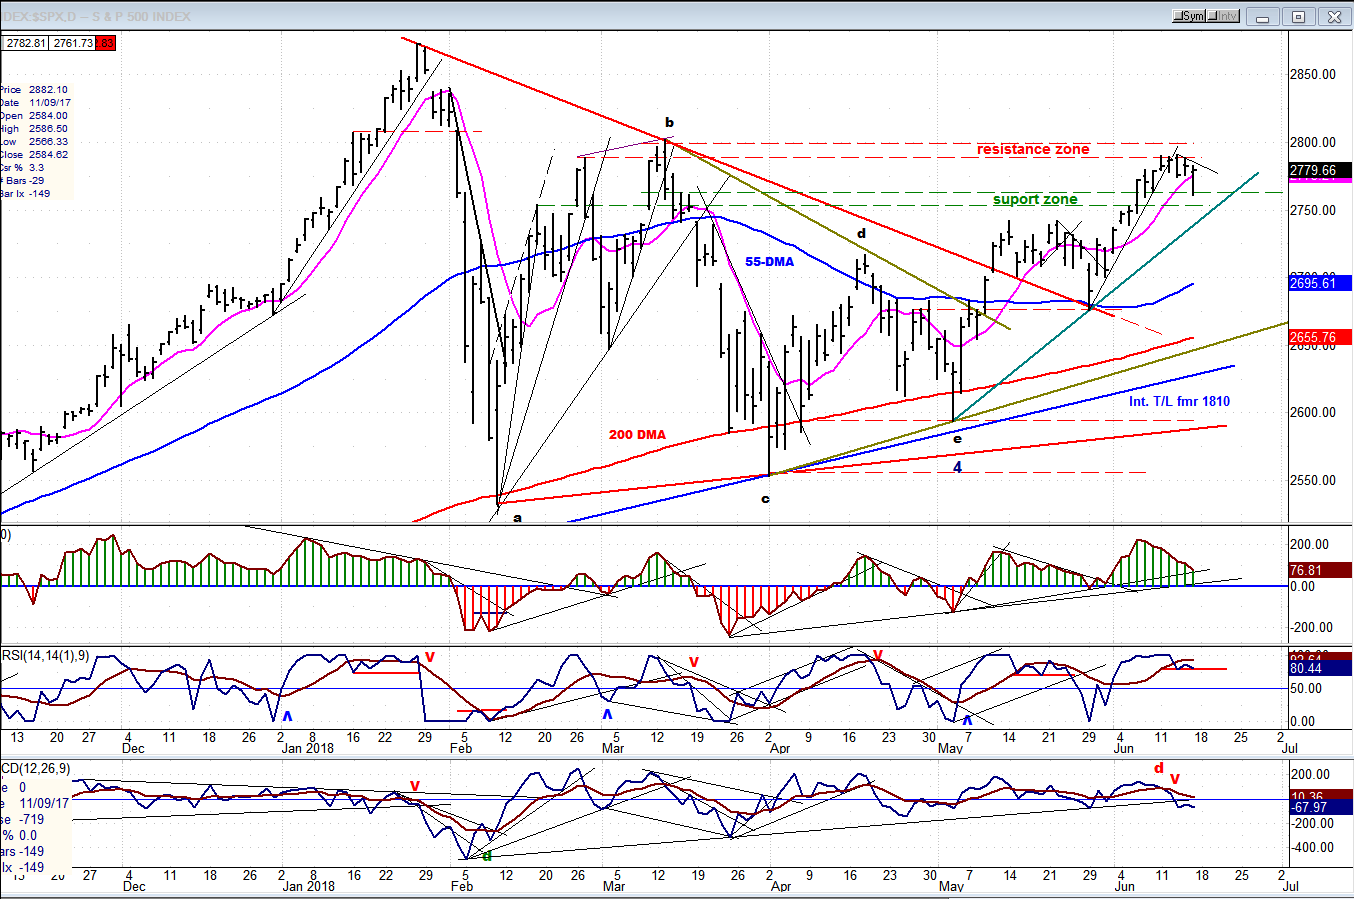
SPX daily chart
The daily price action of the last few days shows that the support and resistance bands that were drawn on the chart are valid. So far, SPX ended its rally at the lower resistance band and has found support on the upper support line. As mentioned earlier, there could be a little more back and forth between these two zones before we are ready to move beyond 2800.
At this point, there are no good clues to tell us if we have already completed the correction, or if more range trading will be needed over the next few days. The top oscillator is still declining and the middle one is still very high and may need to come down a little more first; but this does not give us a clear enough picture and we are not going to get much more clarity by looking at the hourly indicators. Our best bet is to wait until we see what the market does early next week. If we have not made a new high by then, there will be a good chance that the correction is not over.
The P&F chart seems to lean toward more consolidation. A decline down to 2762 on Friday only satisfied a portion of the total congestion pattern that had formed before Friday’s decline. Also, not enough re-accumulation has formed at the 2762 low to take us much higher than Friday’s rally top. Everything considered, I am going to lean toward a little more consolidation before we see a breaking out of the formation.
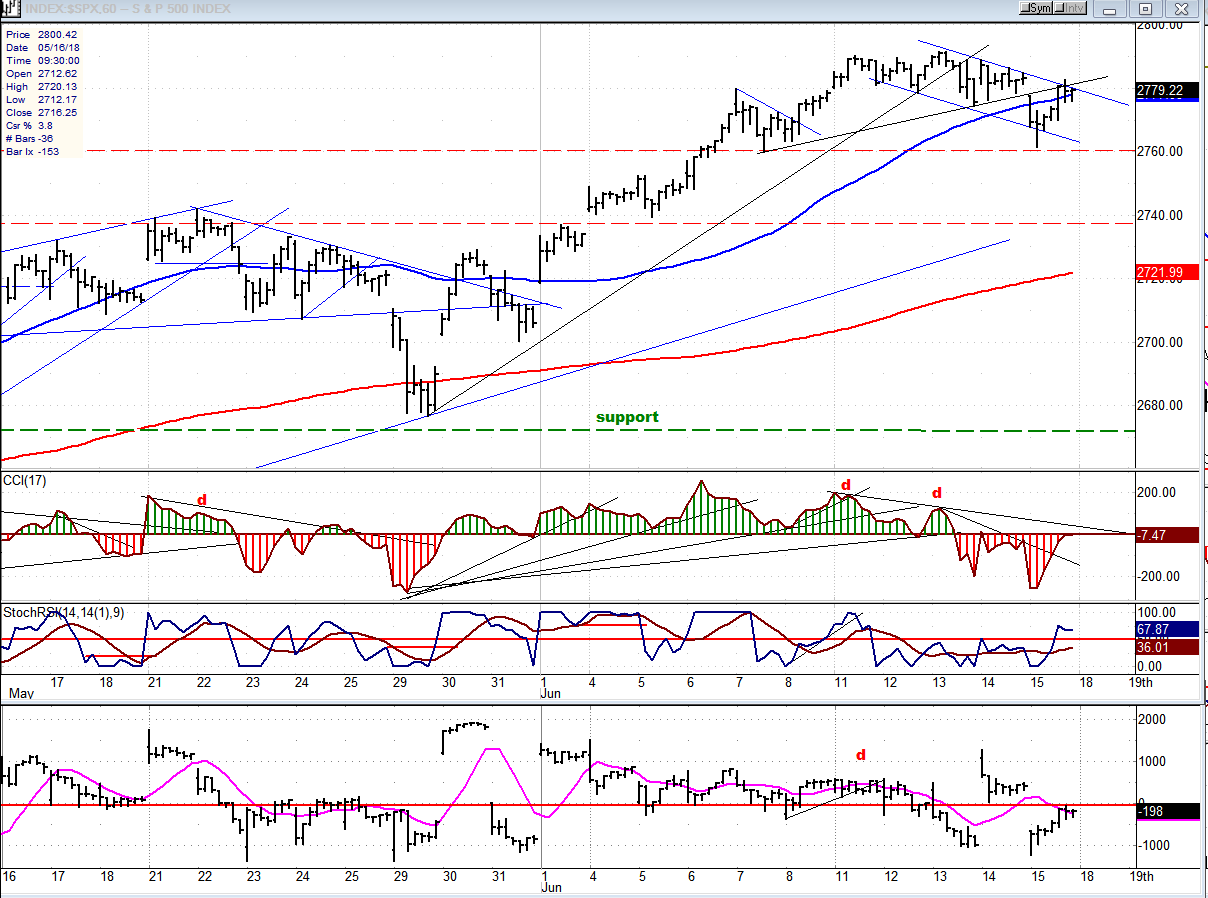
SPX hourly chart
Just glancing at the chart, the amount of congestion contained within the downtrend channel does not look important enough for a complete price correction. Something twice that size would look more proportional. Of course, this is strictly a subjective evaluation. Friday’s rally stopped at the junction of two trend lines. If, on Monday, the index has enough strength to push above them with strength in the A/Ds as well, we could be on our way to the next target forty or sixty points higher.
Friday’s early drop was a reaction to additional tariffs imposed on China. Since China retaliated after the close of the market, it would make sense for the market to be down on Monday as well, which is what we would need to prolong the correction and take prices a little lower -- thereby creating a more satisfactory chart pattern.
As of the close on Friday, the hourly oscillators collectively fell short of giving a buy signal. The middle one did move above its 50% line, but the other two remained below the zero line. This makes them neither bullish nor bearish, and therefore inconclusive!
The more definite signal comes from the P&F chart which, at 2762, had only corrected part of its total potential. This tilts the overall bias toward more correction.
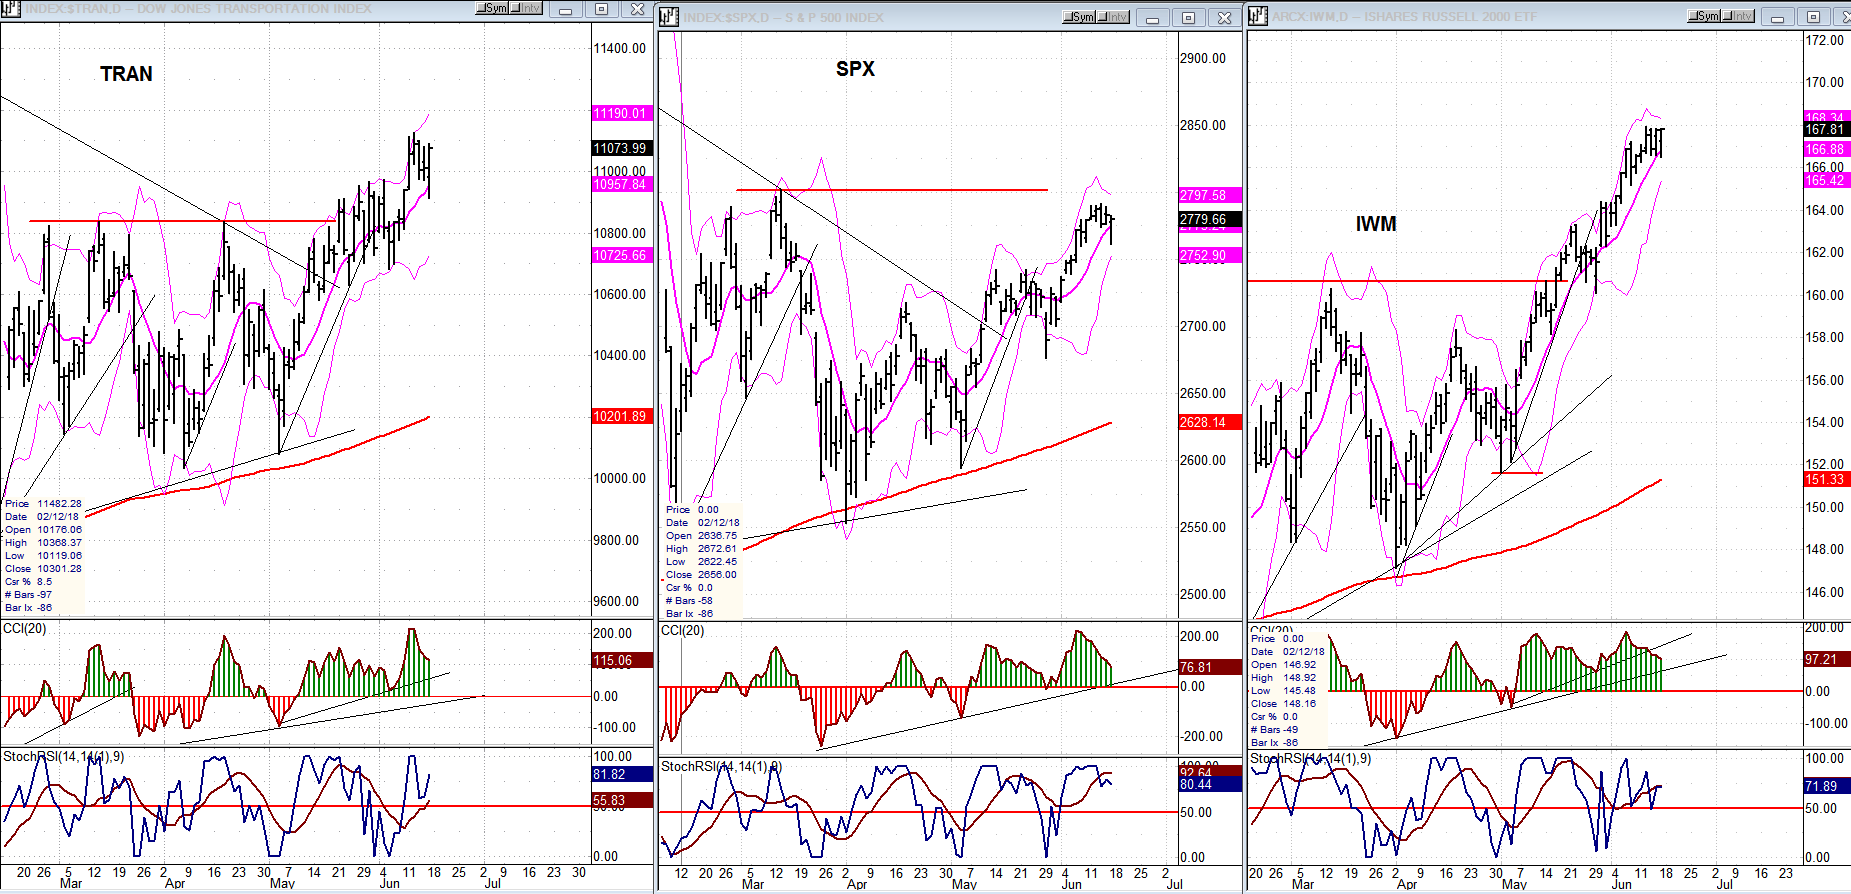
SPX vs TRAN, IWM (daily charts)
It’s pretty clear that the market trend is up. Both leading indexes are outperforming the SPX. When the reverse occurs, we’ll need to start considering that we have arrived at another important top.
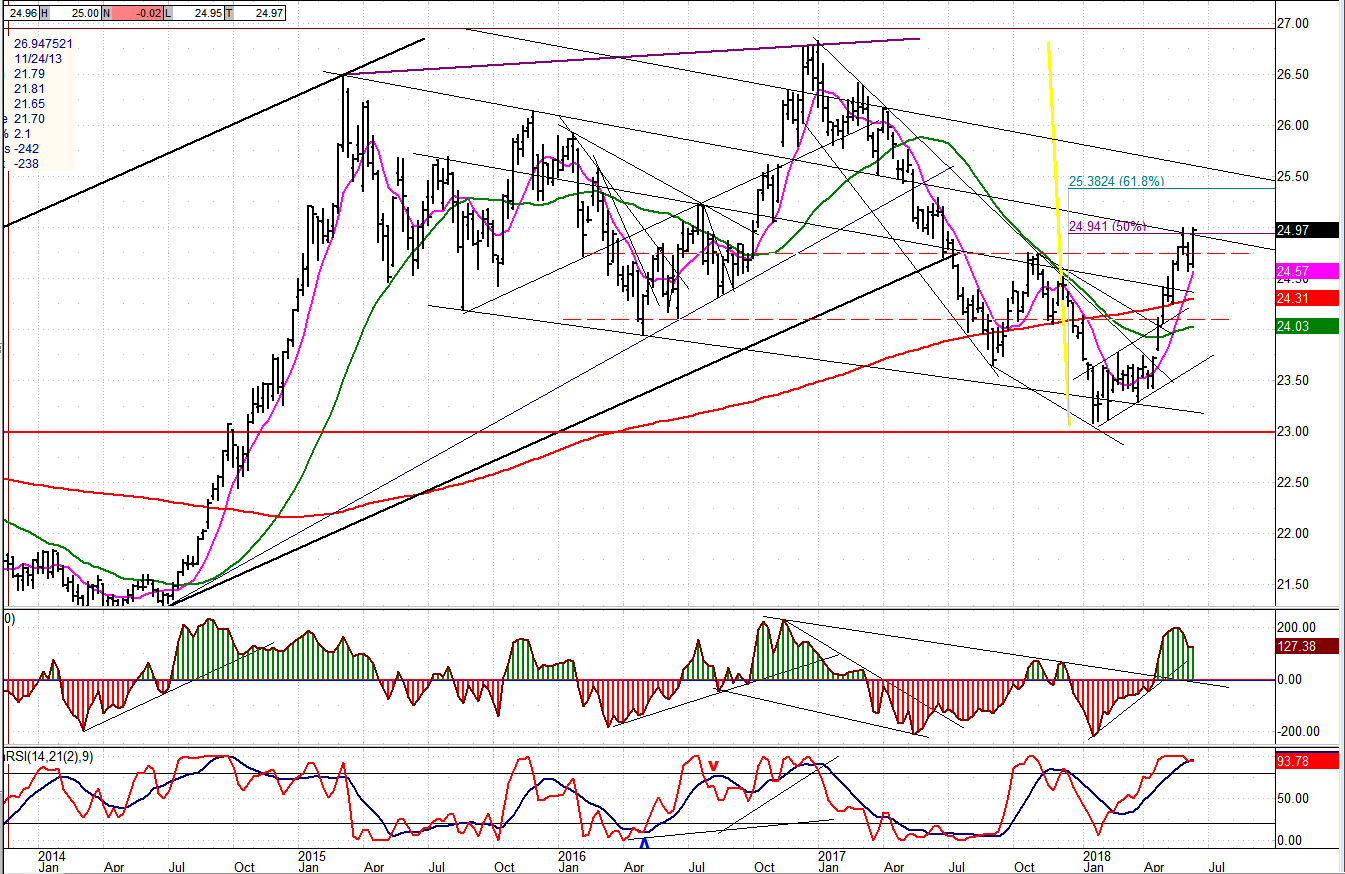
UUP (dollar ETF) Weekly
After a short consolidation, UUP may be extending its uptrend. The weekly chart gives us a better understanding of the index’s position. The initial trend stopped briefly at 50% retracement of the previous downtrend -- a level which coincided with a resistance line. The indicators show no sign of damage having been done to the current bullish trend by the two-week consolidation, so the odds of continuing on an upward path are favorable, perhaps to the .618 retracement level, or even higher. The P&F chart gives it a potential projection to 25.50.
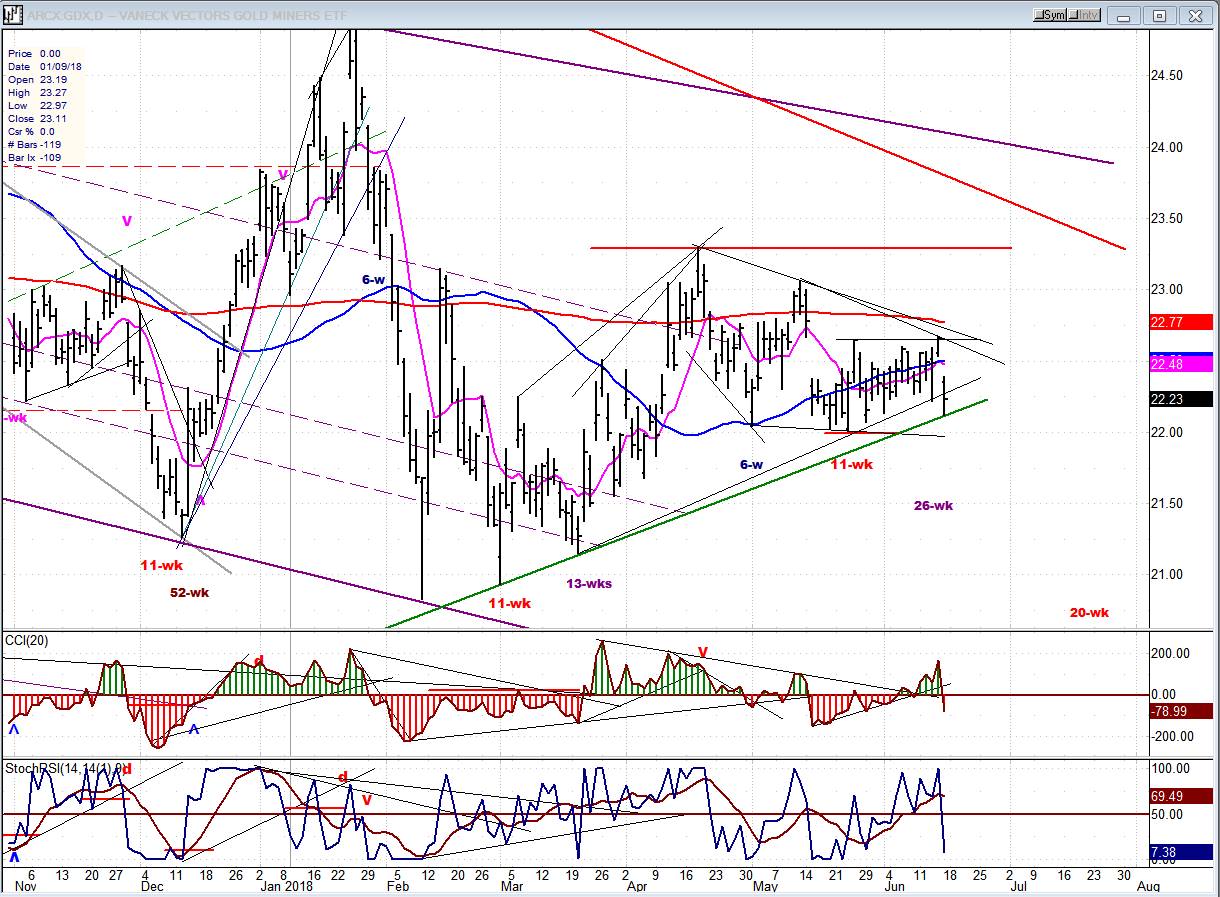
GDX (Gold miners ETF)
UUP’s bullish overtones are ‘stoppers’ for GDX’s attempt at moving higher. Thursday’s short upward thrust may have marked the end of that attempt and the resumption of its consolidation pattern. This all depends on whether UUP continues to move up right away, or consolidates at its current price level for a little longer. It is also possible that GDX’s bearish spike could mark the low of its 26-wk cycle. In any case, another week of data for both indexes will be necessary for a more complete evaluation.
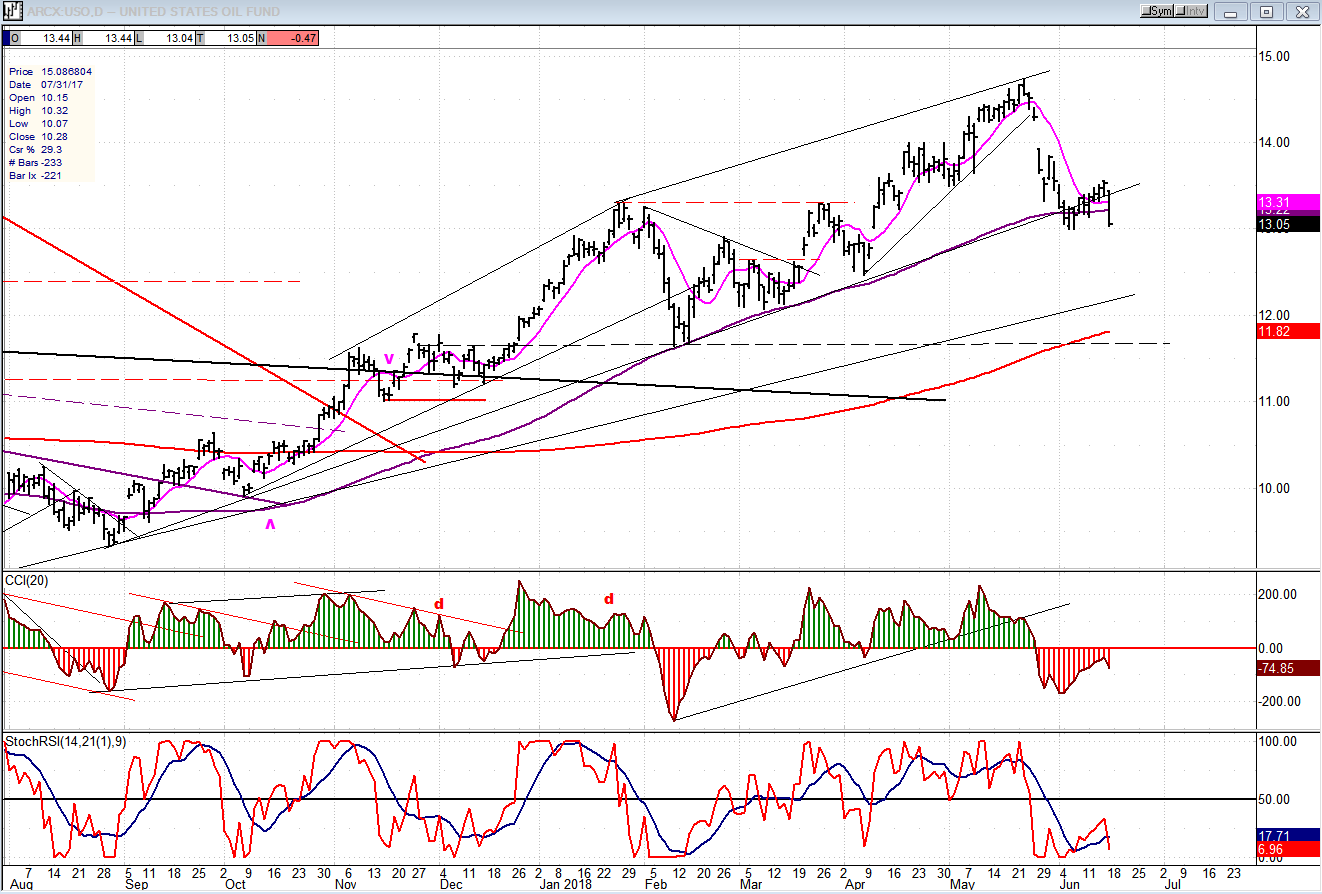
USO (United States Oil Fund)
USO may be extending its correction into a normal a-b-c pattern, with the c-wave getting underway. Let’s give it another week to better determine what it is doing.
Summary
SPX has completed another phase of its intermediate uptrend and is correcting. While it is unlikely that this correction has already ended, if the index trades aggressively above its former high of 2791 early next week, we’ll have to deduce that it is already on its way to its next upside target before a longer and larger correction begins.
*********
FREE TRIAL SUBSCRIPTON
With a trial subscription, you will have access to the same information that is given to paid subscribers, but for a limited time period. I think you will find that knowing how far a move can carry is one of the most useful benefits of this service, whether you are a trader or an investor -- especially when this price target is confirmed by reliable indicators which give advance warning of a market top or bottom. Furthermore, cycle analysis adds the all- important time element to the above price projections.
For a FREE 4-week trial, further subscription options, payment plans, and for general information, I encourage you to visit my website at www.marketurningpoints.com.
The above comments about the financial markets are based purely on what I consider to be sound technical analysis principles. They represent my own opinion and are not meant to be construed as trading or investment advice, but are offered as an analytical point of view which might be of interest to those who follow stock market cycles and technical analysis.

When Andre Gratian was a stock broker years ago, a friend introduced him to technical analysis of the market. Consequently, it is not an exaggeration to say that Andre fell in love with this approach! Ever since then, it has become an increasingly important part of his professional life. Gratian has studied the works of Wyckoff, Edwards & Magee, Edward J. Dewey (cycles) and many others. However, one of my most profitable undertaking has probably been to study Point & Figure charting, which he finds invaluable in analyzing stocks and indices. If he were restricted to one methodology, this is the one that he would choose. This well-rounded background has given him what he feels to be a special insight into the stock market, facilitating the recognition of meaningful patterns and the ‘turning points’ in all trends, whether they be short or long term. Andre feels very comfortable discussing the stock market and passing on meaningful information to others. His subscribers include individuals and money managers throughout the world. Moreover, his Newsletters are currently published on several financial sites, here and abroad.


