Technical Analysis Of The Markets


SPX: Long-term trend: Severe correction underway.
SPX: Intermediate trend – Counter-trend rally!
Analysis of the short-term trend is done on a daily basis with the help of hourly charts. It is an important adjunct to the analysis of daily and weekly charts which discuss longer market trends.
A-B-C CORRECTION UNFOLDING
Market Overview
After the first rally from the 1812 low topped, it was unclear if we had completed the “bear market” rally or if more was to come. The congestion level which SPX produced over the next few days was either accumulation or distribution, but the bias was deemed to be on the downside since the resulting count matched precisely the top P&F projection. For it to be confirmed, however, the September low of 1872 would have to be breached. In spite of a strong attempt to do so after the FOMC statement was released, it held; and a continued oversold rally in oil along with the Japanese move to negative rates finally tipped the odds to an extension of the original rally which is now developing as an A-B-C corrective formation.
Counter-trend rallies are usually very fast and very sharp, as was wave A. Wave C is following the same mode, and by Friday’s close was quickly approaching its projected top. There are, however, two possibilities: Are we correcting the entire decline from 2116, or only that from 2082? It could make a difference of some 15 points. I am currently opting for the lower target because of the count determined by the minor accumulation pattern of the P&F chart, but the market itself will decide over the next few days.
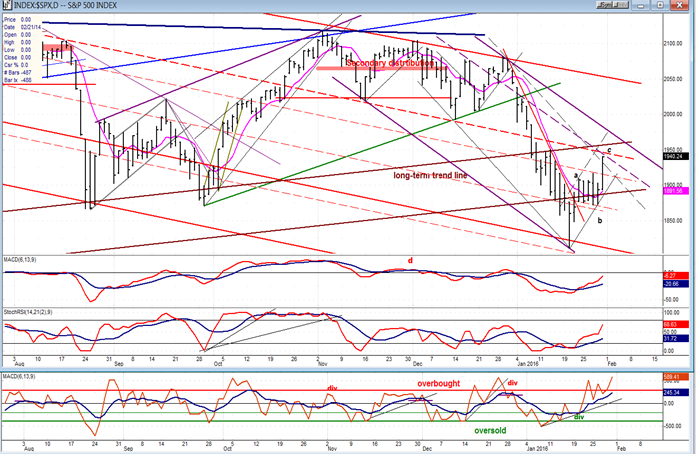
SPX Chart Analysis
Daily Chart (This chart, and others below, are courtesy of QCharts.com.)
It’s probably fair to say that whatever the market is doing, it will not be back in an uptrend until prices rise above the top (red) downtrend line. The channel that has been created with that line as the anchor, seems to be pretty well defining the course of the overall downtrend, for now. It may change over time if the decline becomes steeper, or if a secondary channel becomes manifest -- such as the one which delineates the downtrend from the 2116 secondary high.
Back to the red channel! The red dashed lines on the chart are parallels to the top downtrend line. When connected to important short-term tops or bottoms, they appear to accurately define support and resistance levels when price reaches them. For instance, the second highest heavy red parallel from the bottom provided support for the 1812 low. Now, SPX is approaching the heavy dashed parallel which starts at the July 20 high of 2132 (which was the re-test of the 2135 bull market high) and connects several tops and bottoms along its path. It is very likely that it will offer resistance for the current advance, especially since it coincides with my minimum projection for the C wave. Whether this will turn out to be the high of the counter-trend rally, or whether it goes a little higher to back-test the bottom channel line of the long-term trend from 2009, we’ll have to see. Either one would be a logical place for the uptrend to reverse.
The indicators are still solidly up with no sign of negative divergence, and they will require a few more days to reach a point where they are ready to reverse. I might note that Monday will be the third day of the C wave rally which could find a top at the dashed parallel. If we look at the weekly chart, we find that the coming week will be the third week of the rally. Something to keep in mind!
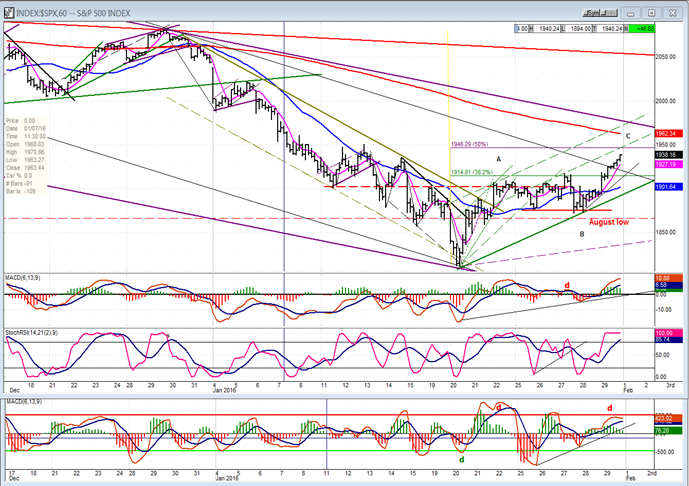
Hourly Chart
The downtrend from 2082 remained in a narrow (light green) channel until the very bottom, and then exited it as wave A indicated that a corrective move was starting. It was expected to rally to the .382 retracement of the decline, and did so on the 27th, then turned sharply down in what appeared to be a resumption of the downtrend. But it could not get past 1872 which was tested twice and held both times. Then came a short period of congestion which appeared to be preparation for another thrust down but instead, on Friday morning, prices surged at the opening on news that Japan had gone to negative interest rates, and after a brief halt at the former top, the index continued to rally for the rest of the day.
The purple channel is similar to the one shown on the daily chart. Prices are not expected to move out of it on this attempt, but will at some point. This would be typical of a major trend modifying its angle of descent as the decline progresses. Also, when the next down-phase takes place, it’s unlikely that they will reach the bottom line of the red channel before reversing. This is already pre-determined by the count for the next intermediate low.
So where does the rally stop? The 50% retracement level which is just a few points higher is a good target for an initial reversal point and, if more is required, the (red) 200-hr MA which is currently at 1962 would be another. Both levels coincide with a conservative and liberal count taken on the 3X P&F chart formation.
The bottom (A/D) indicator is showing negative divergence and is ready to turn down. The SRSI is overbought and could also start to retrace, but the MACD is still strong and may require an initial top and a subsequent high creating divergence before it gives a sell signal. Looking at the price action from the low, it is clearly corrective and not impulsive, and we could end up with a C wave which approximates the A wave in length. That would place its high just about where the 200-hr MA is currently trading.
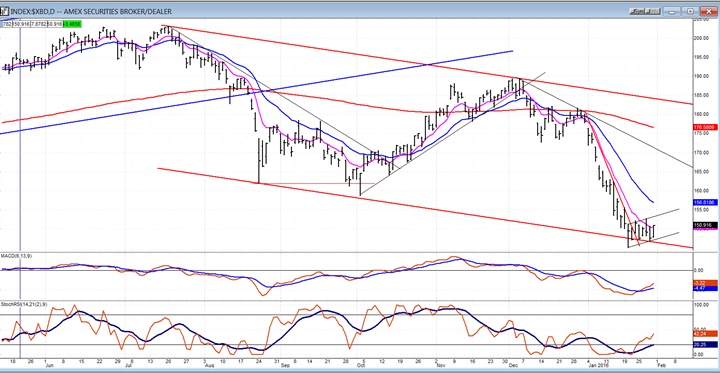
XBD (American Securities Broker/Dealer)
We’ll continue to look at XBD to see there is any strength showing which could indicate that the market is ready to do something more than merely stage a “bear market” rally. No such sign is evident! On the contrary, XBD must rank as one of the weakest indexes on the board. Not only did it fall much farther than SPX below its August low, reaching the bottom of its primary channel, but look at the pitiful bounce which it has only been able to produce in the past couple of weeks.
I had mentioned some time ago that XBD and XLF (both considered market leaders by some analysts) had made their all-time highs in 2007 and had remained substantially under that high during this bull market. In the case of XBD, its high in June 2007 was 268. Its high point for the current bull market was on July 20 of last year and only registered 203. Surely the long-term relative weakness of these two important indexes were telling us something about what lay ahead. Was it simply a technical warning? Or, something about the state of the economy? I’ll let others answer that question. Our concern is the current relative weakness of the index and what it means for the market condition going forward.
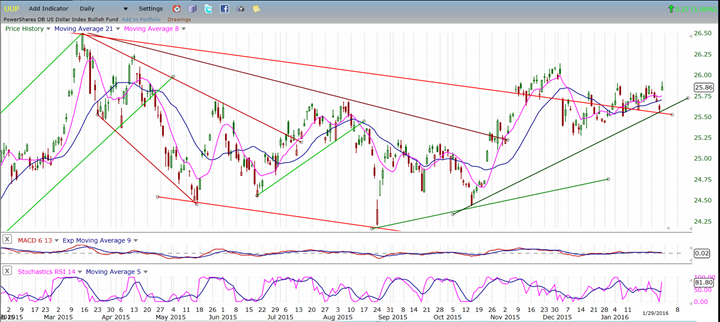
UUP (Dollar ETF)
The dollar got a boost from the move by the Bank of Japan which caused the Japanese yen to depreciate appreciably in value. But will it be enough to kick-start the US$ into a long overdue resumption of its uptrend? To show that this is a sincere attempt at challenging its previous high, it will have to show more upside momentum than a single day’s rally. Since the index has a higher P&F projection, it’s probably only a matter of time before it does resume its uptrend in order to reach it.
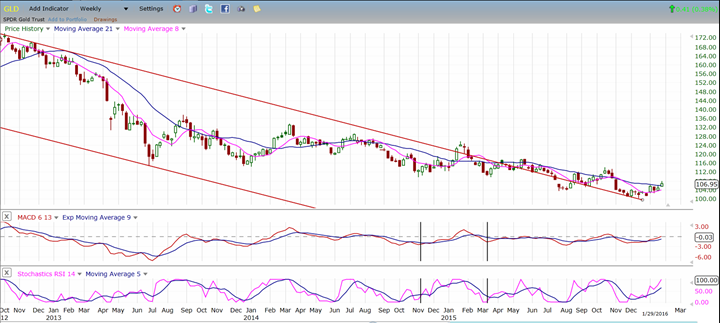
GLD (Gold Trust)
GLD’s long-term decline shows that it is slowly coming out of its major corrective channel, but all its attempts at re-establishing an uptrend have been feeble and it continues to make lower highs and lower lows. Whether the current effort will succeed or not depends on its ability to extend its current move. Cycles are favorable and it has built enough of a base to take it to about 111, at best! So the answer is probably ’not this time’, even if it does achieve its full short-term potential. The gold bugs will have to endure more patience before something worthwhile develops. Maybe on the next attempt!
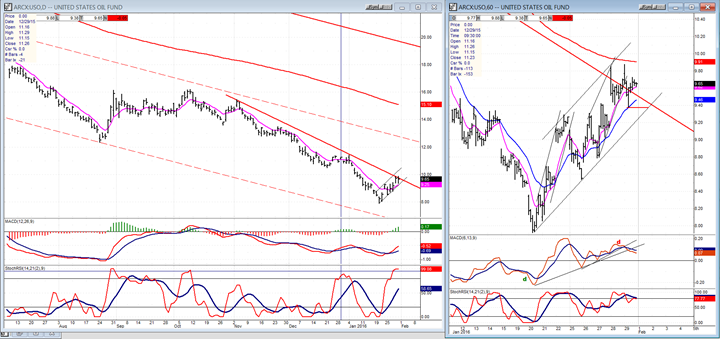
USO (United States Oil Fund)
Because the price action in oil is currently having such an influence on the market, I have posted a daily and hourly chart of USO below so that we can see if it, too, like GLD, is making a sincere effort to resume an uptrend after reaching my long-term projection of 8. However, after such a severe and protracted downtrend, we should not expect anything significant to happen anytime soon. In the past two weeks, USO has bounced up to its intermediate trend line which it is attempting to overcome. Even if it does, it will quickly face another resistance point created by its 200-hr MA which was probably already responsible for stopping the advance twice, and creating a double top. Finding a top at this level should help SPX to find one as well.
The hourly indicators also show that its upside momentum is waning and that negative divergence has appeared in the MACD. That could mean that a reversal is not too far away. The daily SRSI is still showing strength and, along with the MACD, is still in a bullish cross position. However, the MACD remains well below the zero line and this is a sign that USO is probably a long way from showing lasting strength. At best, even if its low has been reached, we should expect it to spend time forming a base which, when complete, will give us an idea of how much of its 111-point decline from the 2008 top it will be able to retrace.
Summary
It is now evident that SPX500 has altered its correction to an A-B-C pattern with the C wave currently in progress.
Expectations are that the index should complete its upward correction over the next few days -- probably next week.
A reversal may or may not result in an immediate resumption of the long-term downtrend. Strong support at the 1872 level may require a certain amount of distribution to form above it before it can decline further.
********
FREE TRIAL SUBSCRIPTON
Market Turning Points is an uncommonly dependable, reasonably priced service providing intra-day market updates, a daily Market Summary, and detailed weekend reports. It is ideally suited to traders, but it can also be valuable to investors since highly accurate longer-term price projections are provided using Point & Figure analysis and Fibonacci projections. Best-time reversal estimates are obtained from cycle analysis.
For a FREE 4-week trial, send an email to: [email protected]
For further subscription options, payment plans, weekly newsletters, and for general information, I encourage you to visit my website at www.marketurningpoints.com. By clicking on "Free Newsletter" you can get a preview of the latest newsletter which is normally posted on Sunday afternoon (unless it happens to be a 3-day weekend in which case it could be posted on Monday).
The above comments and those made in the daily updates and the Market Summary about the financial markets are based purely on what I consider to be sound technical analysis principles. They represent my own opinion and are not meant to be construed as trading or investment advice, but are offered as an analytical point f view which might be of interest to those who follow stock market cycles and technical analysis.

When Andre Gratian was a stock broker years ago, a friend introduced him to technical analysis of the market. Consequently, it is not an exaggeration to say that Andre fell in love with this approach! Ever since then, it has become an increasingly important part of his professional life. Gratian has studied the works of Wyckoff, Edwards & Magee, Edward J. Dewey (cycles) and many others. However, one of my most profitable undertaking has probably been to study Point & Figure charting, which he finds invaluable in analyzing stocks and indices. If he were restricted to one methodology, this is the one that he would choose. This well-rounded background has given him what he feels to be a special insight into the stock market, facilitating the recognition of meaningful patterns and the ‘turning points’ in all trends, whether they be short or long term. Andre feels very comfortable discussing the stock market and passing on meaningful information to others. His subscribers include individuals and money managers throughout the world. Moreover, his Newsletters are currently published on several financial sites, here and abroad.


