Technical Analysis Of The Markets


Current Position of the Market
SPX: Long-term trend – The bull market is continuing with a top expected in the low 3000s.
Intermediate trend – Decision time
Analysis of the short-term trend is done on a daily basis with the help of hourly charts. It is an important adjunct to the analysis of daily and weekly charts which discusses the course of longer market trends.
Next Week Is Key
Market Overview
Last week, I expressed some concern that, since the China/USA trade talks did not get anywhere, Trump’s promise to implement another $200 billion of tariffs could be activated early in September. The imposition of tariffs has not been well received by the market in the past, and there is no reason why it should be different, this time. Early in the week, SPX did not seem to be concerned by this matter and it tacked on another 40 points to the rally that started at 2800. However, by Thursday, as rumors re-surfaced that this action could take place as early as next week, a correction started which caused the index to lose a third of its weekly gain (although some of this was recovered by Friday’s close).
From a pure technical standpoint, no damage has yet been inflicted by this correction since the index observed a support level in the low 1890s. However, a sizeable congestion pattern has now been created and, if broken, it could allow the index to drop another sixty points. On the other hand, if nothing happens next week, the market can go on to fulfill a higher near-term objective toward 1960.
NDX showed some good strength as it rose to another all-time high. DJIA and IWM also made new all-time highs, but they were sluggish compared to the other two.
Chart analysis (The charts that are shown below are courtesy of QCharts)
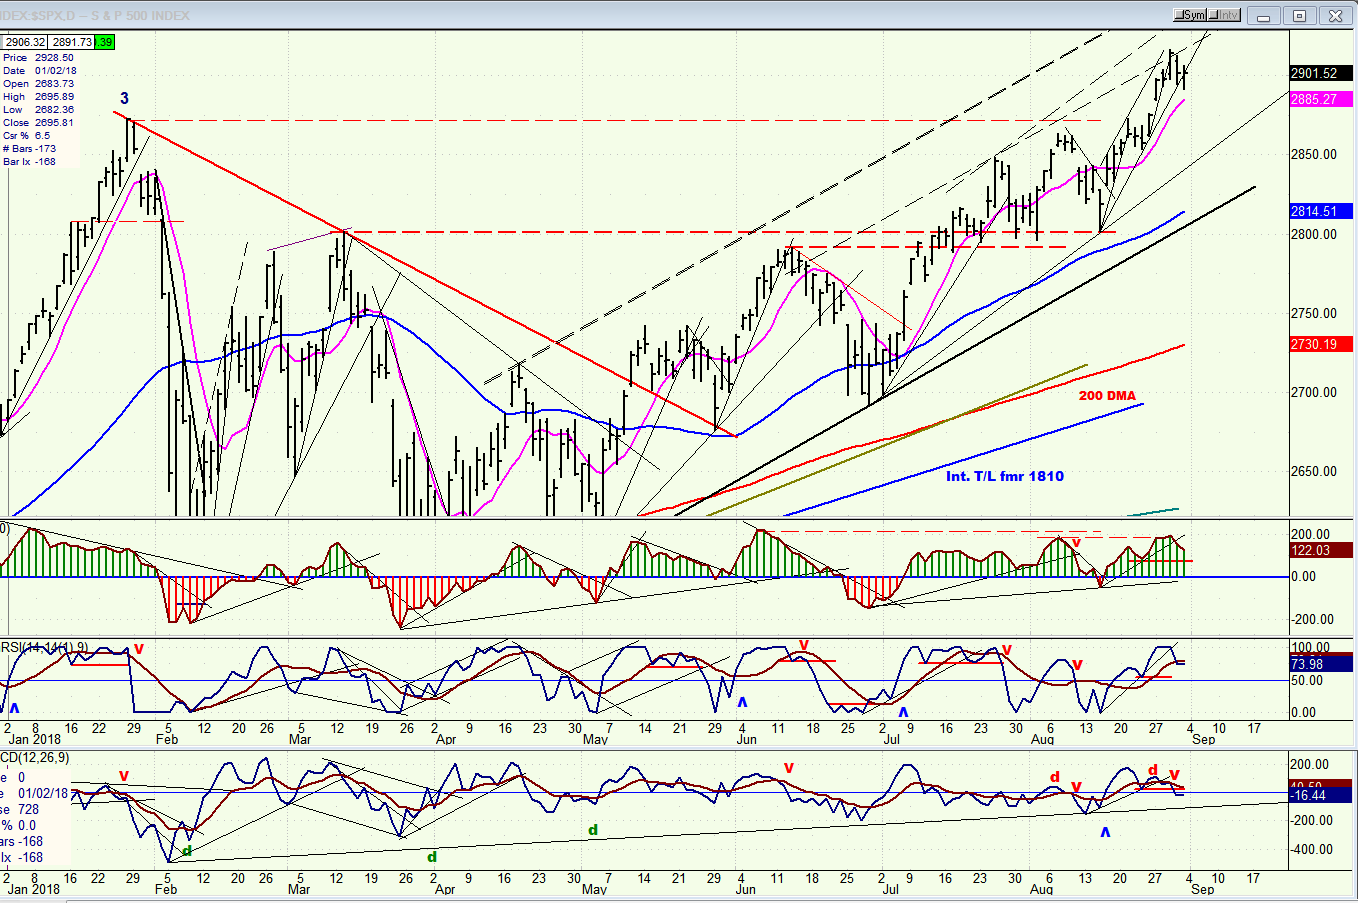
SPX daily chart
After barely poking its head above the former high, SPX accelerated over the past week until it filled an interim projection and pulled back into Friday. The retracement only exceeded the 2393 support by a couple of points, and the index made a good recovery at the close.
So far, everything looks normal with a strong move from the 2800 level and no sign of weakness in price or in the indicators, yet. The structural pattern suggests that another phase could take the market higher before a larger correction takes place, and there is an earlier P&F projection to support this move, but that will depend on what happens next week. Technically, the index ended the week in a neutral position for the short-term. A move higher next week would continue the bullish pattern while a drop below 2890 would result in an extension of the correction.
On Friday, there were some rumblings that previously discussed additional massive tariffs could be implemented as early as next week. If this materializes, it will create a problem for the market which has always reacted negatively and sharply to this kind of news. And since we are approaching a time of the year which favors market weakness, this might be the catalyst which starts a correction that could last into October. While a continuation of the uptrend to complete one more phase would be preferable, especially considering the P&F pattern, I would have to adjust my analysis to a continuation of the corrective move which started from 2916.
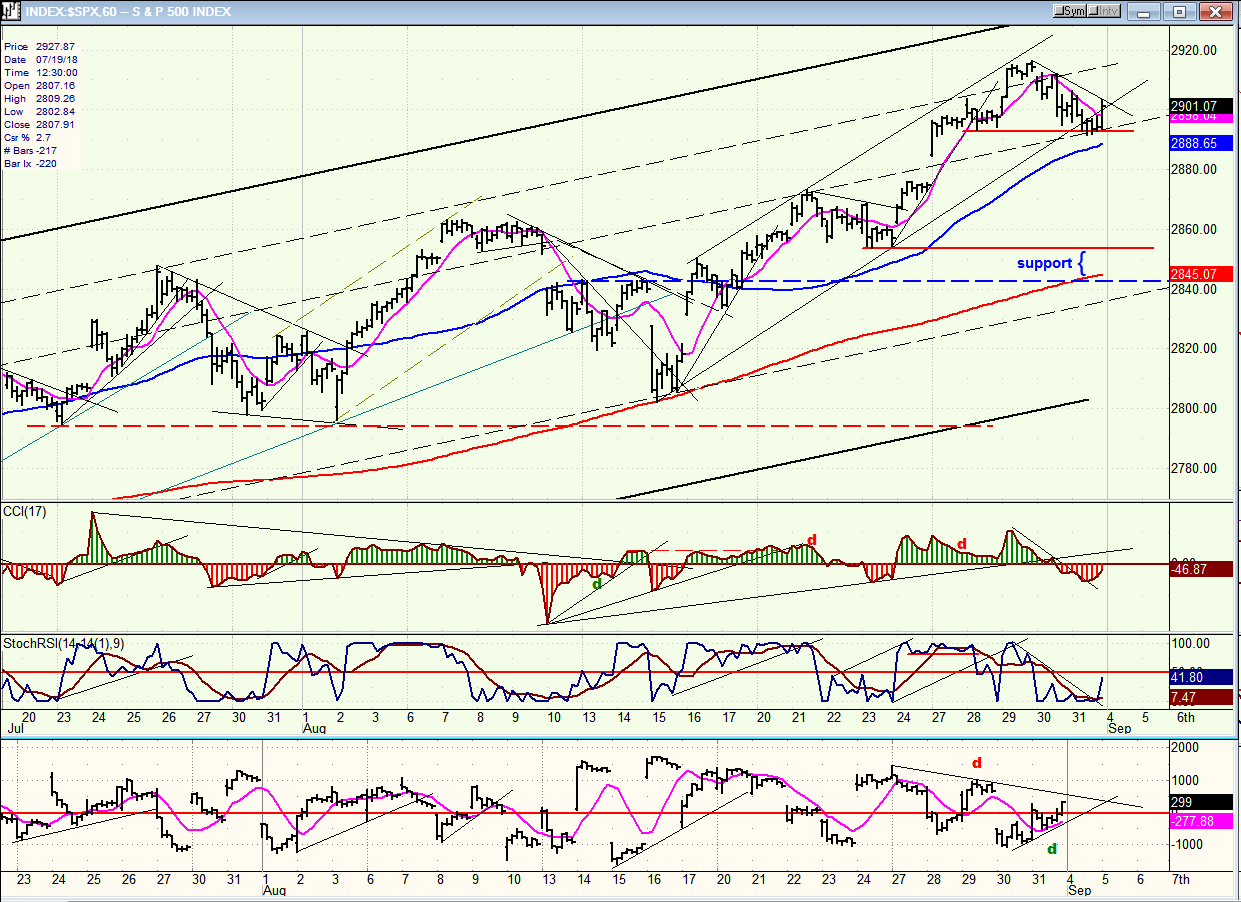
SPX hourly chart
Looking at the hourly chart, it’s easy to see that SPX is facing a dilemma next week. Although it held its support level and had a decent rally at the close, it was not enough to turn the price oscillators positive. It did turn the A/Ds indicator, but that one is more volatile than the others and its lead must be followed by them.
As mentioned earlier, Friday’s correction has created enough congestion on the P&F chart to allow for a ~60-point drop if 2888 does not hold. That would bring it to the level of the next lower support level which should contain that down-phase, and place us in the position of resuming the uptrend; unless, of course, this is the beginning of the seasonal decline which stretches into October. Since this is not something that we can possibly foresee at this time, we’ll just have to take it one step at a time and see what happens.
What we can say with certainty is that a move to 3,000 or more is still in the cards before we can look for an end to the bull market. This would come into question only if SPX were to decline below its intermediate trend line from 1810 (currently about 2700).
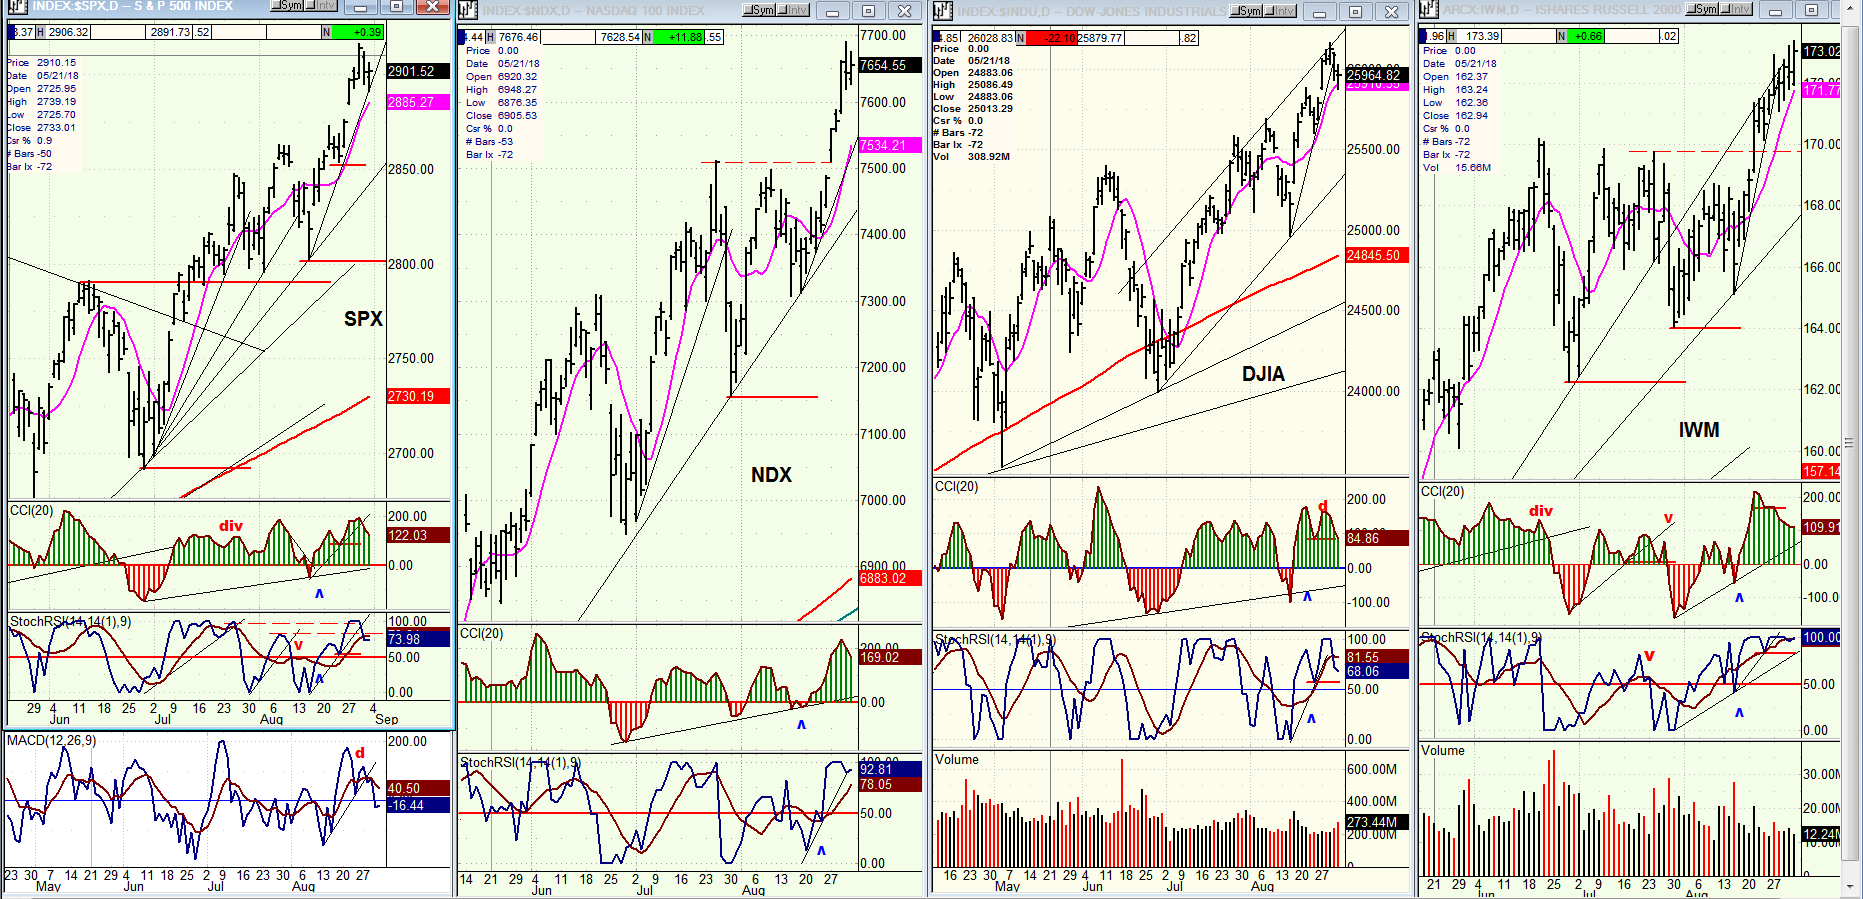
SPX, NDX, IWM (daily)
At first glance, all four market indexes look as if they are progressing upward at the same rate. On closer inspection, the NDX has vaulted to new highs in practically a straight line, influencing the SPX and causing it to be the second strongest-looking index. DJIA is showing deceleration in the second leg of its rally from the 25,000 level and this is reflected in the oscillator which is showing some mild negative divergence. As for IWM, ever since its break-out to a new high, it has continued to advance in a reluctant crawl, but which did make a new high on Friday. Does this have any forecasting value, or is it simply due to the diversity of their components? We’ll find out next week! I should point out, however, that the A/D indicator of the SPX has turned slightly negative, which provides a contrast with the price oscillators.
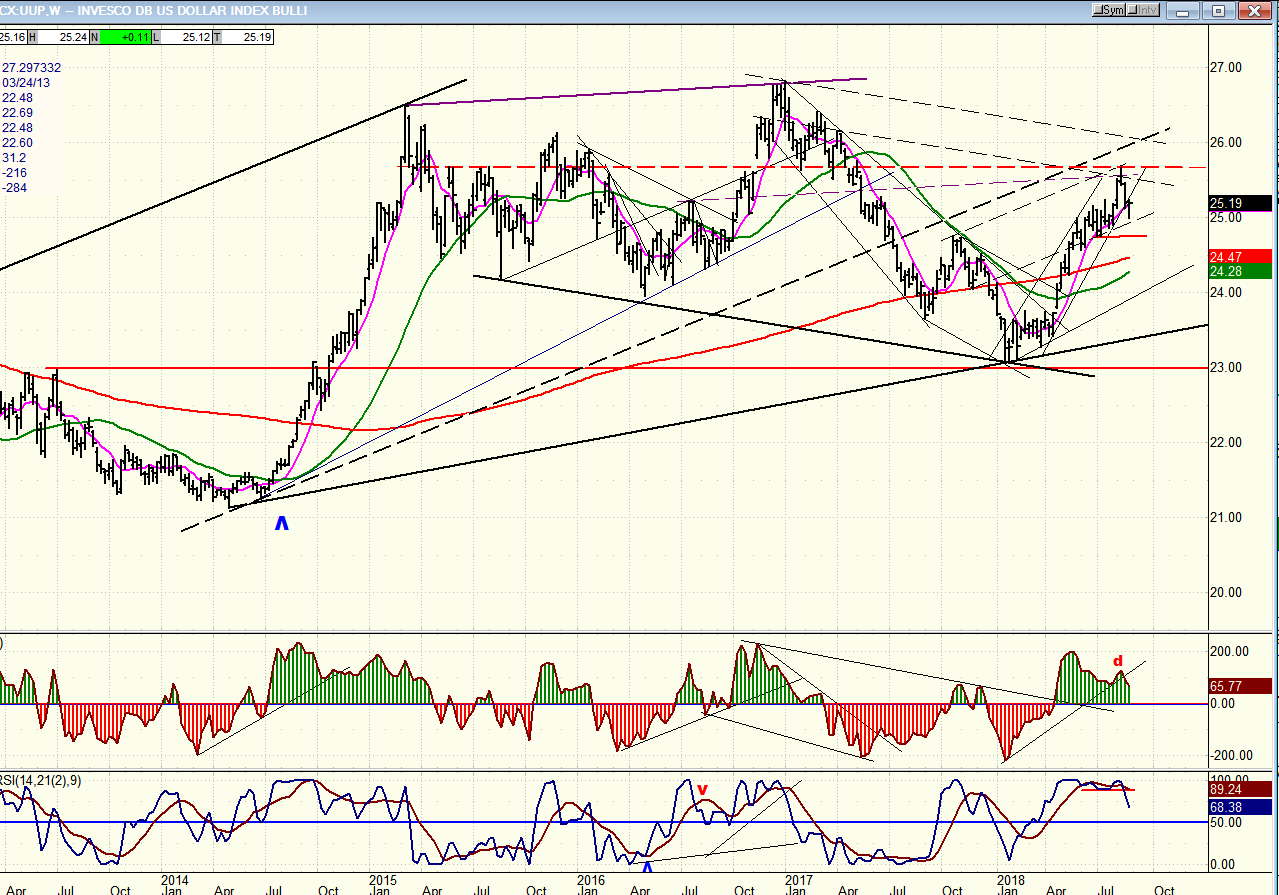
UUP (dollar ETF) weekly
UUP has run into resistance in the middle of ovehead congestion after it met the count produced by the base created between 23-24 and which has now been totally exhausted. Its only recourse would be to continue producing more of a base above 23.00 if it wants to move higher. It’s a very slow moving stock and this would take some time. It does have an option of retesting the recent high in the near future, especially if Trump makes good on his promise to impose more tariffs on China.
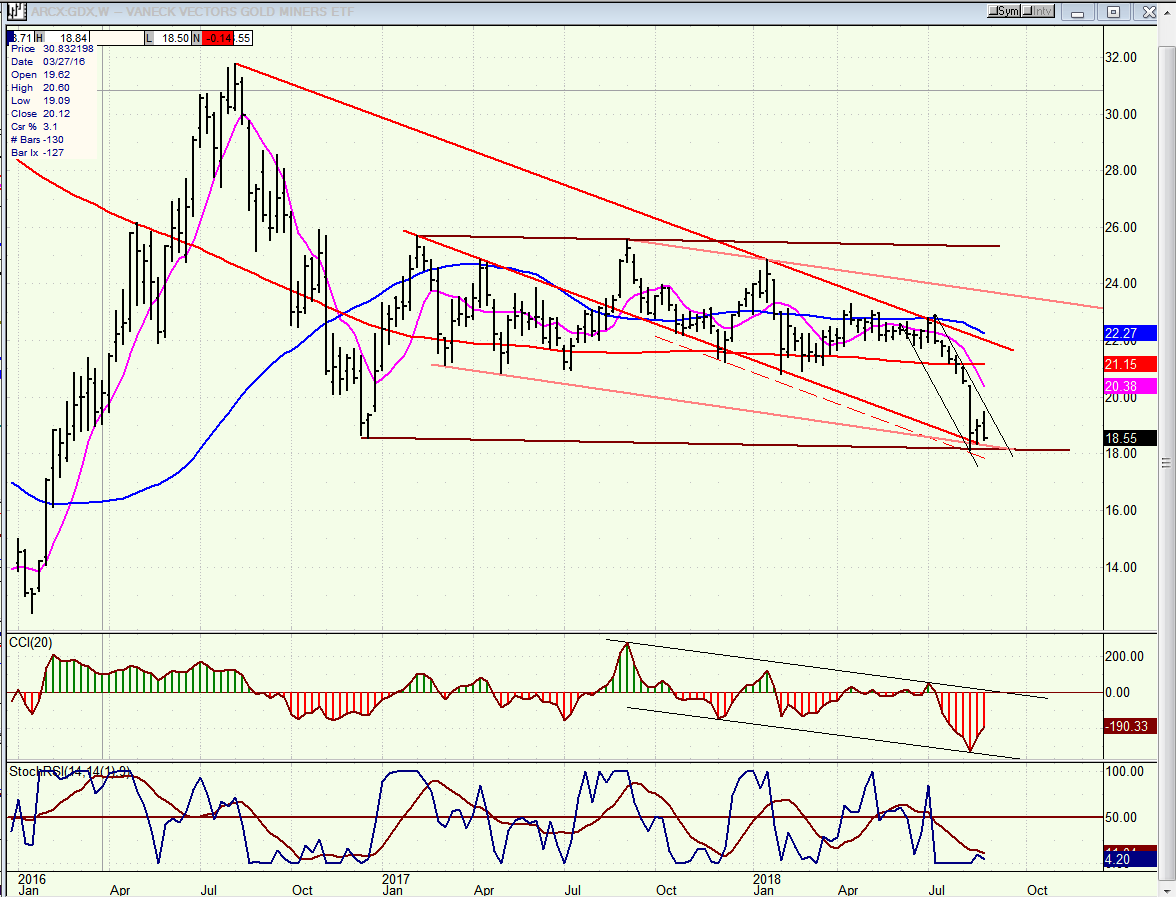
GDX (Gold miners ETF) weekly
The weekly chart of GDX shows why it could stop its decline in this area. There are several trend line reasons for it. 18.50 is also a good count from the previous congestion level, although, there is a remote possibility that it could reach 17-17.5 before reversing.
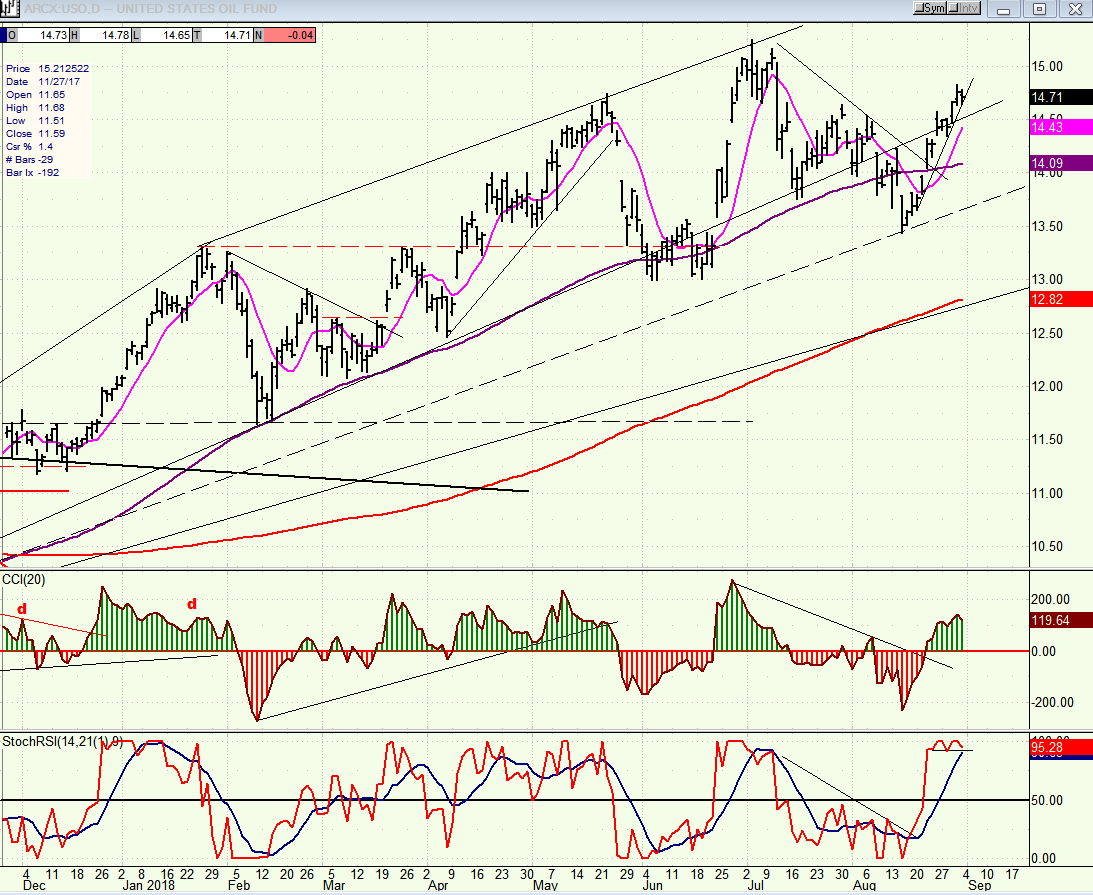
USO (United States Oil Fund)
USO corrected down to its lower channel line and bounced, but looks vulnerable to extending its correction to a lower trend line which is currently running at the level of its 200-DMA.
Summary
SPX has worked its way to a short-term decision point which could delay the next correction with a move to the 2955-60 level, or choose to start it right away with a decline to about 2850. This should be resolved next week.
FREE TRIAL SUBSCRIPTON
With a trial subscription, you will have access to the same information that is given to paid subscribers, but for a limited time period. I think you will find that knowing how far a move can carry is one of the most useful benefits of this service, whether you are a trader or an investor -- especially when this price target is confirmed by reliable indicators which give advance warning of a market top or bottom. Furthermore, cycle analysis adds the all- important time element to the above price projections.
For a FREE 4-week trial, further subscription options, payment plans, and for general information, I encourage you to visit my website at www.marketurningpoints.com.
The above comments about the financial markets are based purely on what I consider to be sound technical analysis principles. They
represent my own opinion and are not meant to be construed as trading or investment advice, but are offered as an analytical point of view
which might be of interest to those who follow stock market cycles and technical analysis.

When Andre Gratian was a stock broker years ago, a friend introduced him to technical analysis of the market. Consequently, it is not an exaggeration to say that Andre fell in love with this approach! Ever since then, it has become an increasingly important part of his professional life. Gratian has studied the works of Wyckoff, Edwards & Magee, Edward J. Dewey (cycles) and many others. However, one of my most profitable undertaking has probably been to study Point & Figure charting, which he finds invaluable in analyzing stocks and indices. If he were restricted to one methodology, this is the one that he would choose. This well-rounded background has given him what he feels to be a special insight into the stock market, facilitating the recognition of meaningful patterns and the ‘turning points’ in all trends, whether they be short or long term. Andre feels very comfortable discussing the stock market and passing on meaningful information to others. His subscribers include individuals and money managers throughout the world. Moreover, his Newsletters are currently published on several financial sites, here and abroad.


