Technical Analysis Of The Markets


Current Position of the Market
SPX: Long-term trend – Bear market
Intermediate-trend – Approaching initial low (1585-1600).
Analysis of the short-term trend is done on a daily basis with the help of hourly charts. It is an important adjunct to the analysis of daily and weekly charts which discusses the course of longer market trends.
Approaching Intermediate Low
Market Overview
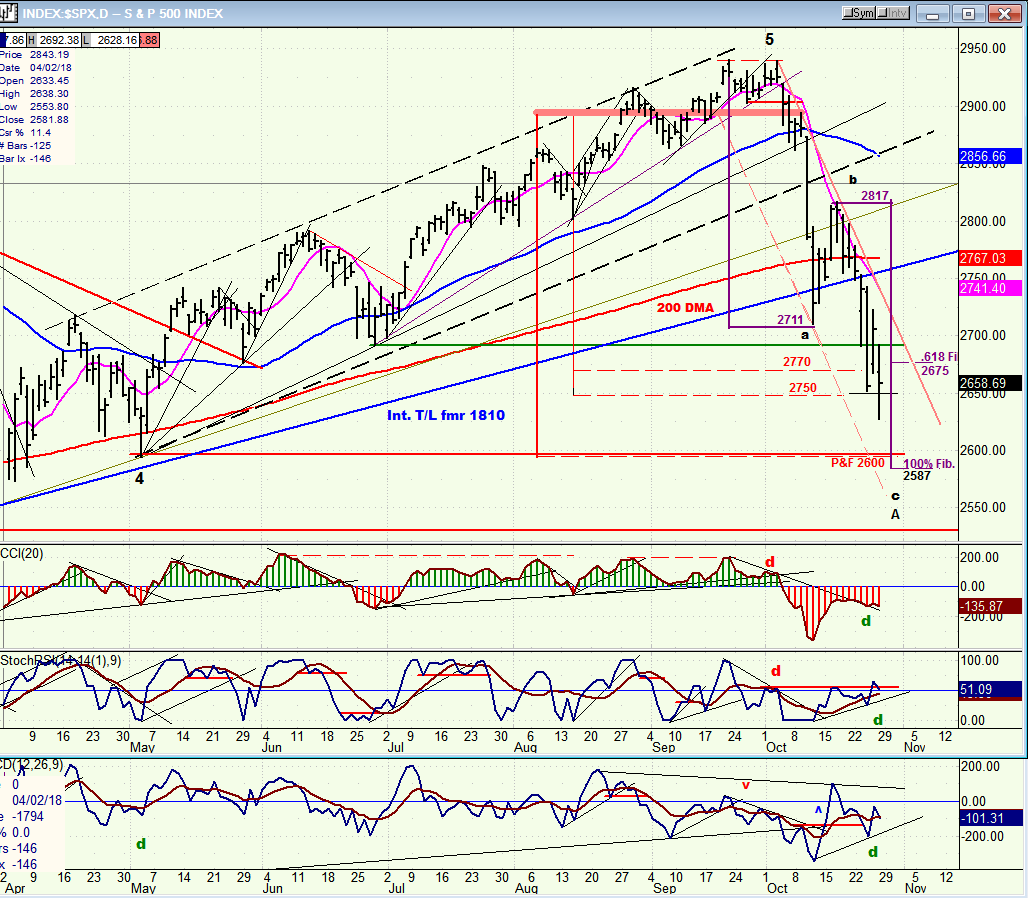
The first wave of this correction started at 2941 and stopped at 2710, for a decline of 231 points. After a brief rally to 2817, the second wave started. At the time, I suggested that the trend could be taking the shape of an a-b-c pattern, which is the normal for a correction. In this case, there are two possibilities for the second wave. It can either stop after reaching .618 of the first wave, or continue to its full extent. Since the decline has already gone past 2675 (.618 retracement) , it is becoming increasingly likely that the initial low of the bear market will occur at about 2600.
This past week, SPX made a low of 2629 before it rallied and, at the rate of the current decline, we could be finished by next week. The increasing price volatility is typical of a market which is looking for a low. On the P&F chart, this causes the base-building pattern which is typical of low points whereby selling and buying reaches a point of equilibrium before the start of an uptrend in the opposite direction. This base will also give us a clue as to the extent of the next rally, but since we know that a typical retracement measures .50 to .618 of the previous decline, we can already have an idea of what kind of rebound is ahead. Assuming that the second wave measures 100% of the first, the low should come at about 2586. After a reversal has taken place, you can estimate what to expect from the countertrend rally based on Fib calculations. This will be substantiated by the count across the P&F base count.
Chart Analysis (The charts that are shown below are courtesy of QCharts)
SPX Daily Chart
The downtrend, which is now in its c-leg, has now gone beyond the potential Fibonacci projection of 2675, which would have been a .618 extension of the a-leg of 231 points. Note that this was also a possible P&F target based on the most logical top distribution count. Now that we have dropped lower, the potential target for the end of the c-wave is about 2600-2587. That level is also very close to the 2594 wave 4 low of the uptrend (1810-2941) which we are now correcting. Even if it were not for the P&F and Fibonacci numbers which surround it, that would be the next logical support level. This is why, if you are looking for the low of the current decline, this is as good a level as any to be expecting a reversal.
Friday’s unusually high level of price volatility in the index is a sign that we are approaching the end of the decline. On that day alone, there were enough 10-point reversals to start a base which is already capable of supporting a 100- point rally. In addition, the bottom of the chart oscillators have been showing positive divergence for the last two weeks and the lowest two are already in an uptrend. This has to be an obvious warning that the decline is about to morph into an uptrend, possibly as early as next week, so be on your toes!
What kind of a rally can we expect for the coming uptrend? A .50 to .618 retracement of the complete decline.
SPX Hourly Chart
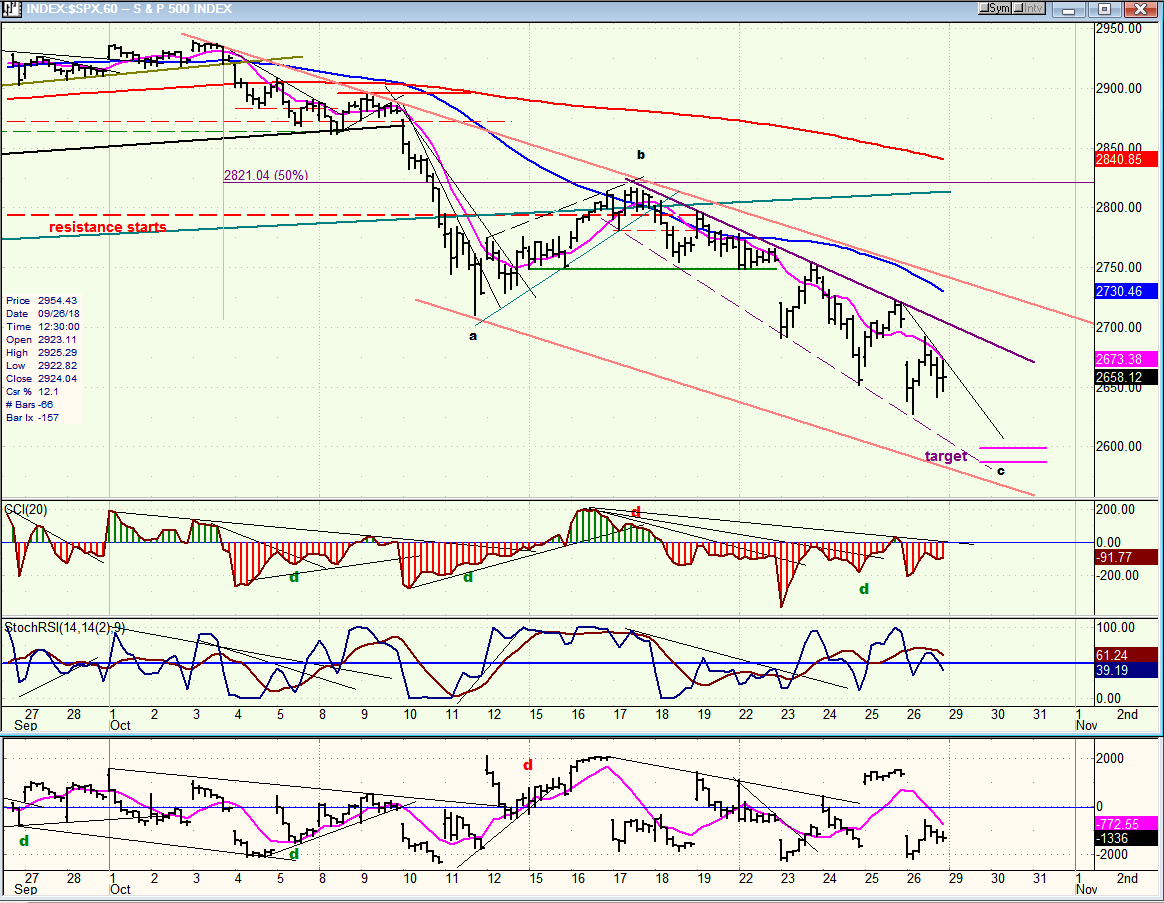
There is a sharp contrast between the trading pattern of the a and c-waves of the SPX index, and it shows up best on the hourly chart. The first down-phase, especially the second portion, was a narrow, continuous decline to point “a”. By contrast, in the second phase, the amplitude of each minor rally and decline within the main trend is much wider, and increasingly so, as it goes lower, resulting in higher and higher price volatility. The net result is that the “c” wave is evolving as a reverse diagonal formation with the price closely adhering to both upper and lower trend lines. If this continues until the very end of the c-wave, it would be reasonable to expect another rally to the top trend line before a plunge to the final low. Whether or not this is what comes next, we’ll have to see! The market is famous for doing exactly what we do not expect, and it’s entirely possible that all our calculations about where the final low should come will be for naught! However, there is so much precedent for the market performing precisely in this manner that it should not be ignored. Instead of rallying to the top trend line we could deviate from the current pattern by continuing the decline which started about mid-day on Friday. This would deceive those who expect another re-bound to the top trend line.
The last minor low created some positive divergence and it was followed by a bounce. The current reading does not show divergence. This could mean that the decline which started on Friday needs another leg down.
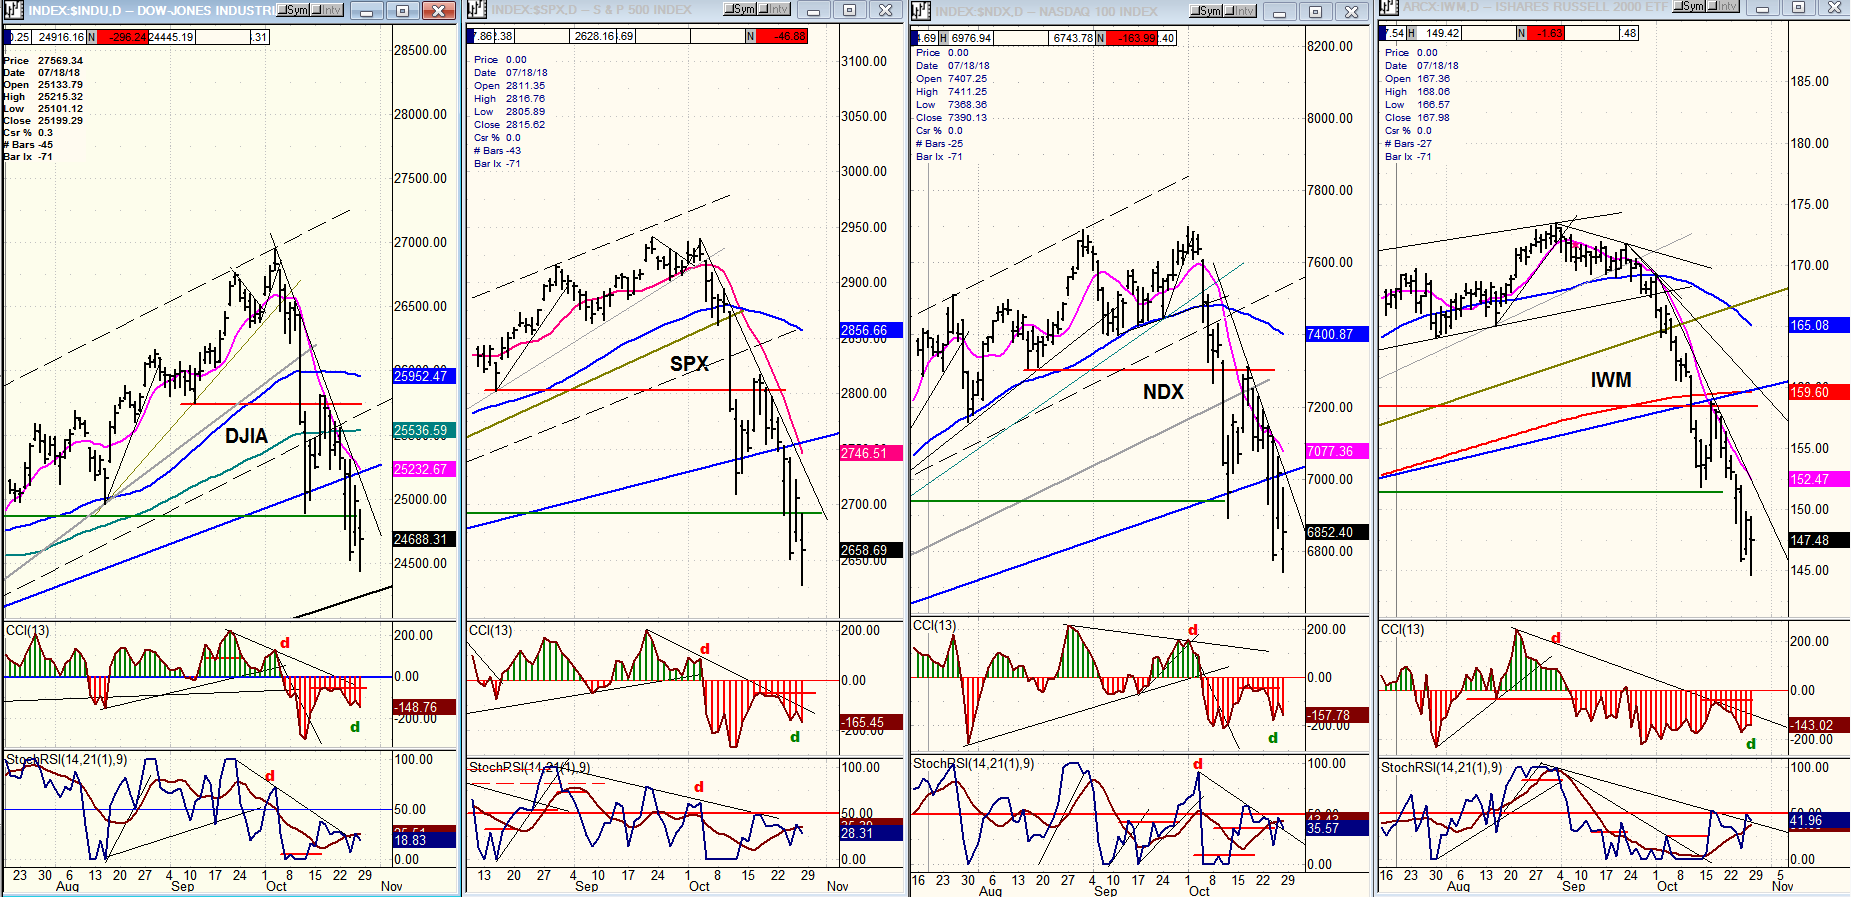
DJIA, SPX, NDX, IWM (daily)
Now, all four indices have broken their intermediate (blue) trend line, leaving no doubt that we have started a major correction. DJIA remains the strongest, but IWM apears to be falling in line with the others instead of being the weakest. That too, could mean that we are aproaching a low point in this downtrend.
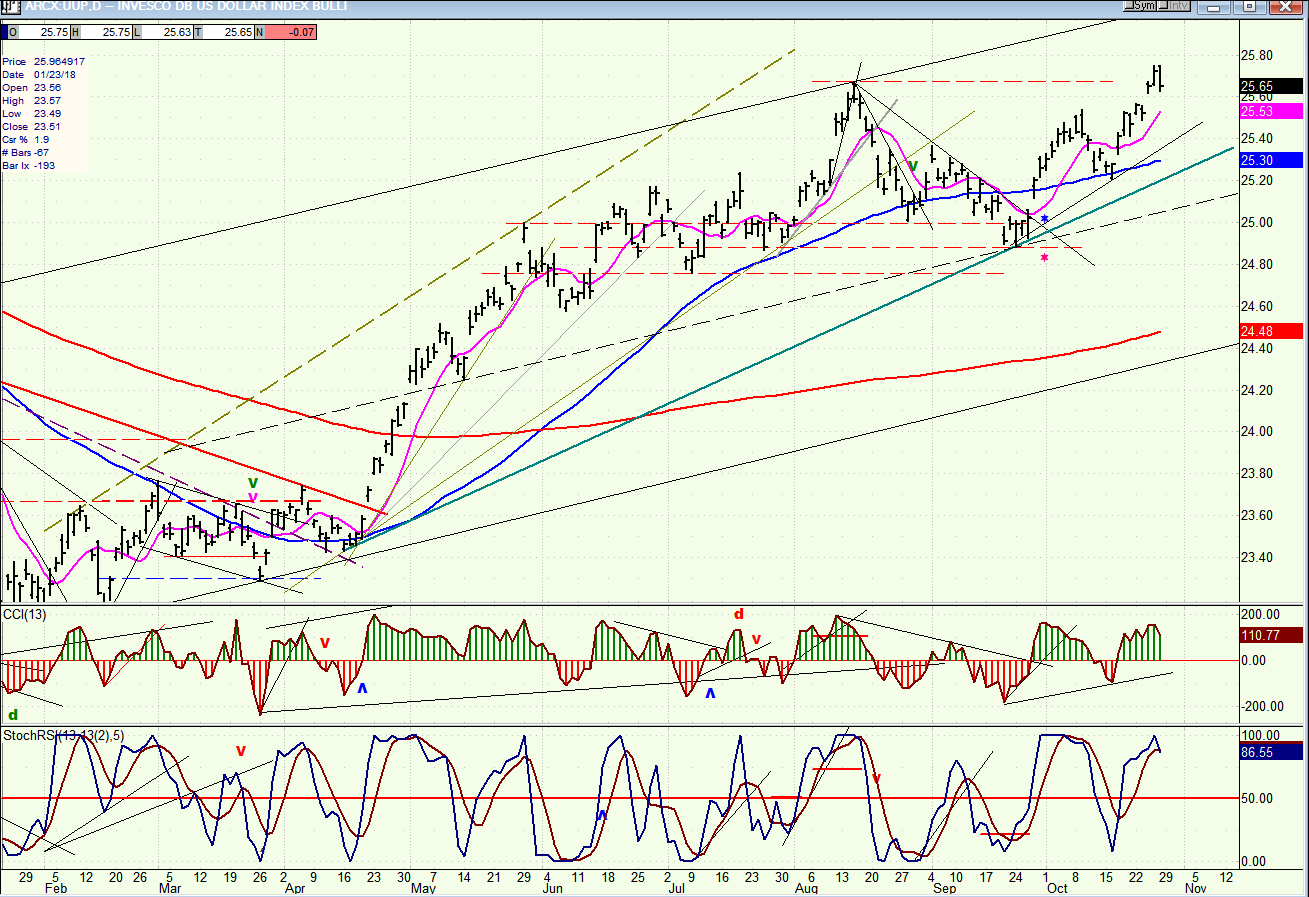
UUP (dollar ETF) daily
After a short period of consolidation and a minor pull-back which held at minor support, UUP has moved to a new high which should send it above 26.00 short-term, and perhaps higher, eventually. In the last article, I stated that there are higher valid P&F projections.
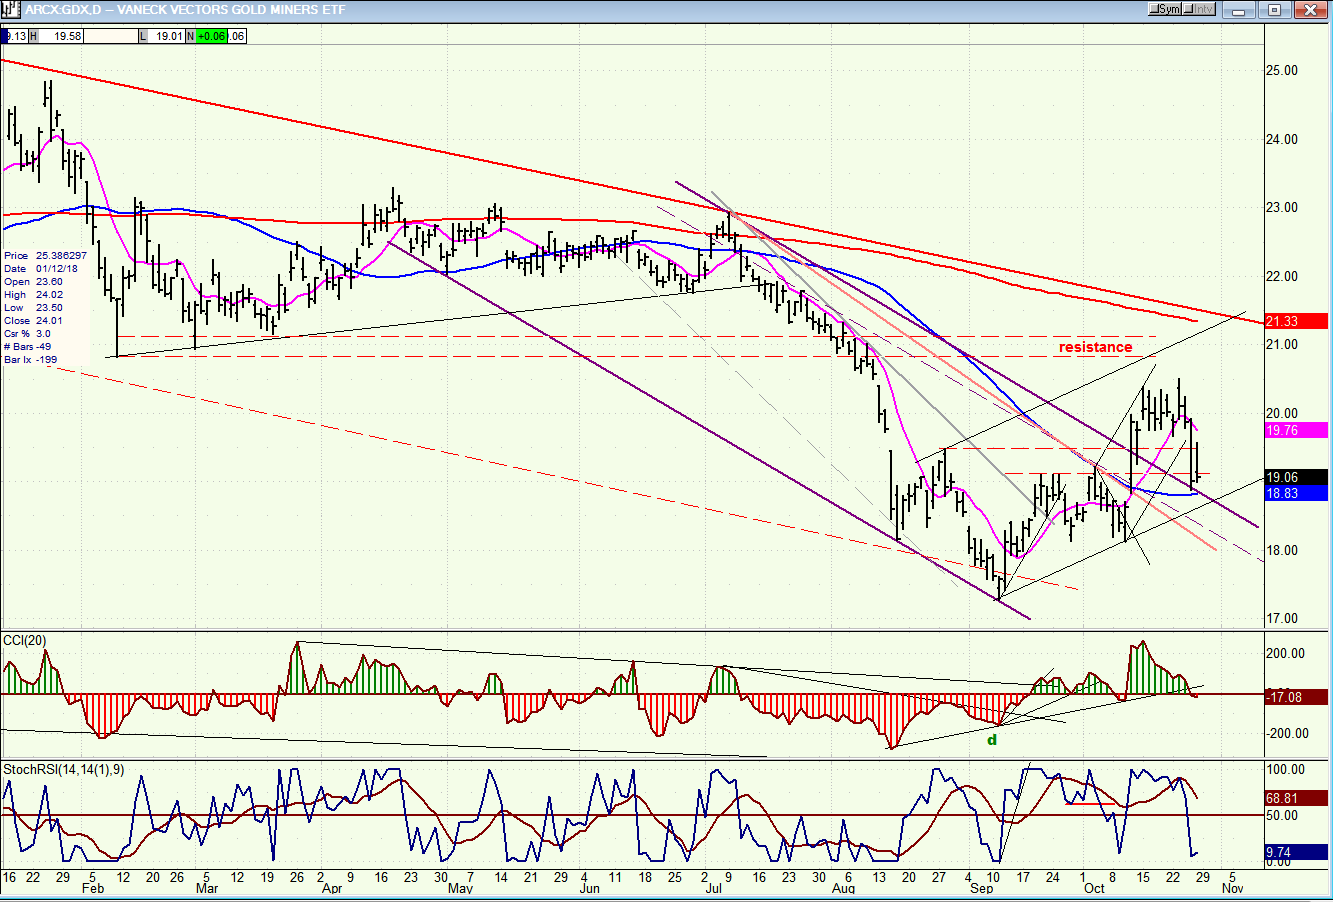
GDX (Gold Miners ETF) daily
GDX had formed a small base which could have taken it as high as 21, but with UUP making a new high, it has ended its attempt at moving higher and has had a serious near-term retracement. While it may simply consolidate in this area which has good support, dropping back into the channel from which it recently broke out would be a sign of prolonged weakness ahead that could eventually take it back to its recent lows and beyond.
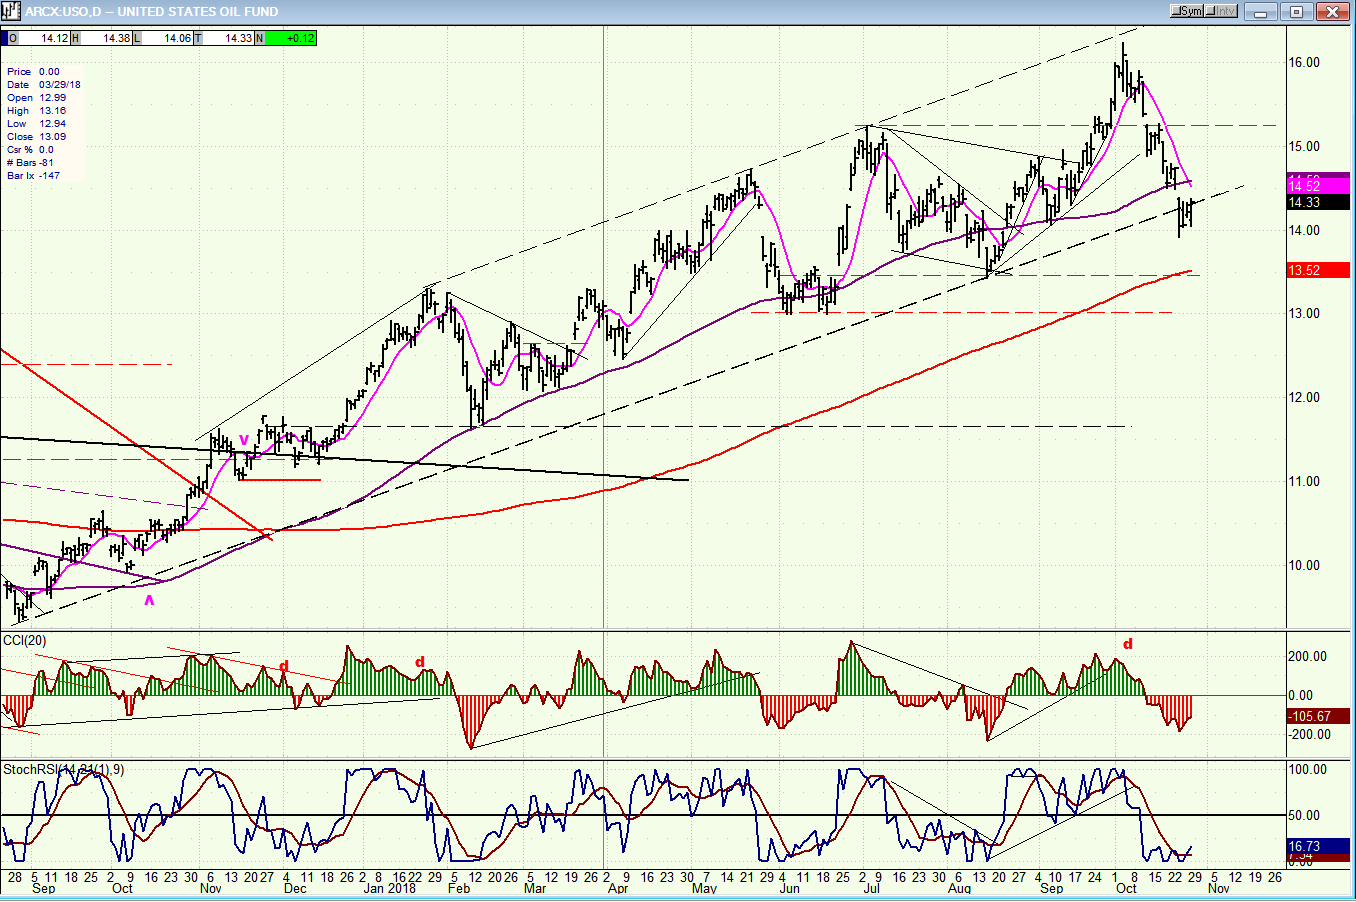
USO (United States Oil Fund) Daily
There is no question that USO has ended its protracted uptrend and entered a corrective phase which could retrace at least .382 of that uptrend down to 13.50… perhaps to the 50.% level of 12.50. After this correction and a period of consolidation it should move higher to complete its longer term uptrend.
Summary
Now that the bear market has been confirmed, our next endeavor should be to estimate the low of its first leg, which appears to be close to ending. Some suggestions have been made above on how to calculate its extent.
FREE TRIAL SUBSCRIPTON
With a trial subscription, you will have access to the same information that is given to paid subscribers, but for a limited time period. I think you will find that knowing how far a move can carry is one of the most useful benefits of this service, whether you are a trader or an investor -- especially when this price target is confirmed by reliable indicators which give advance warning of a market top or bottom. Furthermore, cycle analysis adds the all- important time element to the above price projections.
For a FREE 4-week trial, further subscription options, payment plans, and for general information, I encourage you to visit my website at www.marketurningpoints.com.
The above comments about the financial markets are based purely on what I consider to be sound technical analysis principles. They
represent my own opinion and are not meant to be construed as trading or investment advice, but are offered as an analytical point of view
which might be of interest to those who follow stock market cycles and technical analysis.

When Andre Gratian was a stock broker years ago, a friend introduced him to technical analysis of the market. Consequently, it is not an exaggeration to say that Andre fell in love with this approach! Ever since then, it has become an increasingly important part of his professional life. Gratian has studied the works of Wyckoff, Edwards & Magee, Edward J. Dewey (cycles) and many others. However, one of my most profitable undertaking has probably been to study Point & Figure charting, which he finds invaluable in analyzing stocks and indices. If he were restricted to one methodology, this is the one that he would choose. This well-rounded background has given him what he feels to be a special insight into the stock market, facilitating the recognition of meaningful patterns and the ‘turning points’ in all trends, whether they be short or long term. Andre feels very comfortable discussing the stock market and passing on meaningful information to others. His subscribers include individuals and money managers throughout the world. Moreover, his Newsletters are currently published on several financial sites, here and abroad.
More from Gold-Eagle


