Technical Analysis Of The Markets


Current Position of the Market
SPX: Long-term trend – Bear market
Intermediate trend – Bear market rally
Analysis of the short-term trend is done on a daily basis with the help of hourly charts. It is an important adjunct to the analysis of daily and weekly charts which discusses the course of longer market trends.
Counter-trend Rally Reaches Fibonacci O.618 Retracement
Market Overview
The rally from 2604 is deemed to be a countertrend rally, or a secondary reaction to the primary trend which is now down. As of a week ago Friday, the countertrend had rallied to 2750 and was in the process of pulling back before moving higher. The pull-back was curtailed by the elections, only retracing .382 to 2700, and SPX then surged to our next target of 2815 for a .618 retracement of the entire downtrend from 2841 to 2604. 2815 was reached on Wednesday and SPX has been pulling back, since.
While the B-wave of the primary trend was expected to retrace to ~2813-2838, it is unlikely that we are already on our way to a new low. The P&F accumulation which took place at the 2600 level had suggested a possible reach to about 2840. So, Instead of topping right away, we have probably started a distribution process which could take the index a little higher before the larger trend regains control. The action of IWM, which did a good job of predicting the 2941 top, may again give us a hint about the end of the secondary trend. It is lagging SPX in the recovery, but it also seems to have a little more to go on the upside.
So far, there is no reason to expect the uptrend from 2604 to be anything other than a bear market rally which is usually fast and furious. Of course, we’ll be alert for other possibilities to unfold.
Chart Analysis (The charts that are shown below are courtesy of QCharts)
SPX daily chart
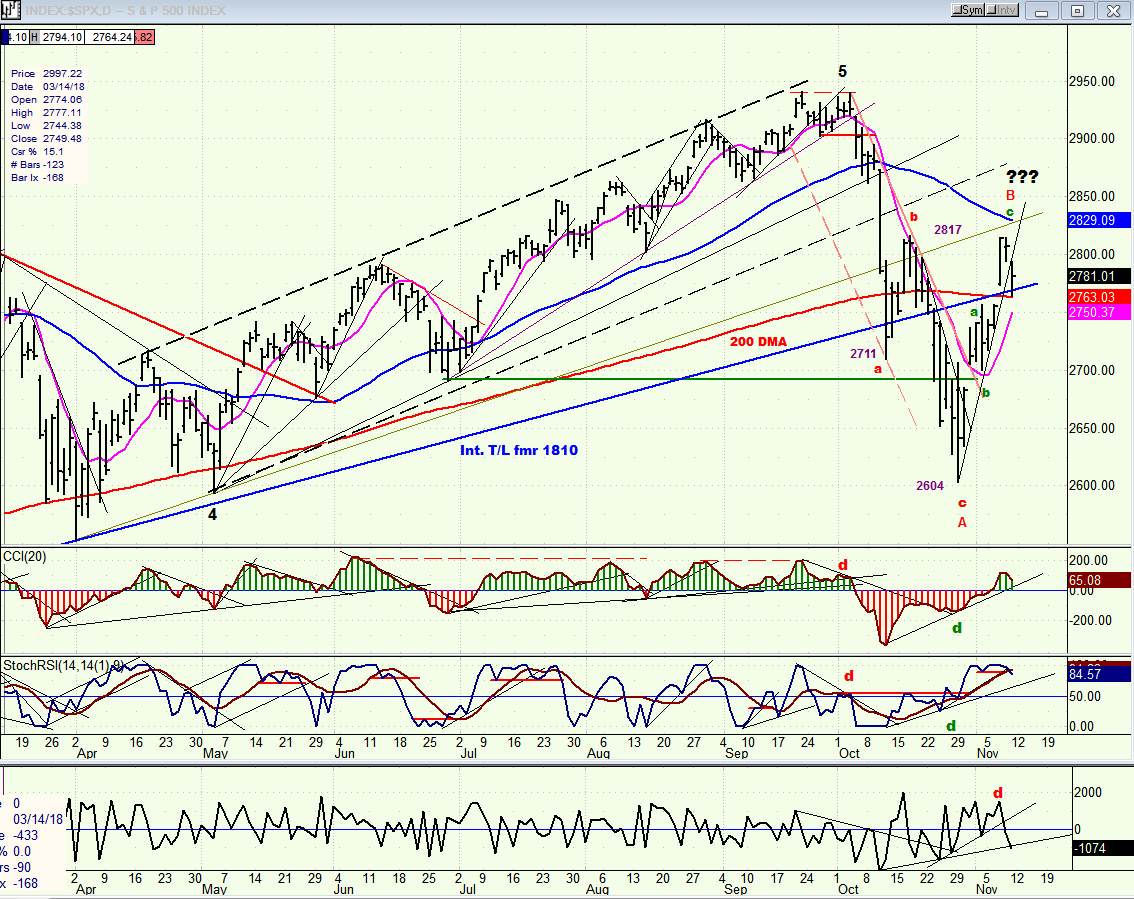
The market structure still suggests that the rally from 2604 is a bear market rally with Wave A making its low at 2604, and wave B currently underway. Since these rallies usually unfold in a 3-wave sequence, this is what is expected, and is the way it has been labeled on the chart. The a-wave found resistance at 2756, just below the major (blue) trend line from 1810, as well as with the 200-dma. Wave b was completed at 2700, just above the June low (green horizontal line), and wave c is currently underway. While it has reached the normal .618 retracement of the initial downtrend, there are reasons to believe that it will first pull back, and then make its final high either by re-testing the 2815 level or moving a little beyond to about 2840.
The oscillators turned down after the price reached 2815, but are only suggesting a consolidation at this time. Should all three continue lower and become negative again (the A/Ds indicator already has) it would be a sign that we could be on the way to re-test at least the 2700 level one more time; so what happens over the next week or so should clarify the market position.
Structurally, the finishing touch of the large B wave should require another move higher toward 2830-40 to complete what appears to be a zig-zag formation from the 2604 low.
SPX hourly chart
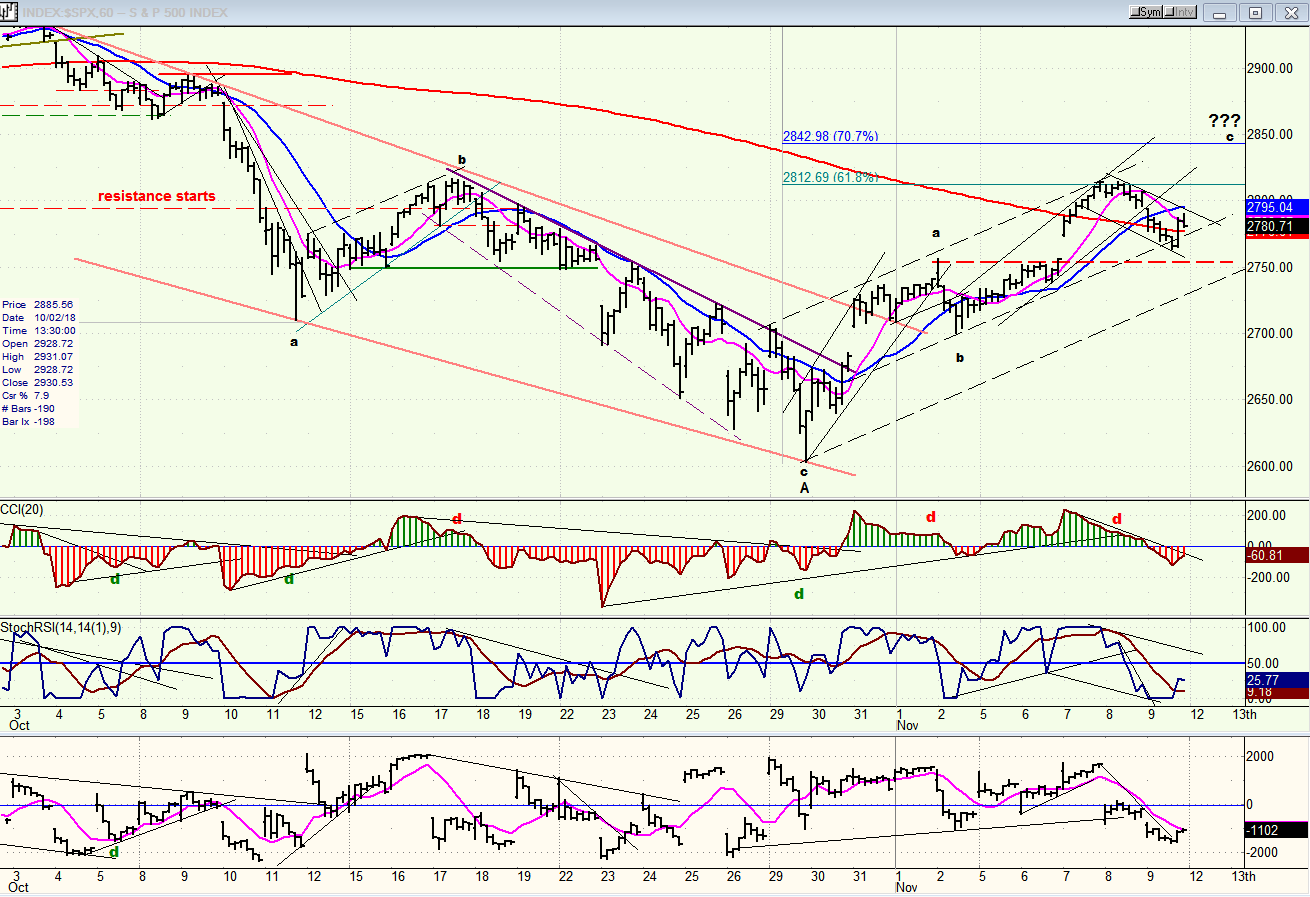
The rally from 2604 stopped just a tad above the .618 retracement of the initial downtrend. Since there is a P&F count potential to 2840, it’s possible that we end up retracing .707 of that distance, which would not be
uncommon. After reaching .618, the index started a correction which was predicted by the negative divergence in the momentum oscillators and which does not look quite finished since we are still in the red zone, with the price remaining within a small down-trending channel. It is possible that the current pull-back will close the open gap, and find support on the red dashed line just below and, from there, start the move which could complete the larger B wave. However this plays out, SPX will remain in a short-term uptrend until it comes out of the price channel represented by the two dashed lines.
If, after completing its move to about 2840, the index does not immediately start to decline below 2700, it would mean that additional distribution is needed in this area in order to build a larger count before resuming the primary trend, perhaps in the form of a double zig-zag. A third option would be for the index, after additional consolidation, to begin a move that would surpass 2840. This would alert us to the possibility that we still have not made the bull market high after all, and that the original 3000+ projection is still viable.
DJIA, SPX, NDX, IWM (daily)
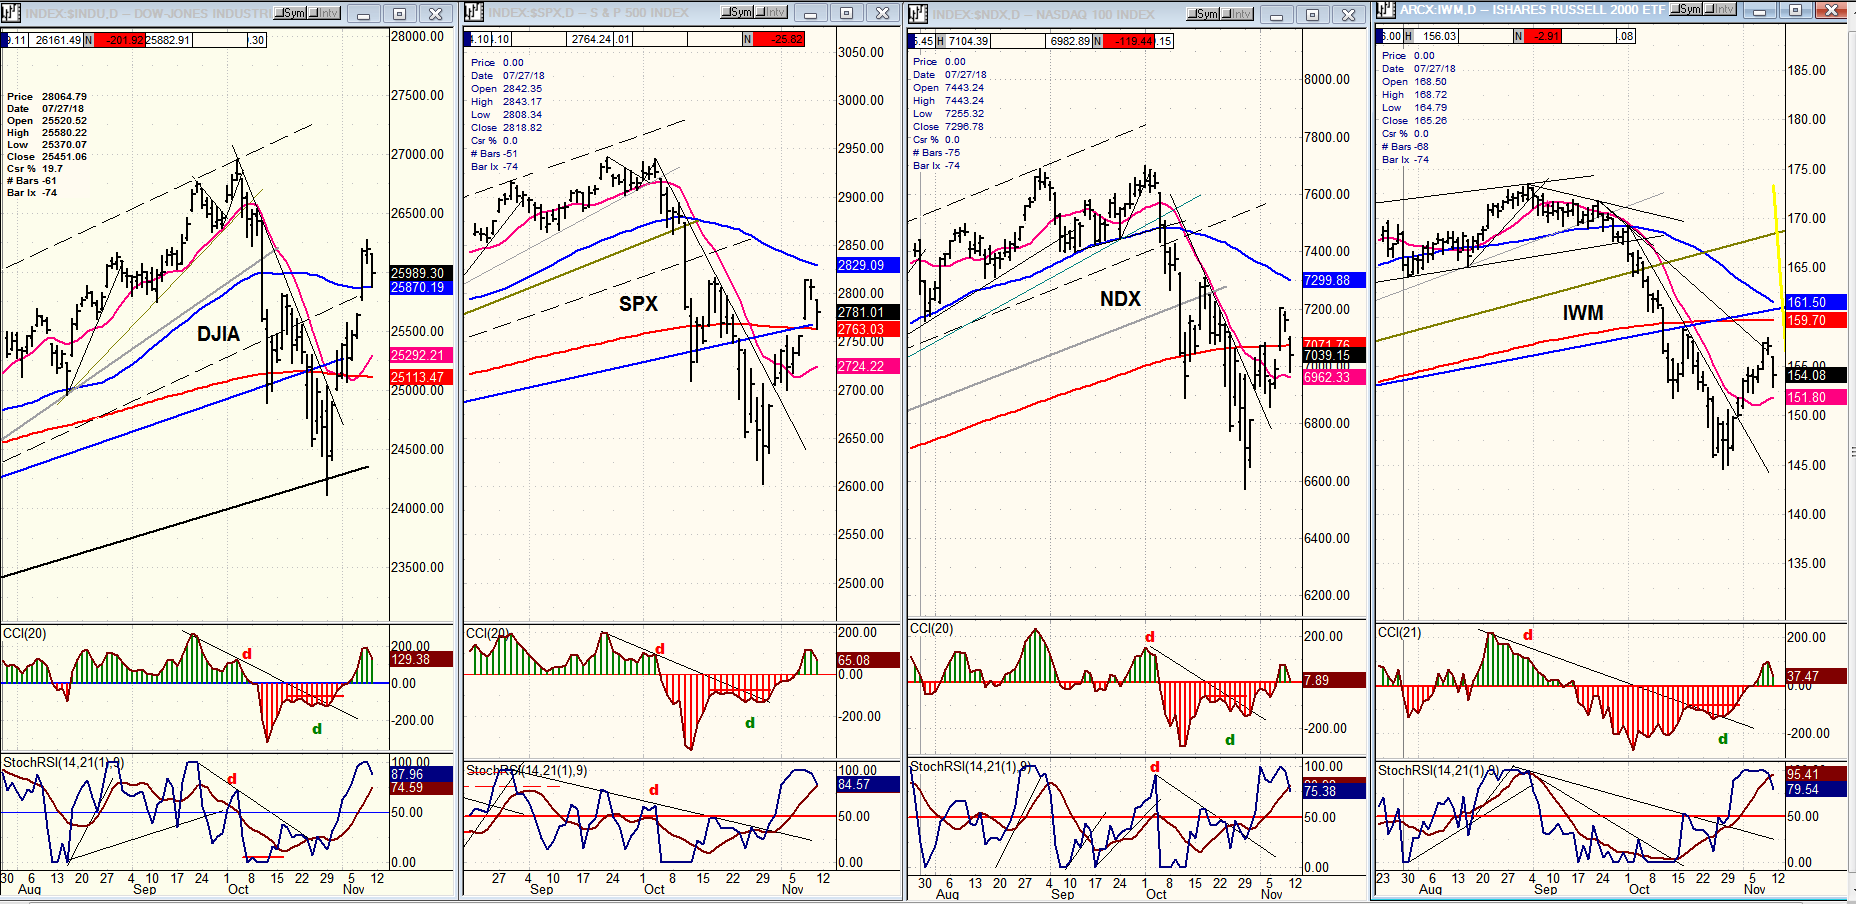
The DJIA remains unquestionably the strongest index and IWM the weakest. A quick way to assess this is by looking at Friday’s close relative to the red 200-dma and blue 50-dma. While all four indexes broke below the 200-dma, DJIA is the only one which rebounded above both moving averages, while IWM has not even come close to its 200-dma. Until IWM starts to improve its relative performance to the other indexes, we can assume that the correction is not over.
The P&F chart suggests that IWM (154) could drop down to 125-130 before its correction is over. This is interesting, because IWM is correcting a 79-pt rally from 94 on 1/16. A .618 retracement of that rally would take it back down to 125, the same level suggested by the P&F count. If all indexes retrace .618 of their move from January 2016, this would give SPX (2781) a correction low of 2240, DJIA (25,989) a low of 19,950, and NDX (7039) one of 5384. (Something to keep in mind while considering other options.)
UUP (dollar ETF) daily
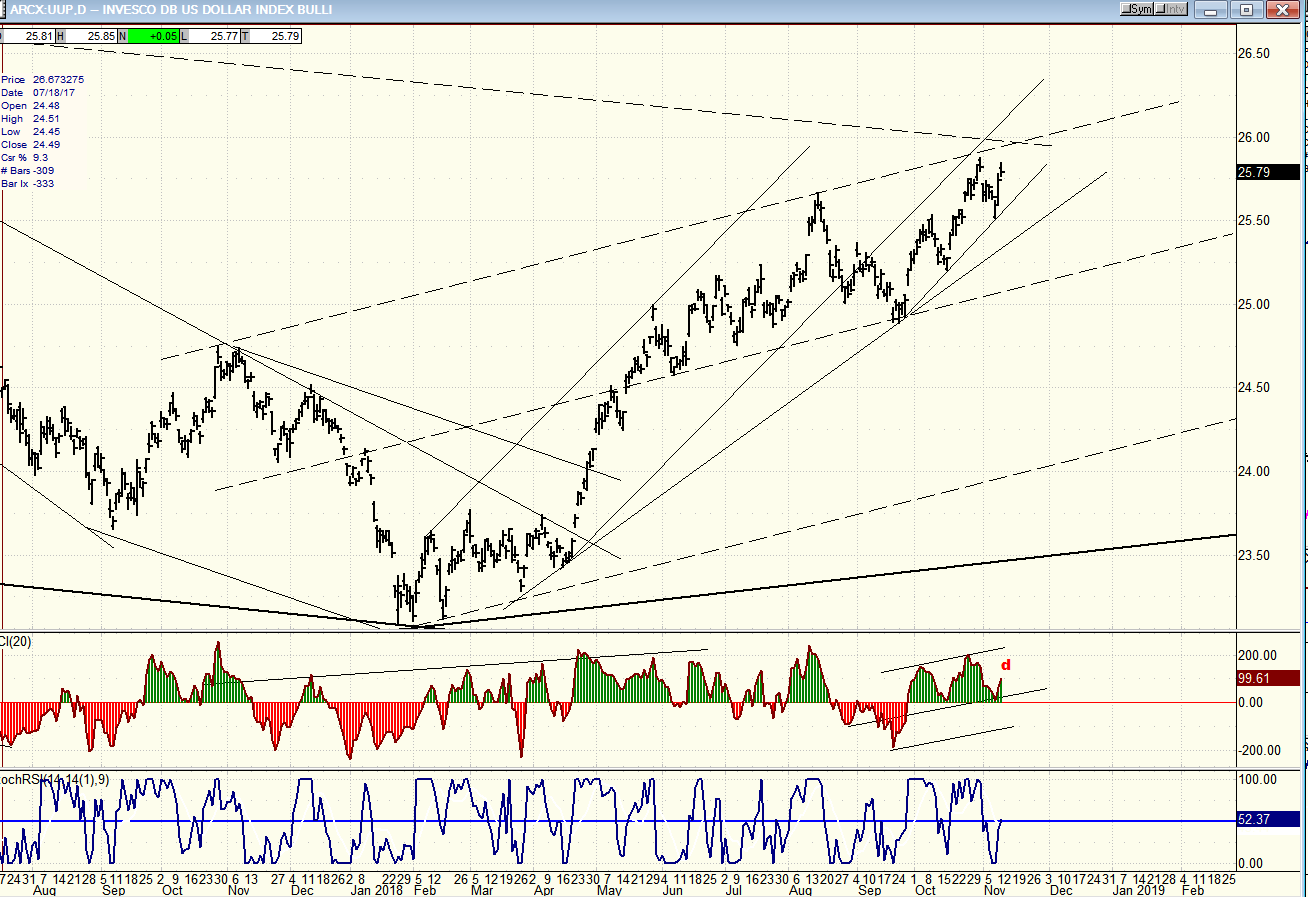
UUP has pushed to a new high but is coming close to some resistance at about 26.00. The indicators are also beginning to show some negative divergence. That suggests that it is approaching a reversal point and subsequent downtrend, which could challenge at least the short, minor trend line immediately and, a little later on, the longer trend line from the March-April low.
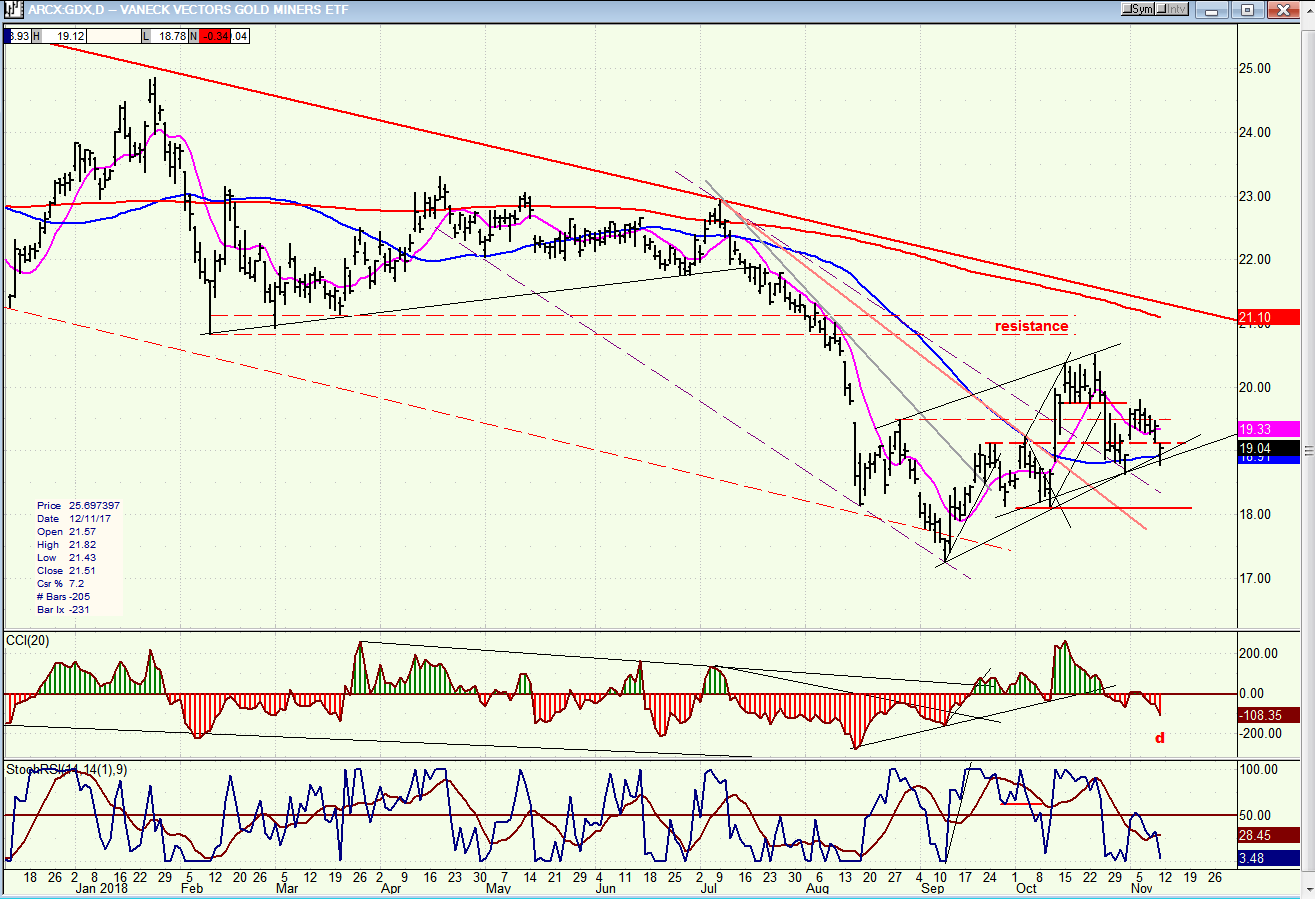
GDX (Gold miners ETF) daily
The recent strength in UUP has set GDX back (at least temporarily), and until it shows a better action in its oscillators it could drop a little lower; especially if UUP continues to move higher. However, with UUP’s upside apparently limited, and good support still present just above 18.00, further weakness in this index may be limited.
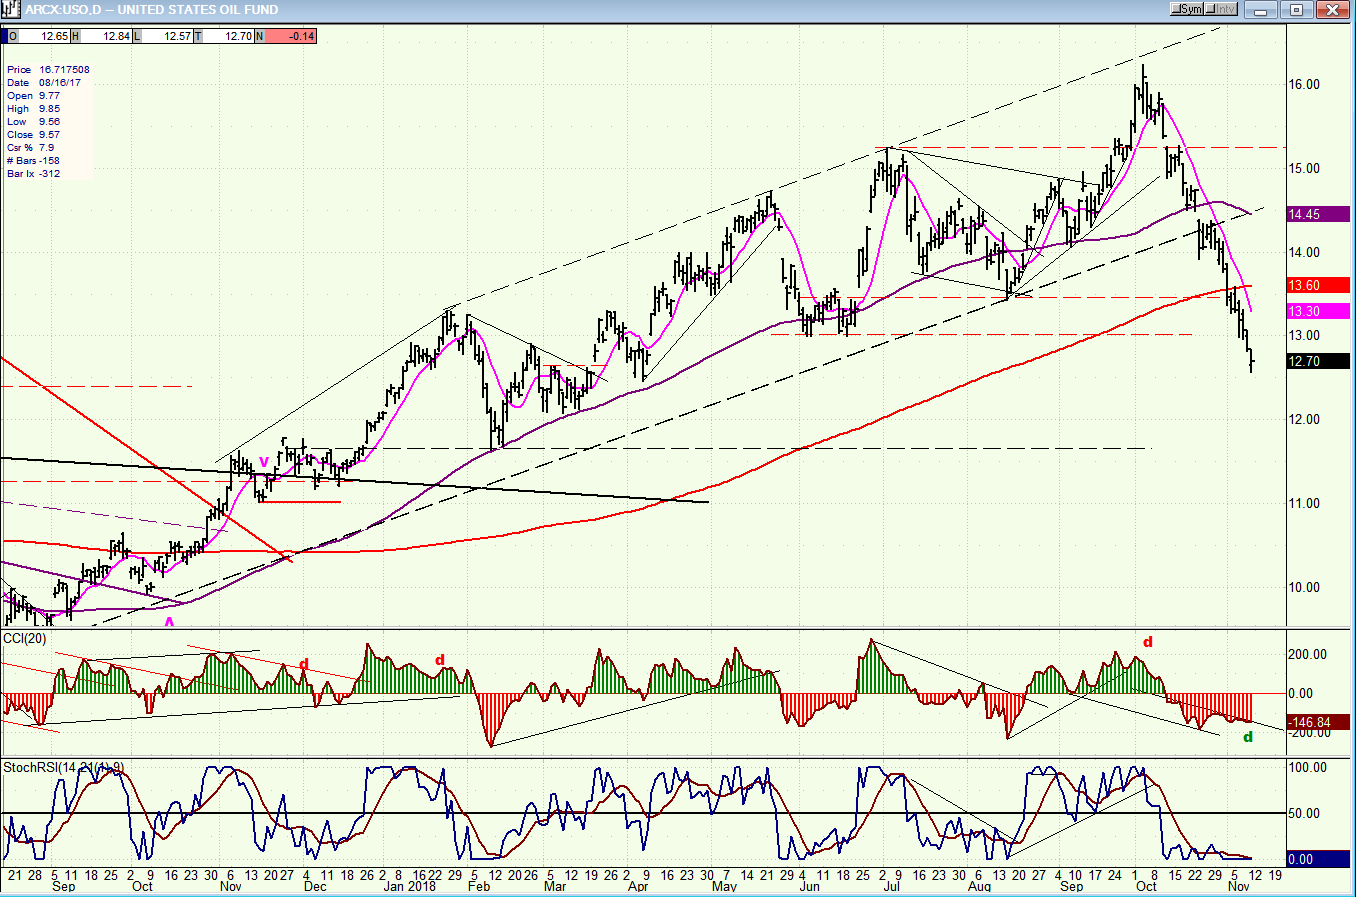
USO (United States Oil Fund) daily
USO is approaching a 50% retracement of its recent uptrend, and this may be good enough for at least a temporary hold, and perhaps a place from which it can resume its longer term uptrend. Positive divergence has begun to appear in the CCI and this is a bullish sign.
Summary
Last week, SPX surged before and after the elections, reaching 2815, a Fibonacci 0.618 retracement of its original decline from 1941 to 1604. This could be good enough to have completed the B wave rally. But since there are still potential counts to about 2840, we should wait and see what it does over the next week or so.
FREE TRIAL SUBSCRIPTON
With a trial subscription, you will have access to the same information that is given to paid subscribers, but for a limited time period. I think you will find that knowing how far a move can carry is one of the most useful benefits of this service, whether you are a trader or an investor -- especially when this price target is confirmed by reliable indicators which give advance warning of a market top or bottom. Furthermore, cycle analysis adds the all- important time element to the above price projections.
For a FREE 4-week trial, further subscription options, payment plans, and for general information, I encourage you to visit my website at www.marketurningpoints.com.
The above comments about the financial markets are based purely on what I consider to be sound technical analysis principles. They represent my own opinion and are not meant to be construed as trading or investment advice, but are offered as an analytical point of view which might be of interest to those who follow stock market cycles and technical analysis.

When Andre Gratian was a stock broker years ago, a friend introduced him to technical analysis of the market. Consequently, it is not an exaggeration to say that Andre fell in love with this approach! Ever since then, it has become an increasingly important part of his professional life. Gratian has studied the works of Wyckoff, Edwards & Magee, Edward J. Dewey (cycles) and many others. However, one of my most profitable undertaking has probably been to study Point & Figure charting, which he finds invaluable in analyzing stocks and indices. If he were restricted to one methodology, this is the one that he would choose. This well-rounded background has given him what he feels to be a special insight into the stock market, facilitating the recognition of meaningful patterns and the ‘turning points’ in all trends, whether they be short or long term. Andre feels very comfortable discussing the stock market and passing on meaningful information to others. His subscribers include individuals and money managers throughout the world. Moreover, his Newsletters are currently published on several financial sites, here and abroad.


