Technical Analysis Of The Markets


Here is my Chart of the Day Friday summary (just 4 again this week!) covering markets, technicals, sectors and stocks I am interested in. You can find these on Linkedin too, so please connect with me there for daily content updates. You can click on each chart title below for more information.
Please feel free to share with friends and colleagues. Please call me directly (086 821 5911) for more information on portfolio management services available at Secure Investments.
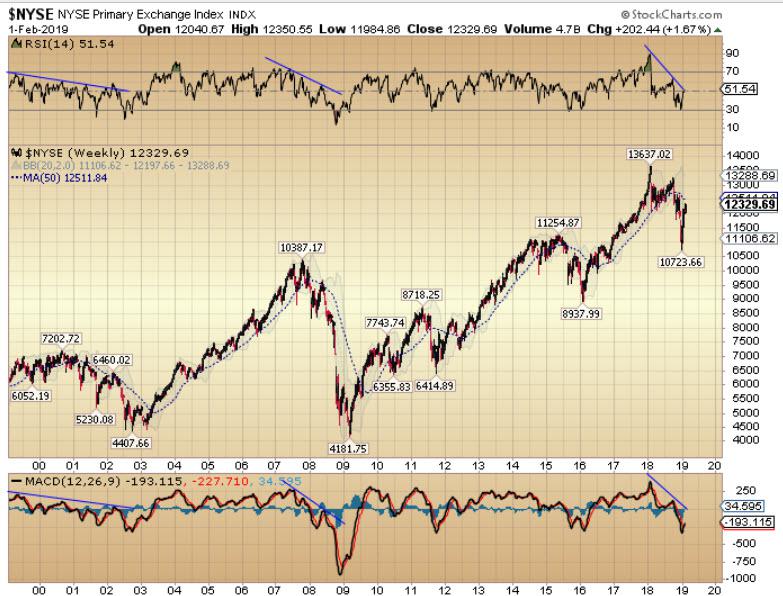
Waiting Game - Following the December plunge in the stock market, we are experiencing a sharp oversold rally, which is now running into resistance overhead. The longer-term 50 week moving average is turning down and should cap the advance from here. What happens next is all important. Is this a bear-market rally that has run its course, or the start of the next leg higher in an ongoing 10-year bull market? We will find out shortly.
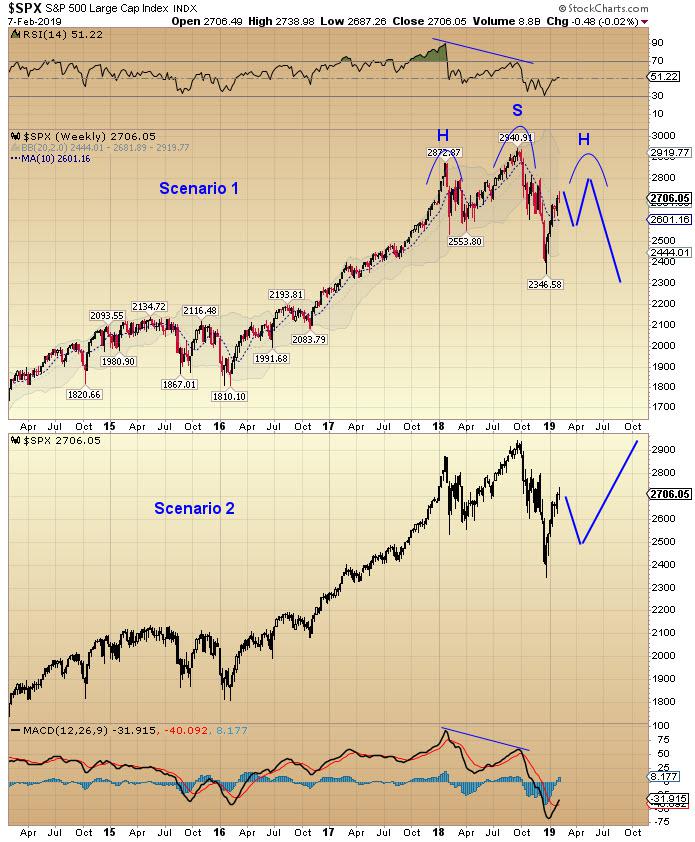
Reading the Tealeaves - I have outlined my expectations for the stock market in the chart below. In scenario one, the S&P 500 forms a head-and-shoulders top pattern, similar to the German Dax Index. For this scenario to play out, the S&P should peak in the region of 2,750-2,850 over the next three months. In scenario 2, the S&P tops out here, retraces 50-78% of the recent rally, forms a higher low with positive divergences in RSI and MACD and then resumes the bull market and breaks out to new highs later in the year. The continued recent strength in my TTI suggests that scenario 2 has higher odds of playing out at the current time.

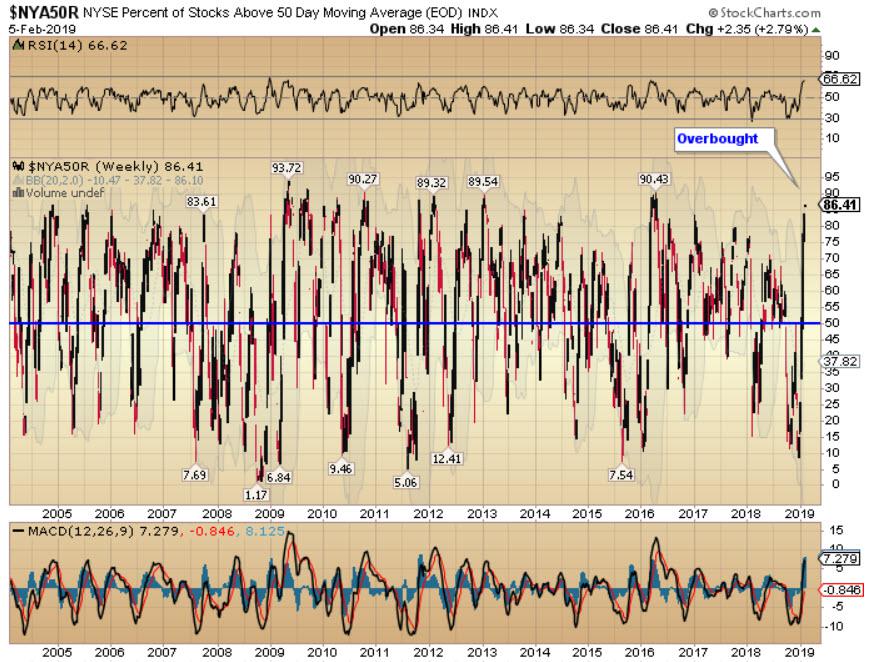
OverBought - The stock market technical indicators delivered another improvement yesterday. Relative strength indicators (RSI) for US markets have moved into positive territory above 50%, now joined by the EuroStoxx 600 Index this week. MACD momentum readings are still negative for all markets. The S&P 100 and 500 have edged above their long-term MA’s (50WMA) for the first time in months. The tech sector, S&P 500 and 100 indices in the US are now showing readings with the majority of stocks trading above their 200DMA. Meanwhile, the NYSE A/D Line is approaching the highs set in December while the TTI has broken out to new all-time highs.
Assessing the Market's Technical Trend - The Technical Trend Indicator (TTI) registered -6 on Wednesday. Industrials, transports, utilities and technology stocks closed lower on the day. There were fewer advancing stocks than declining stocks (A/D) on the NYSE. The largest market cap stocks (BMBI) closed lower on the day while the majority of stocks with the highest daily volume (MASI) on the NYSE also closed lower on the day. Bond yields closed lower on the day, positively impacting the TTI. The TTI registered 2,898 versus its long-term moving average of 2,852, +46 above trend.
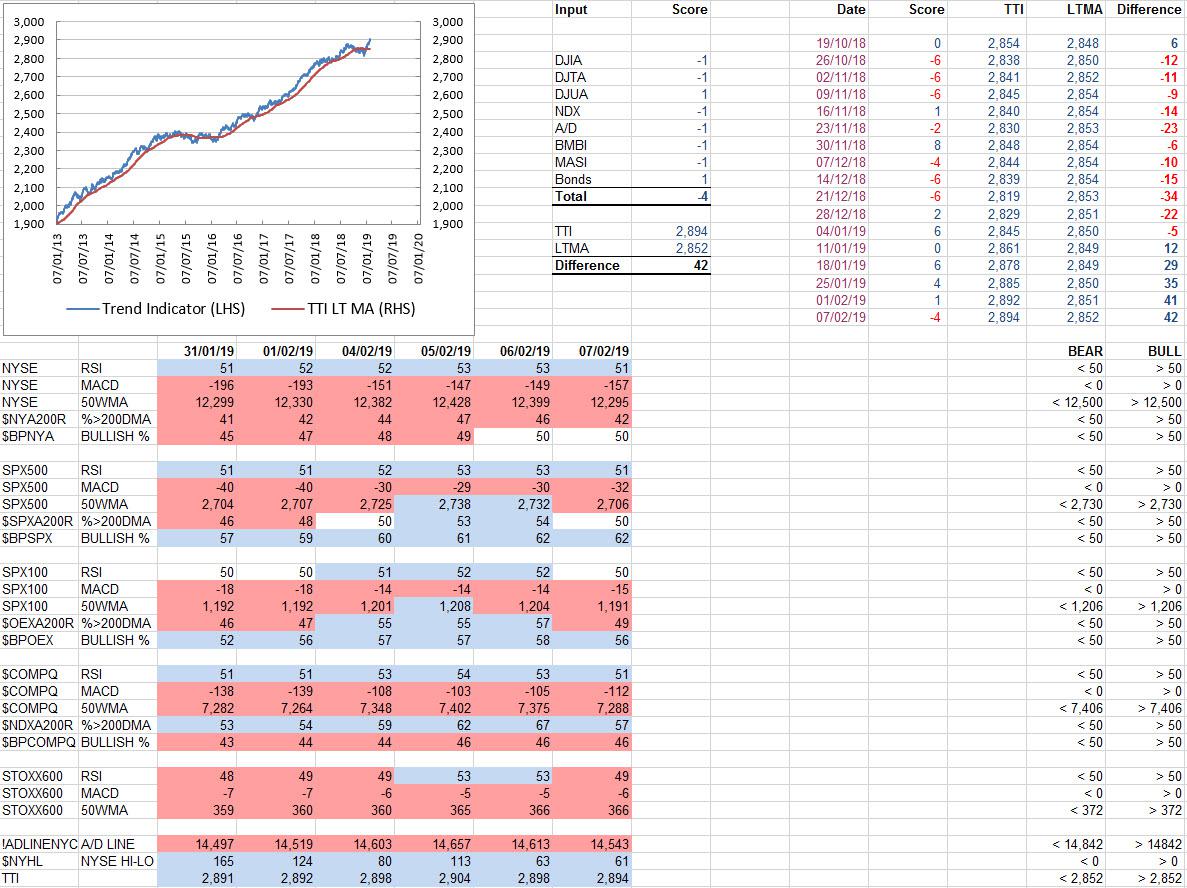
Head and Shoulders - (Same chart again, but it's an important one!) We are starting to see a deterioration in some of the technical indicators I follow. Relative strength indicators (RSI) for US markets are still holding just above 50% but the RSI for EU stocks has dipped below 50% again. MACD momentum readings are still negative for all markets. The S&P 500 has closed below the long-term MA (50WMA) again, joining the NYSE, S&P 100, NASDAQ and EU Stoxx600 Indices. Only in the tech sector are the majority of stocks still trading above their 200DMA. The NYSE A/D Line is still near the highs set in December but needs to see follow through or else we have a lower high in the A/D Line. The TTI remains 42 points above its long-term trend.
Have a wonderful weekend everyone!
Join a growing list of savvy readers and get exclusive content for free. No spam, ever. Just great stuff.
Brian Delaney, CFA
Director, Secure Investments
Tel: +353 86 821 5911
Website: www.secureinvestments.ie
Email: [email protected]
LinkedIn: Brian Delaney, CFA
Twitter: @briandelaney_
*********
Delaney Investment Services Limited trading as Secure Investments is regulated by the Central Bank of Ireland. Delaney Investment Services Limited is registered in Ireland and is a limited liability company. Registration Number: 516058. Registered Office: 76B Northumberland Road, Ballsbridge, Dublin 4, Ireland.


