Technical Analysis Of The Markets


Current Position of the Market
SPX: Long-term trend – Long-term trend resuming?
Intermediate trend – Initial rally is coming to an end.
Analysis of the short-term trend is done on a daily basis with the help of hourly charts. It is an important adjunct to the analysis of daily and weekly charts which discusses the course of longer market trends.
A Correction Is Due
Market Overview
Hope that trade negotiations with China will bring some tangible results have kept the SPX in an uptrend for the past few days, but the technical picture shows a market which is on its last leg. This is apparent with whatever methodology you are using. The extended projection targets are being met and the indicators are showing negative divergence with deceleration evident in the price pattern. EWT analysts also see the conclusion of the wave pattern from 2346. In other words, SPX can reverse at any time, and breaking the trend line which currently lies just a few points below Friday’s close should be the trigger.
As the near-term picture comes into focus, so does the longer term. The extent of the rally from the 2346 low has nullified the possibility that this move is a secondary reaction. It has surpassed the maximum retracement limits, and while short-term indicators are forecasting a correction, intermediate and long-term have gotten back into a bullish pattern. This means that after the coming correction – which can still be fairly extensive – the odds that the index will go for new highs has increased.
Chart Analysis (The charts that are shown below are courtesy of QCharts)
SPX daily chart
The index briefly paused at the 200-DMA before going through it. That does not mean that it will keep on going! Although it is tempting to use the previous peaks as examples (all of which went above slightly before turning down) the market condition is not similar. Those peaks were the culmination of rallies in a larger downtrend, while this rally will peak for the reasons given in the Market Overview and should not lead to the resumption of a sustained decline, but only to a normal correction which should start as soon as price moves outside of the dashed channel.
Without making things too complicated, a quick estimate of the retracement would be for SPX to do a kiss-back of the red downtrend line, where it would also find support at the 50-DMA. I had initially estimated that a correction could take place into the middle or the end of the month. It looks as if the middle of the month is going to turn out to be the high of the move instead, with prices correcting for the rest of February.
As you can see, there is visible negative divergence in the CCI (top) and in the A/D (bottom). It also shows in the SRSI in the slower MA. It would take an immediate, strong extension of the rally beyond 2800 to change the increasingly negative appearance of the chart and the expectation of an imminent reversal.

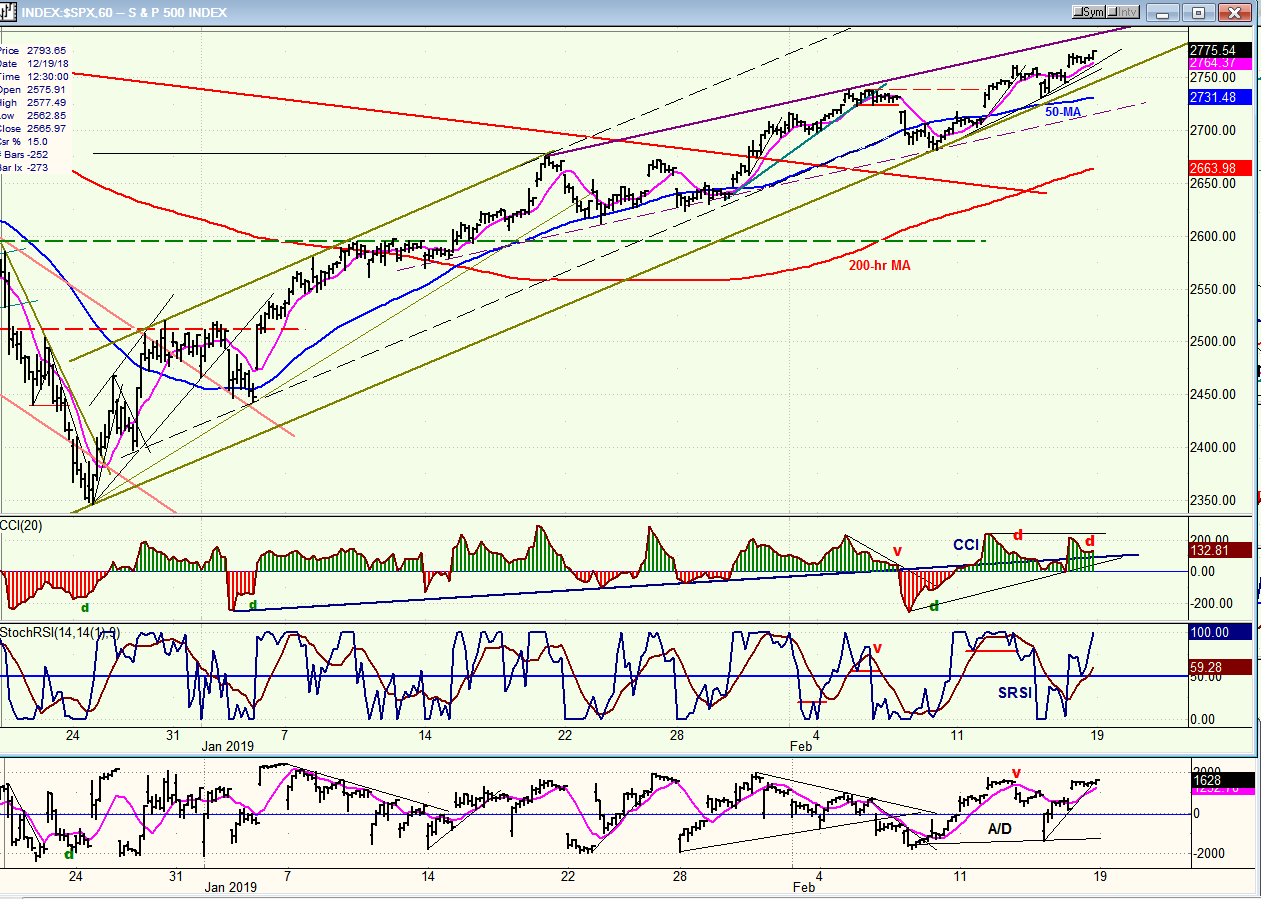
SPX hourly chart
The price channel can best be identified by drawing a line across the first three near-term tops of the uptrend, with a parallel at the 2346 low. From the third top, the trend starts to angle downward and it does not touch the bottom channel line until 2/08. From that point on, the index has continued to crawl above the channel line without being able to trade below it. It is fair to assume that when it does (which could be next week), it will start a correction of the entire trend with a rough objective of about 2600. This is about where it would back-kiss the broken red downtrend line and provide a .382 retracement of the entire uptrend. As we get closer to that point, we can start refining the analysis to see if this is where we are likely to end the correction.
After finding support on the bottom channel line, the index moved back above the 50-hr MA and made a new high which was followed by one more retracement to just above the MA. From there, it embarked on what looks like the final small 5-wave pattern which could complete as early as Tuesday. To repeat, unless we can get another surge in prices on Tuesday, the odds favor putting an end to the rally on that date.
The opening gap on Friday morning immediately took SPX to a new high and erased the negative divergence in the oscillators, but it was reinstated by the end of the day.
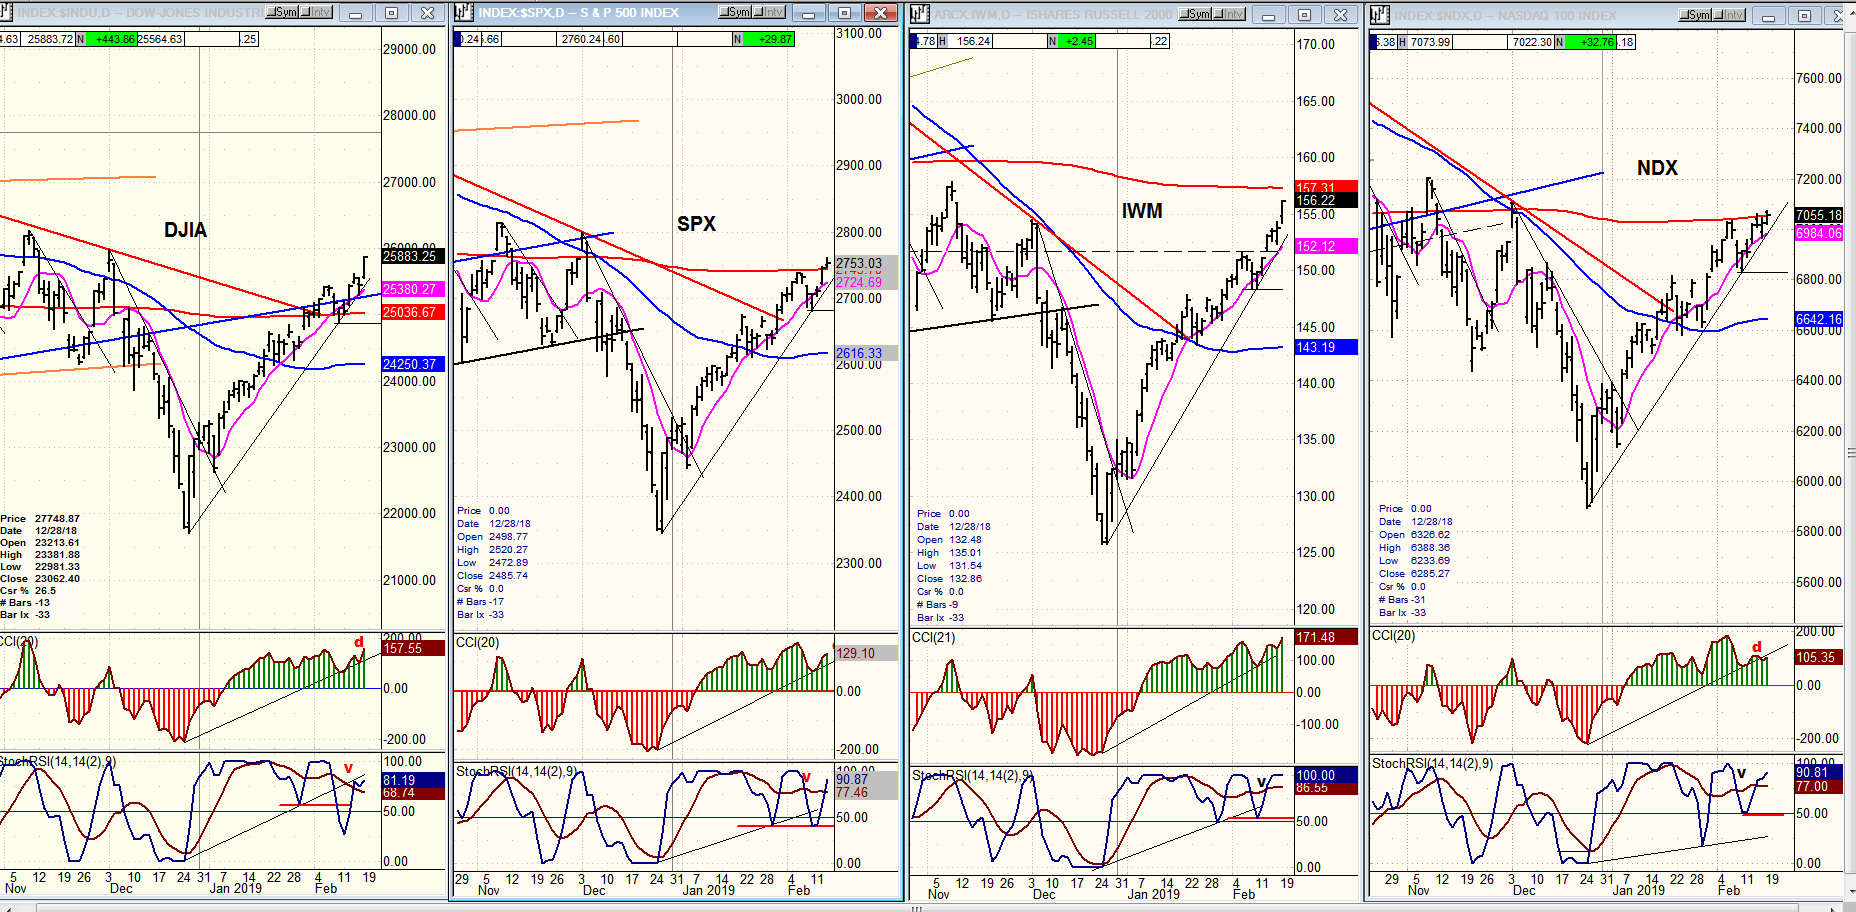
DJIA, SPX, IWM, NDX (daily)
Last week, IWM was the best performer and the first one to overcome its December 3rd peak which is comparable to 2800 in SPX. Since we have been looking for that index to underperform the others at the end of rallies, what is it telling us? If it’s any consolation for the bears, by the end of the day on Friday, it was well underperforming the DJIA and, to a lesser extent the SPX, while NDX was underperforming them all. Perhaps this is enough underperformance (although far from ideal) to still be meaningful.
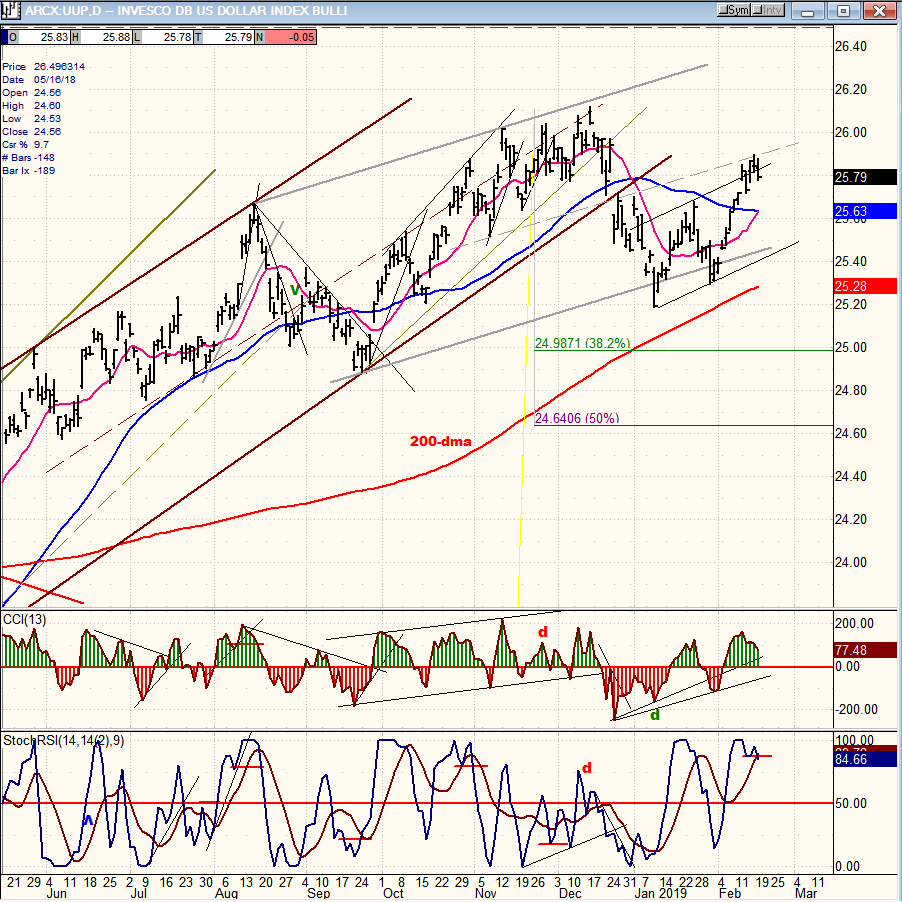
UUP (Dollar ETF) (daily)
UUP may be ready to extend its correction. It looks as if it has completed an a-b-c corrective pattern and is ready to go down and challenge the 200-DMA.
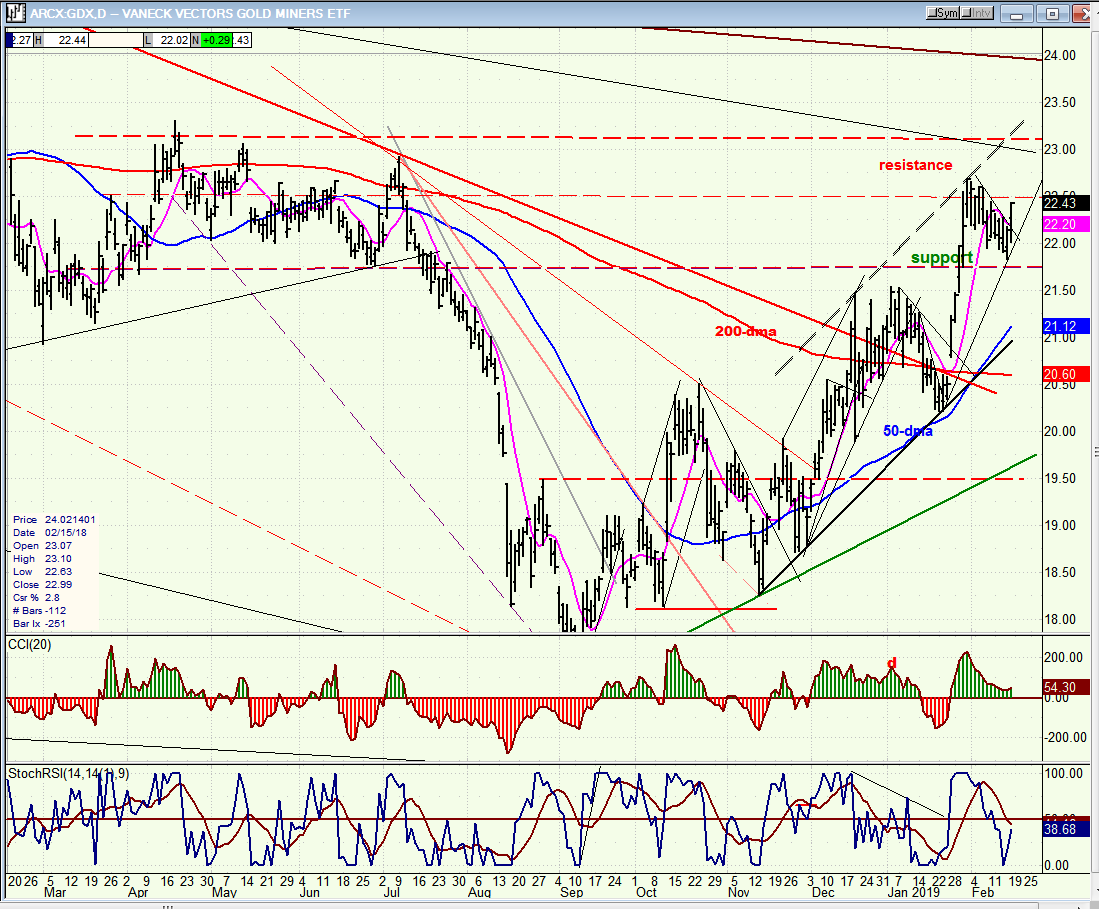
GDX (Gold miners ETF) (daily)
GDX has been waiting for UUP to resume its correction in order to get moving again. The near-term pattern looks like a little flag and, if so, a valid break-out could take it immediately to 24.25 (minimum) which is the projection suggested by a move equivalent to the length of the flag mast. This would be consistent with the P&F chart reading which has a count of about 24.50.
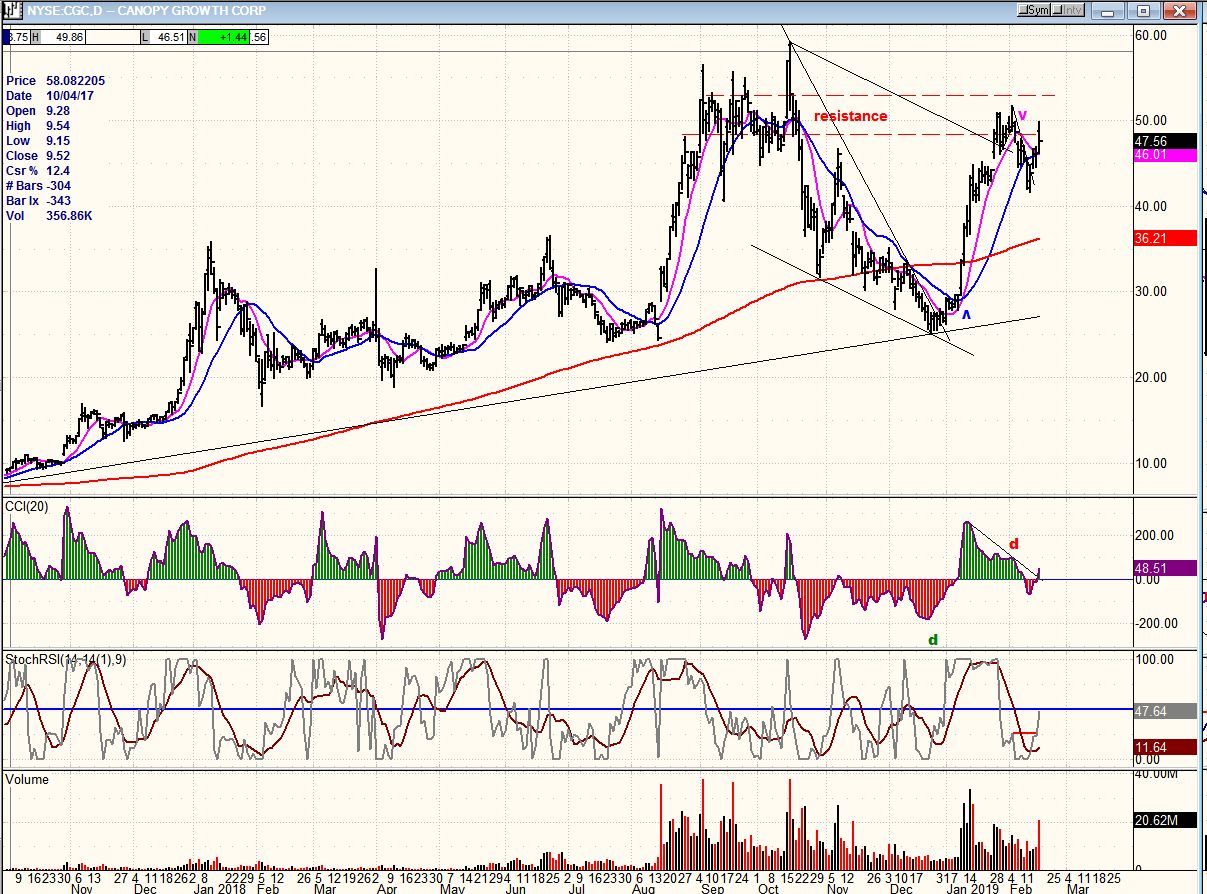
CGC (Canopy Growth) (daily)
CGC may also be ready to push higher if it can capitalize on the momentum established over the past three days. However, after closing in the middle of the day’s range on Friday, it will need to show enough immediate buying interest to overcome the recent high. If it can’t do this, it will probably need to consolidate further.
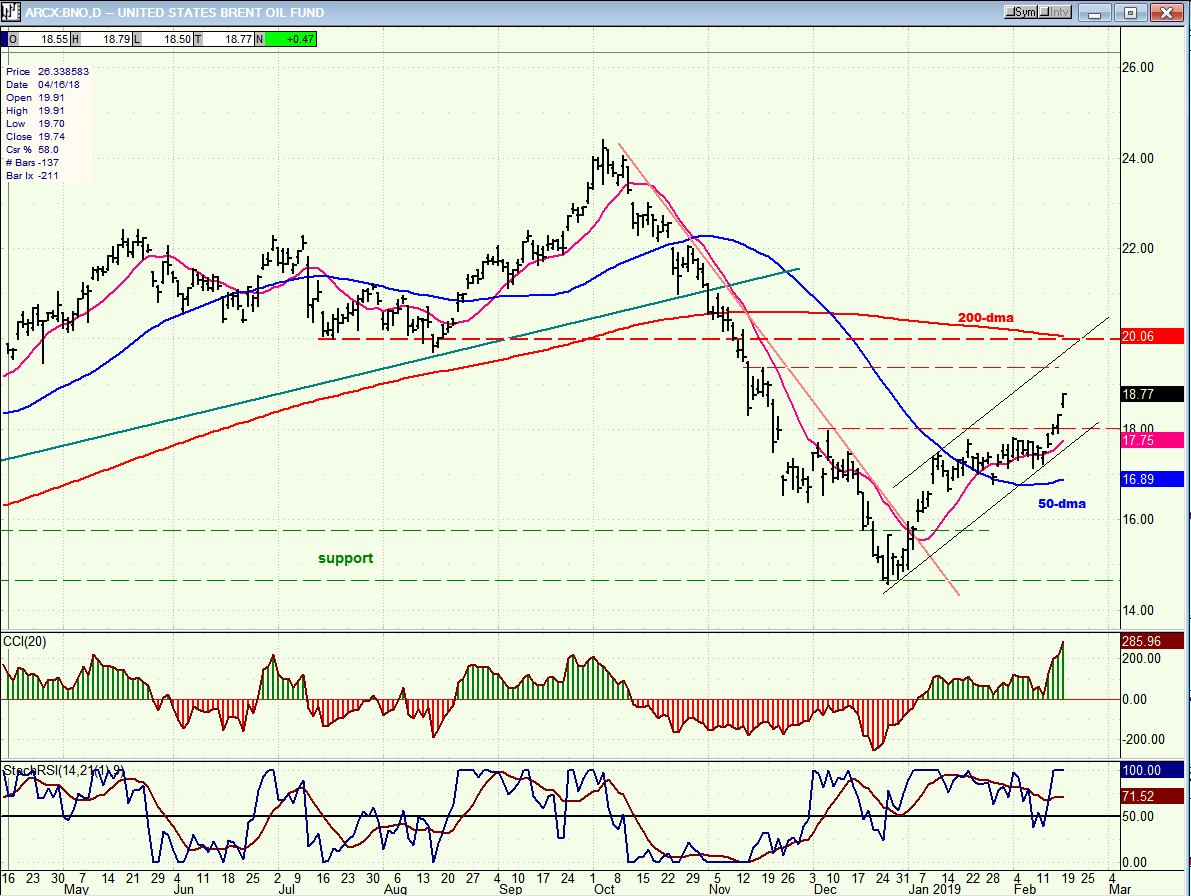
BNO (United States Brent Oil Fund) (daily)
BNO is showing a little more strength than I had anticipated, but it will have to push beyond 19.50 to suggest a retest of the 200-DMA and a move to the overhead resistance.
Summary
SPX shows many signs of having come to the end of the uptrend from 2346 and could reverse early next week, but one aspect of the analysis is not fully in sync with the rest. Nevertheless, odds still favor the correction to start next week
FREE TRIAL SUBSCRIPTON
With a trial subscription, you will have access to the same information that is given to paid subscribers, but for a limited time period. I think you will find that knowing how far a move can carry is one of the most useful benefits of this service, whether you are a trader or an investor -- especially when this price target is confirmed by reliable indicators which give advance warning of a market top or bottom. Furthermore, cycle analysis adds the all- important time element to the above price projections. For a FREE 4-week trial, further subscription options, payment plans, and for general information, I encourage you to visit my website at www.marketurningpoints.com.
The above comments about the financial markets are based purely on what I consider to be sound technical analysis principles. They represent my own opinion and are not meant to be construed as trading or investment advice, but are offered as an analytical point of view which might be of interest to those who follow stock market cycles and technical analysis.

When Andre Gratian was a stock broker years ago, a friend introduced him to technical analysis of the market. Consequently, it is not an exaggeration to say that Andre fell in love with this approach! Ever since then, it has become an increasingly important part of his professional life. Gratian has studied the works of Wyckoff, Edwards & Magee, Edward J. Dewey (cycles) and many others. However, one of my most profitable undertaking has probably been to study Point & Figure charting, which he finds invaluable in analyzing stocks and indices. If he were restricted to one methodology, this is the one that he would choose. This well-rounded background has given him what he feels to be a special insight into the stock market, facilitating the recognition of meaningful patterns and the ‘turning points’ in all trends, whether they be short or long term. Andre feels very comfortable discussing the stock market and passing on meaningful information to others. His subscribers include individuals and money managers throughout the world. Moreover, his Newsletters are currently published on several financial sites, here and abroad.


