Technical Analysis Of The Markets


Current Position of the Market
SPX: Long-term trend – Final long-term phase on the way? How much longer, is the question.
Intermediate trend – The intermediate-term correction continues to unfold.
Analysis of the short-term trend is done on a daily basis with the help of hourly charts. It is an important adjunct to the analysis of daily and weekly charts which discusses the course of longer market trends.
A Final S/T Push?
Market Overview
The short-term top anticipated in the last newsletter did not disappoint and SPX retraced fifty-two points, assisted by the minor cycle which was due to make its low last week, and arrived on Wednesday. It is important to note that a similar cycle only caused a pull-back of thirty-two points on June 16. Last week’s deeper set-back of fifty-two points represents deceleration in the current uptrend, warning us that a larger cycle is beginning to roll over, which fits in with our expectation that we are about to resume the downtrend into August-September before long.
With the minor cycle having made its low and providing upward lift to prices, it is now a question of whether we are now heading for a slightly new high, or will simply retest the 2064 high reached on the last up-thrust. Enough congestion was produced at last week’s low to take the index up to about 2995-3000. With the market closing strong on Friday, and IWM leading the other indexes, it is likely that the current budding uptrend will first blossom before fading in the next few days.
I mentioned earlier that the market action had nullified a previous EWT structure which called for a zig-zag correction, but the current market pattern has not eliminated the possibility of this still being another form of a large corrective formation! I’ll leave it to the EWT experts to render final judgment, but until the index does more than make a pip-squeak new high, the danger of a severe retracement is still present.
Technical Analysis (Charts appearing below are courtesy of QCharts.)
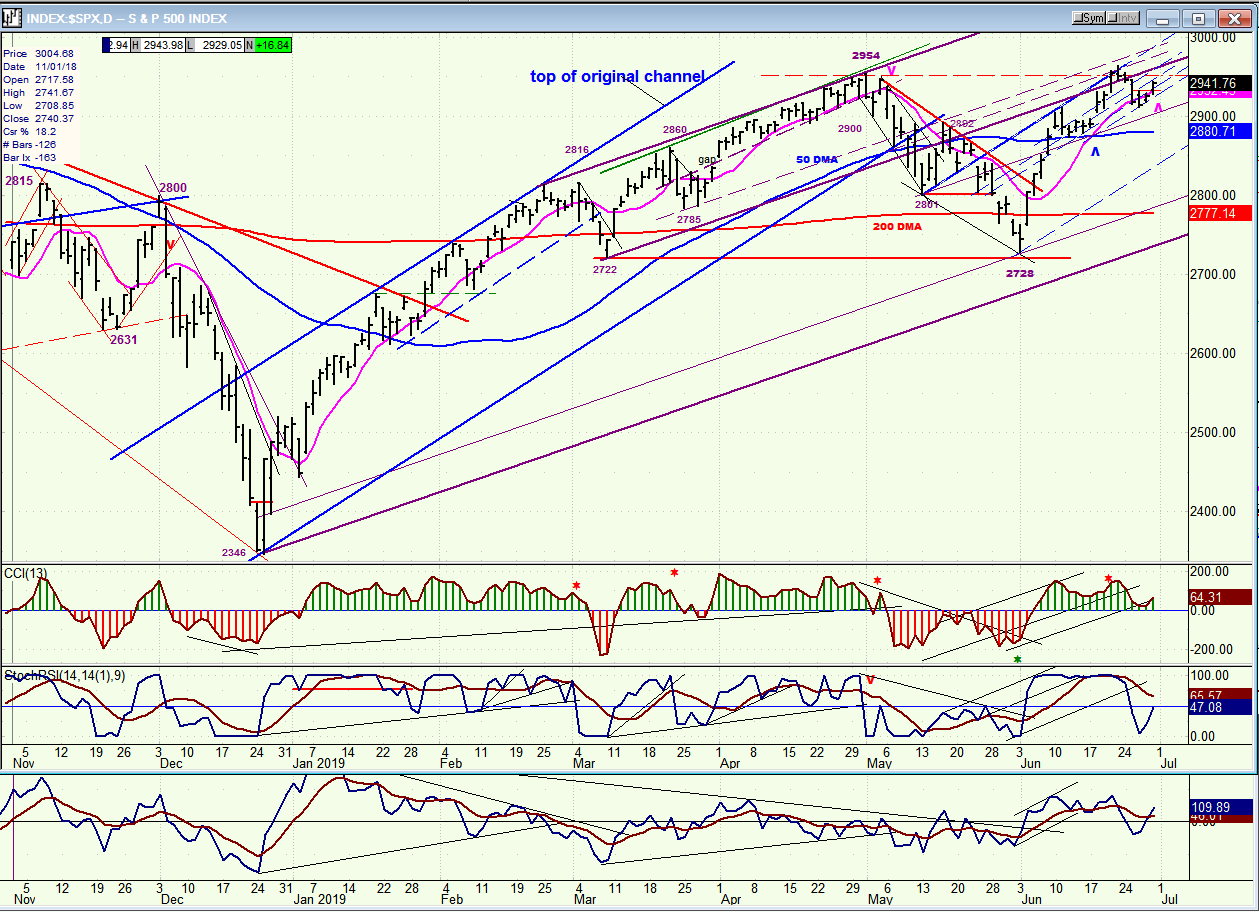
SPX daily chart
You can see how well the trend lines drawn at the top of the rally have contained prices. I expect that this will continue for the next up-thrust. Above, I mention that deceleration was evident because the last pull-back was greater than the first. Even more evident is the fact that the second up-phase of the uptrend, which was ninety points, is far shorter than the first. This means that if we are making an impulse wave from the 2728 bottom, it should top out with a rally which is shorter than 90 points. In other words, the rally would have to come to an end below 3003, which is consistent with the P&F projection. Something else to hang our hat on!
The major premise is that we are still in a large corrective wave and that the index will eventually take us to the vicinity of the 2346 low (or lower) before we resume our long-term uptrend. But for now, since we have already made a new all-time high – and are probably ready to make another – let’s look at the current pattern! Since we came out of the original blue channel, we seem to have morphed into a wider, less steep, purple channel which remains valid as long as we make new highs and stay within its confines. We know (with a certain amount of certainty) that we are about to make a short-term top in the vicinity of SPX 3000. We cannot be sure of what that top will represent until we analyze the subsequent market action, but we do have a pretty good hunch that it will be followed by a decline into the August-September cycle lows, and it will make all the difference in the world if we manage to remain above the lower purple channel line and the 2728 level. The odds of doing this are small at this time, but we will need to drop below 2728 to ascertain that we are still in a major corrective wave
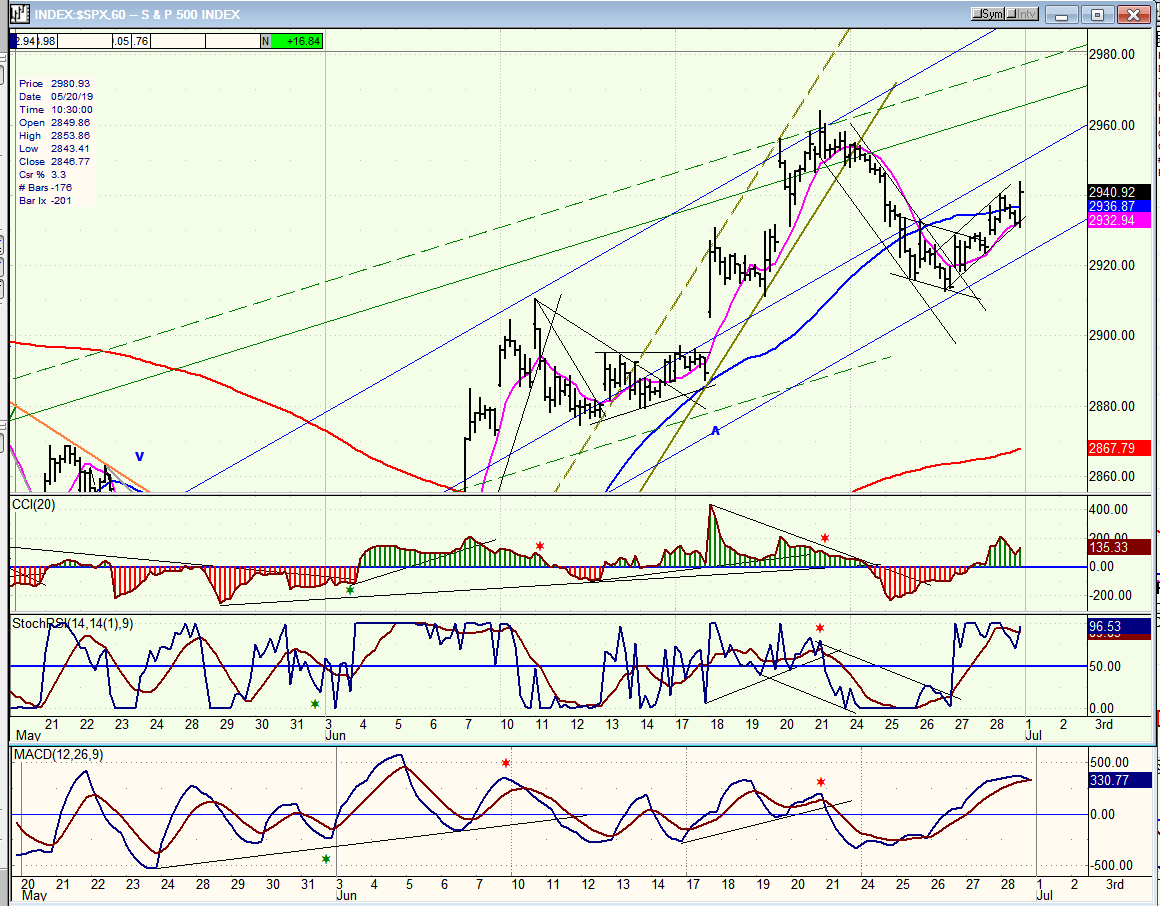
SPX hourly chart
With the minor cycle having made its low last week, it’s a pretty good bet that we’ll keep going up next week, especially since Trump and Xi Jinping have agreed to some sort of a truce in their trade war, however long that is likely to last, because the fundamental disagreements have not and may not ever be resolved completely. But that agreement probably created enough of a catalyst to push the market a little higher in conjunction with cycles and structure (chicken/egg situation).
There are several trend lines shown above! Some of these will be penetrated and some will act as resistance, until we get to the vicinity of the projection and are ready for a reversal. Then, we’ll start breaking trend lines on the downside, including the primary conventional trend line which has not yet been drawn but which, when it is broken, will signal the beginning of the next downtrend. Just keep in mind that when we end this rally, what we start is not likely to be anything minor, but its extent has not yet been determined except in time, since it is likely to continue into August-September. It would be wise not to look for a resumption of the uptrend at least until then, and perhaps until considerably later, depending on how the current structure pans out when it is complete.
Best S/T guesstimate at this time is that we make another slightly new high before we roll over.
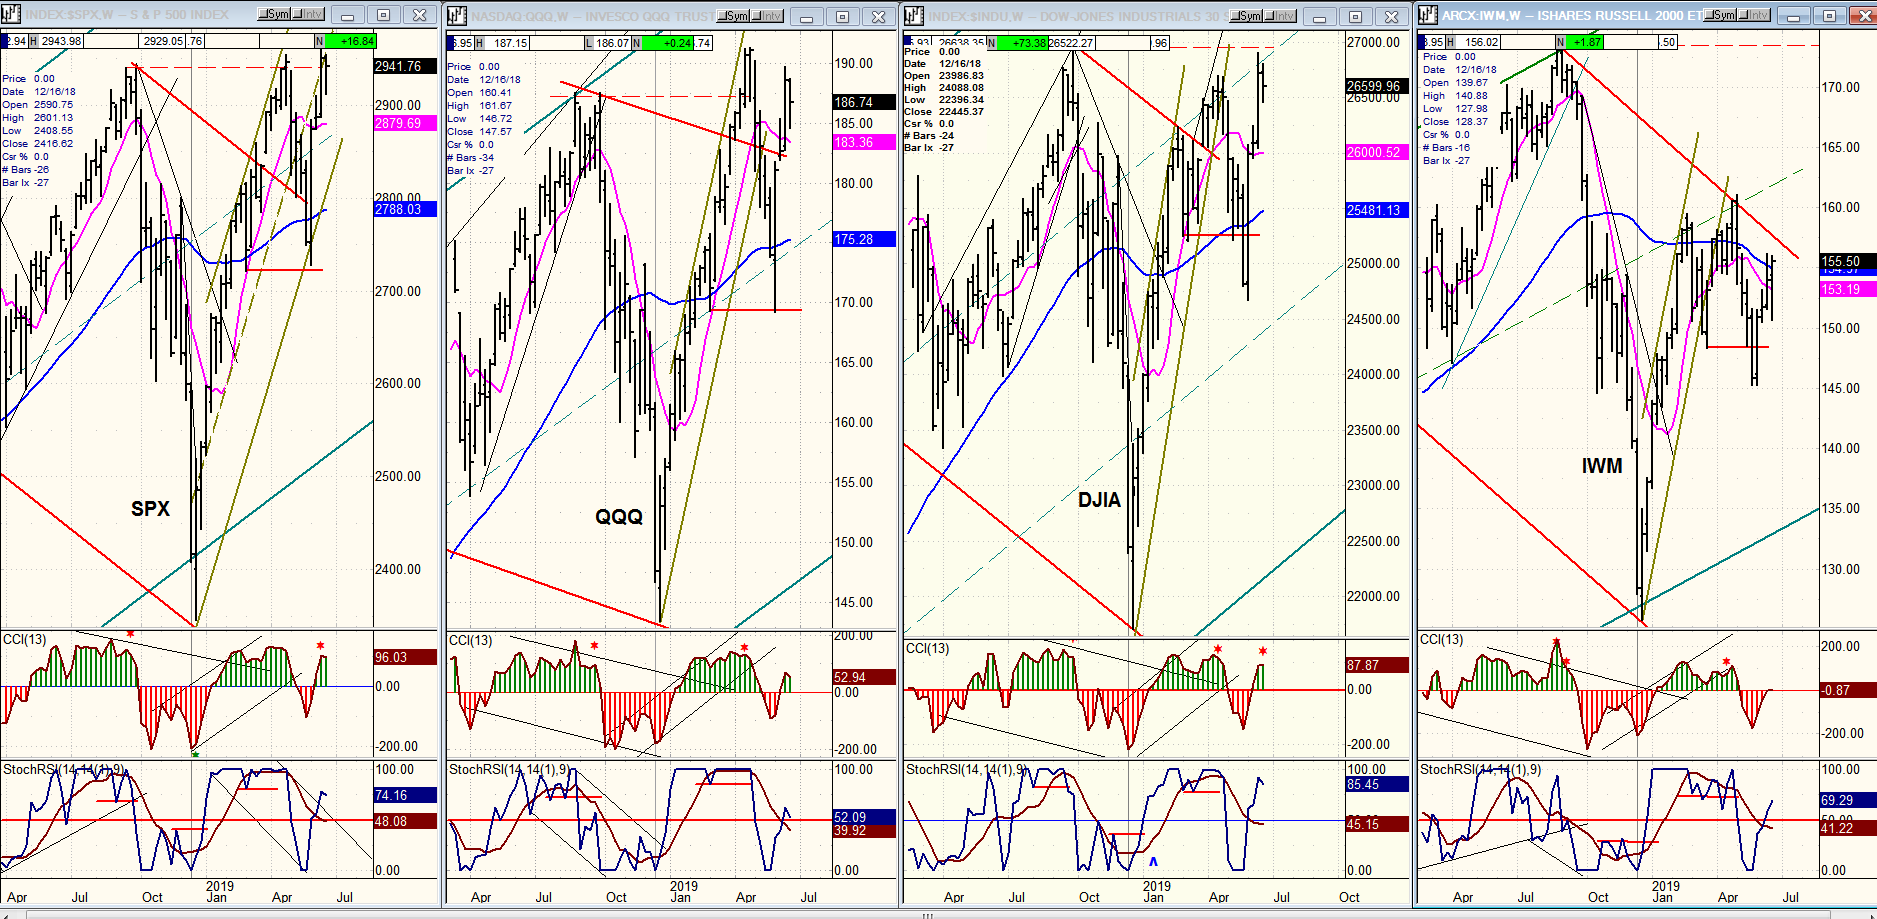
QQQ, SPX, DJIA, IWM (weekly)
I am deeply grateful to the muse which keeps inspiring IWM to lead the rest of the market in all time frames. On the following charts, it is apparent that this index continues to lag severely. It did so in conjunction with DJIA for a period of time, but the latter has since then made a good recovery. Not IWM, which first showed itself to be the leader on the downside last week, and then on the upside. But its statement is clear with regard to the longer term: this market is not ready to resume its long term uptrend in the near future, period!
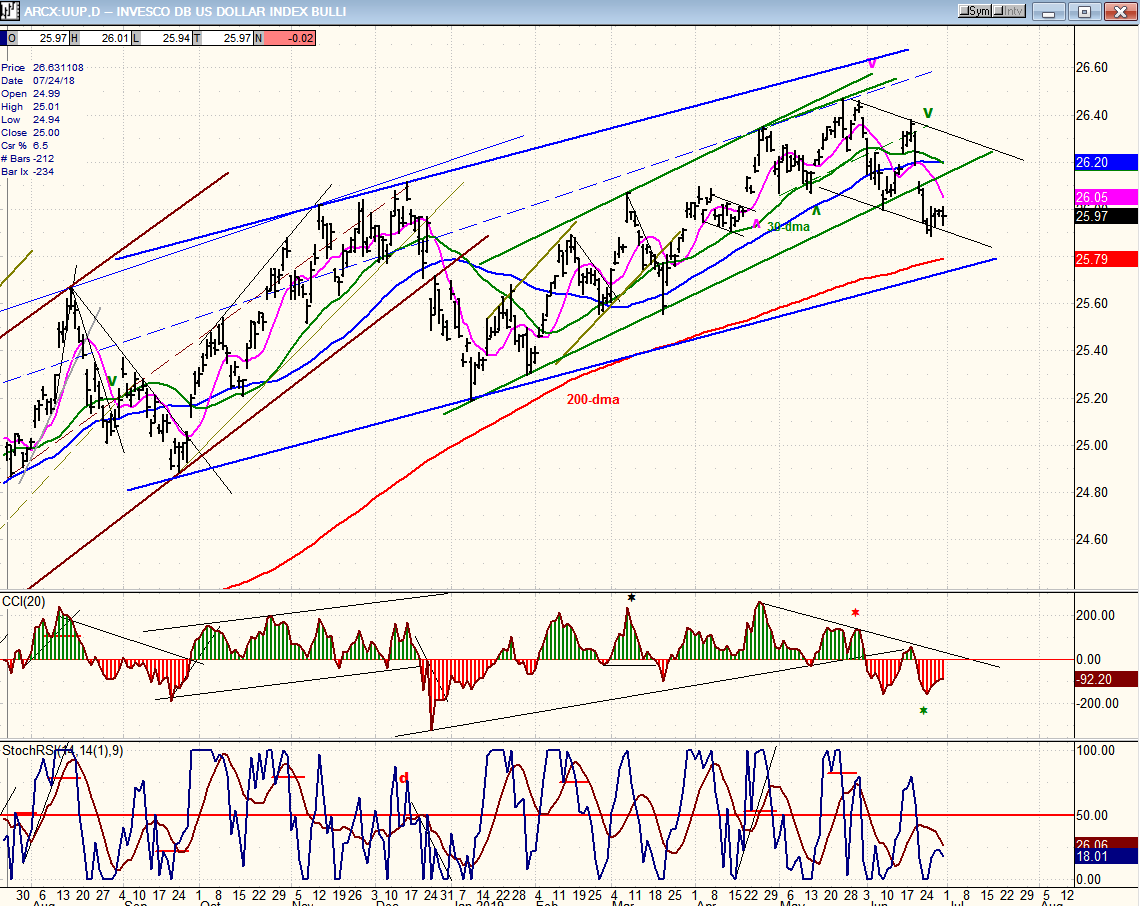
UUP (dollar ETF)
UUP did find some support on the lower minor channel line. It has not had much of a bounce, but that could still be ahead of us. Normally, one would expect a retracement to about the middle of the channel, even in an index which shows weakness by remaining below all three MAs.
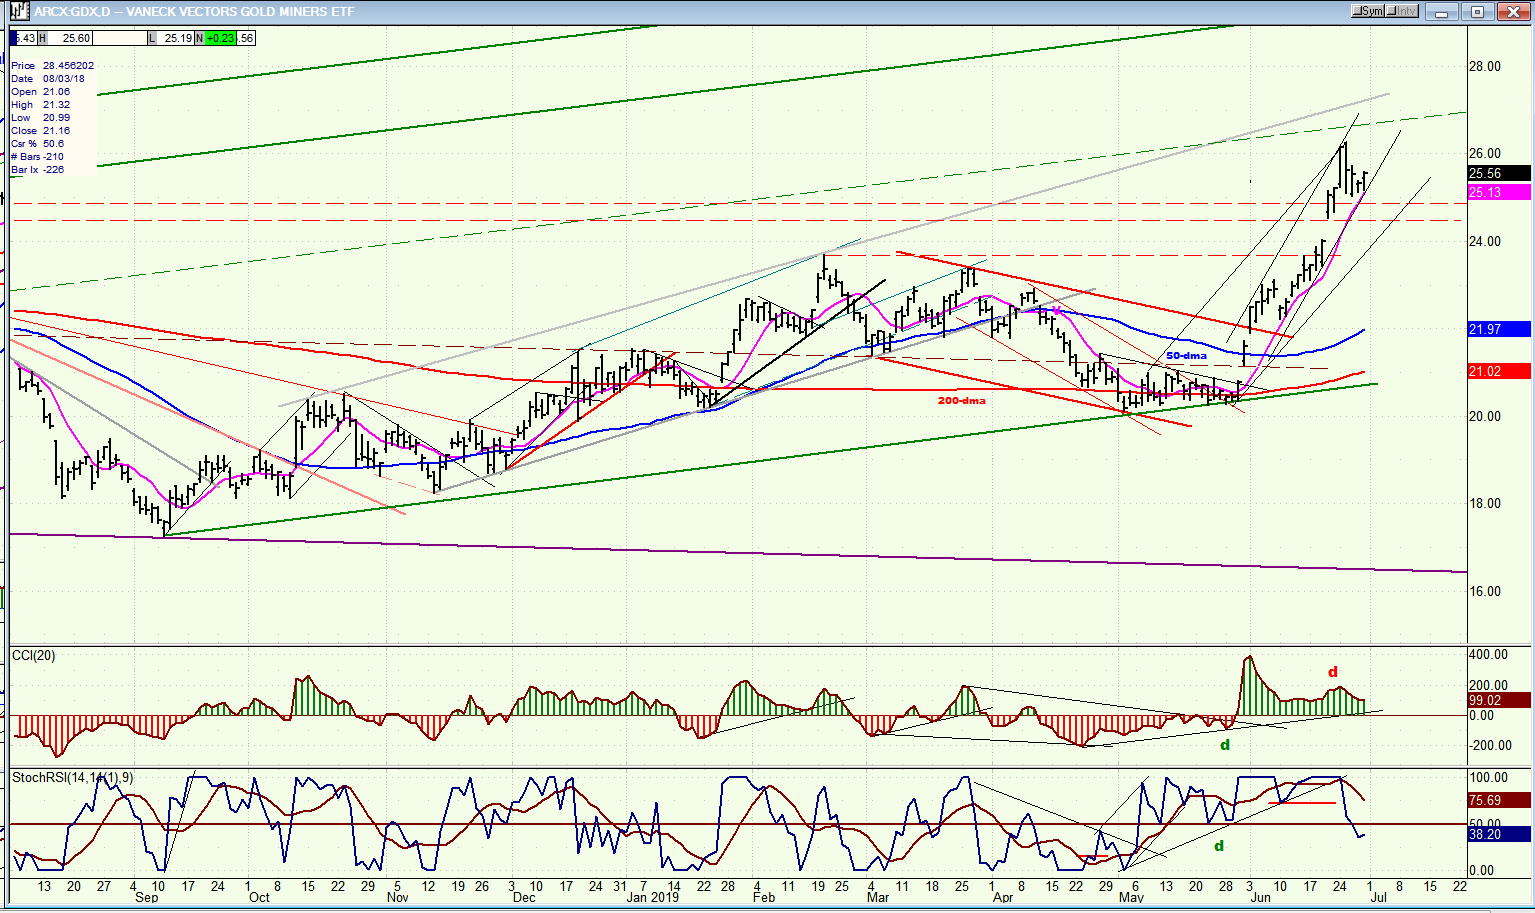
GDX (Gold miners ETF) daily
After a strong breakout above the base line, GDX is consolidating. If no serious selling takes place over the next week, it could make another push to its next projection target of ~28 before engaging in a deeper and more prolonged correction.
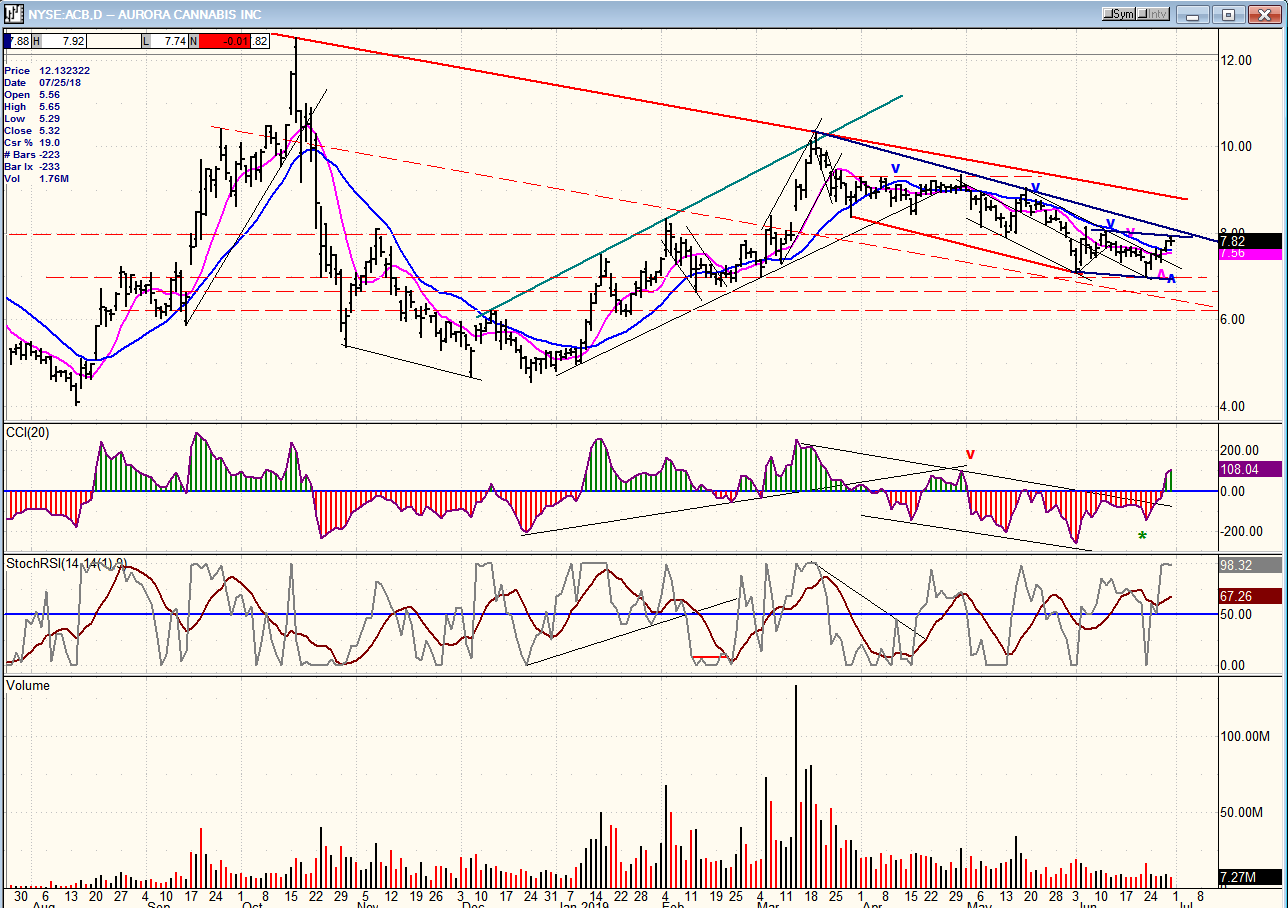
ACB (Aurora Cannabis) daily
Aurora is looking better and may be putting an end to its consolidation period. After an initial low and retest of that low, it bounced back up to the top of a short base. As long as both oscillators remain strongly positive, I believe that the stock could break above its purple trend line and move up to the red one before more consolidation takes place.
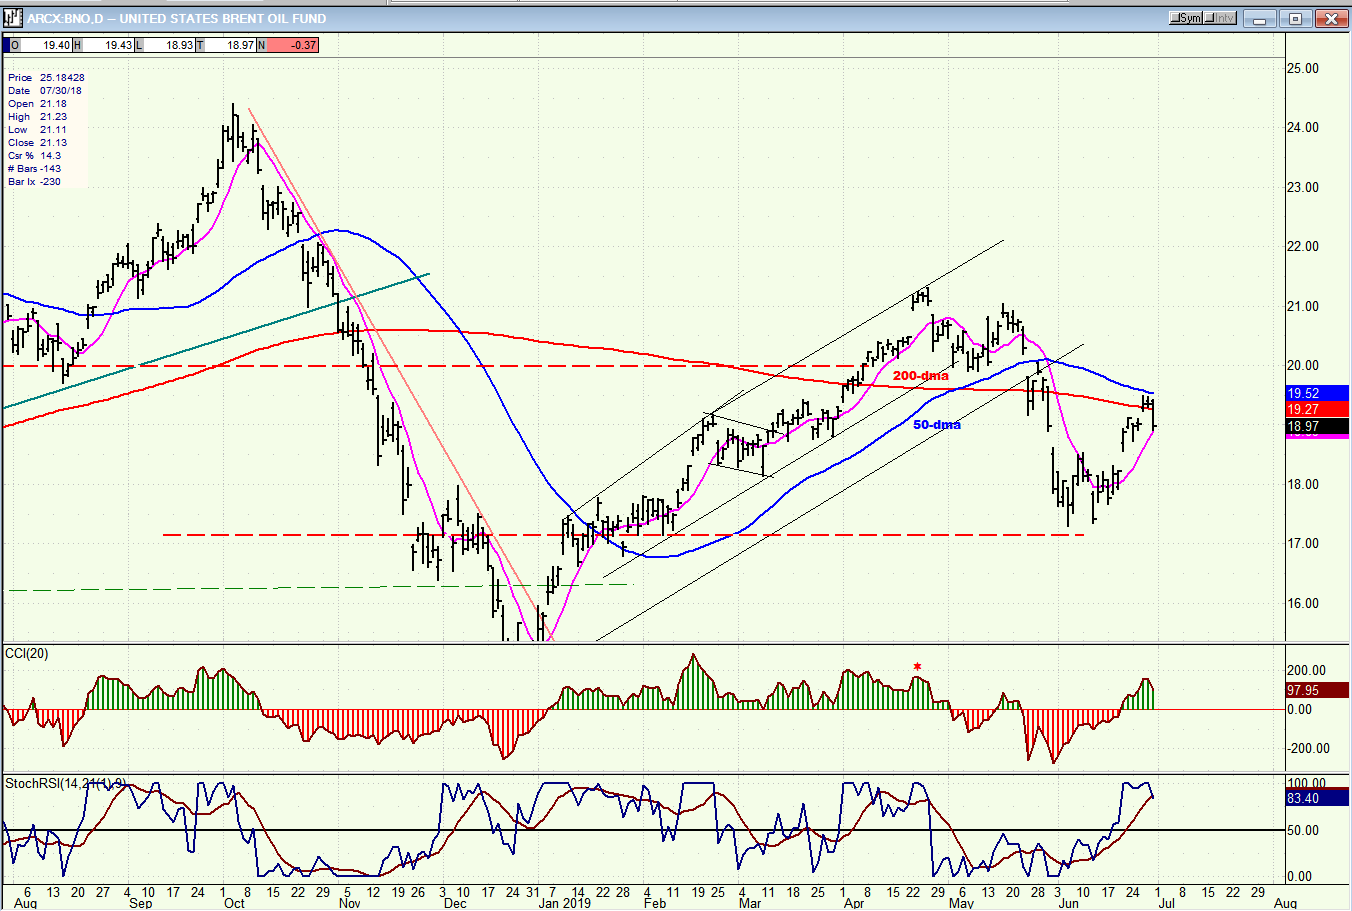
BNO (U.S. Brent oil fund) daily
BNO found resistance where expected and was pushed back below both MAs. It may retest the top of the minor trend before more of a pull-back.
Summary
The minor cycle which bottomed last week is providing the lift necessary to push the index to the vicinity of 3000 and to complete the move from 2728 before a more protracted decline takes hold.
FREE TRIAL SUBSCRIPTON
With a trial subscription, you will have access to the same information that is given to paid subscribers, but for a limited time period. I think you will find that knowing how far a move can carry is one of the most useful benefits of this service, whether you are a trader or an investor -- especially when this price target is confirmed by reliable indicators which give advance warning of a market top or bottom. Furthermore, cycle analysis adds the all- important time element to the above price projections.
For a FREE 4-week trial, further subscription options, payment plans, and for general information, I encourage you to visit my website at www.marketurningpoints.com.
The above comments about the financial markets are based purely on what I consider to be sound technical analysis principles. They represent my own opinion and are not meant to be construed as trading or investment advice, but are offered as an analytical point of view which might be of interest to those who follow stock market cycles and technical analysis.
*********

When Andre Gratian was a stock broker years ago, a friend introduced him to technical analysis of the market. Consequently, it is not an exaggeration to say that Andre fell in love with this approach! Ever since then, it has become an increasingly important part of his professional life. Gratian has studied the works of Wyckoff, Edwards & Magee, Edward J. Dewey (cycles) and many others. However, one of my most profitable undertaking has probably been to study Point & Figure charting, which he finds invaluable in analyzing stocks and indices. If he were restricted to one methodology, this is the one that he would choose. This well-rounded background has given him what he feels to be a special insight into the stock market, facilitating the recognition of meaningful patterns and the ‘turning points’ in all trends, whether they be short or long term. Andre feels very comfortable discussing the stock market and passing on meaningful information to others. His subscribers include individuals and money managers throughout the world. Moreover, his Newsletters are currently published on several financial sites, here and abroad.


