Technical Analysis Of The Markets


Current Position of the Market
SPX: Long-term trend – Final long-term phase on the way? How much longer, is the question.
Intermediate trend – We have started a correction of intermediate nature.
Analysis of the short-term trend is done on a daily basis with the help of hourly charts. It is an important adjunct to the analysis of daily and weekly charts which discusses the course of longer market trends.
Still Treading Water
Market Overview
News that trade talks are set to resume in October (this time for real) drove the SPX to 2885, breaking above the previous consolidation highs by about 40 points. This move, which was anticipated as possible by some EWT analysts, does not alter significantly the market condition unless the short-term trend extends much higher. The high of the move came on Thursday with the opening thrust, and the index was not able to surpass it during the next two days of trading. Nor has it given much ground with prices locked in a narrow 13-point range. Clearly, more time will have to pass before we can determine the direction of the future short-term trend. As for the longer-term trend, it is not likely that it can make much more upside progress until after the 40-week cycle has made its low. More scrutiny into the phases of this important cycle places the next bottom between early and mid-October.
With shorter-term prices gyrating back and forth, it has been difficult to appraise longer-term market trend. We will therefore take a look at the weekly chart to see if we can get a better perspective about what lies ahead.
Market Analysis (The following charts are courtesy of QChart)
SPX weekly chart
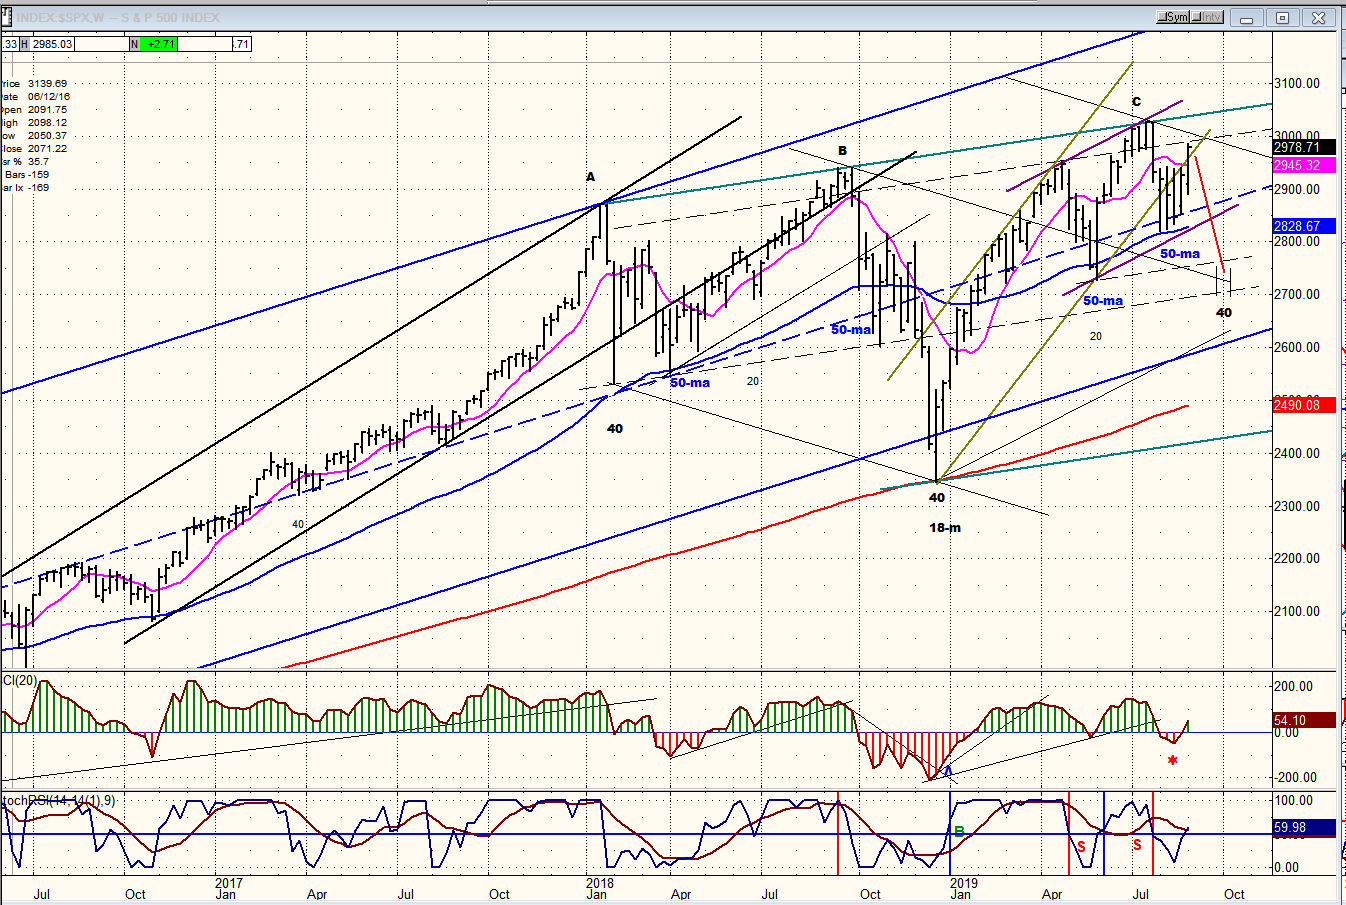
I started my analysis by drawing the long-term price channel from 2009, as well as the mid-channel line. This give us the foundation to make sense of the price movements which have taken place over the last 18 months. Since the January 2018 climactic top, there has been a lot of volatility, probably caused by the rise and fall of the 40-wk cycle which made a low in early April 2018, the next in January 2019, and has the next one ostensibly due in mid-October. Of the three highs which occurred during this period, only the first reached the top of the channel. I have connected them with a green line and they point to long-term deceleration.
There are good reasons why last week could have been the high of the move, especially if the cycle analysis is correct. The decline into 2346 stopped slightly below the channel bottom, on the 200wk MA. Since that low, the index has risen once again to the green line which connects the three tops before reversing. The uptrend from 2346 has also created a pink channel which is somewhat different from the purple channel drawn on the daily chart. Prices traded outside of the pink channel for a month, but found support and have rallied.
If the rally continues and takes the index through the resistance which starts at 2985, and it goes beyond the green trend line which connects the three previous highs at points A-B&C, we will have to assume that the long-term trend has resumed and that point C, which is also estimated to be the top of wave 3 of the bull market, is therefore incorrect labelling. The next few days are important since they will tell us where we go from here; but if the cycle analysis is correct and the 40-week cycle low is due next month, it is highly unlikely that we can keep going and make a new high. The P&F pattern does allow for a possible move into the low 3000s .
Before analyzing the 60-m chart, I want to discuss a couple more features of the weekly chart. I have already pointed out how the (red)200-ma stopped the decline at 2346. I now want to focus on the (blue) 50-ma. Notice how it has acted as support for prices, including the last pull-back when SPX tried several times, but could not go below it. Note also that each time the index has found support on the 50-ma, it was also at or near the (dashed) mid-channel line. The only time it went below was when it was pulled lower by the 40-wk cycle (in conjunction with the estimated 18m cycle low). In view of its current position relative to the 50-ma and the mid-channel line, a break below 2830 will be a clear statement that we are on our way to retest the lower long-term channel line (~2650).
Even better, if SPX falls back below 2945, which is the level of the pink 9-ma which was just penetrated on the upside, it will greatly enhance the odds that 2830 will be next in line to give way. If we do reverse from here and decline into the suggested cycle low, I will have plenty more to say about the course of the market over the next few months; but for the time being, let’s take it one week at a time.
SPX hourly chart
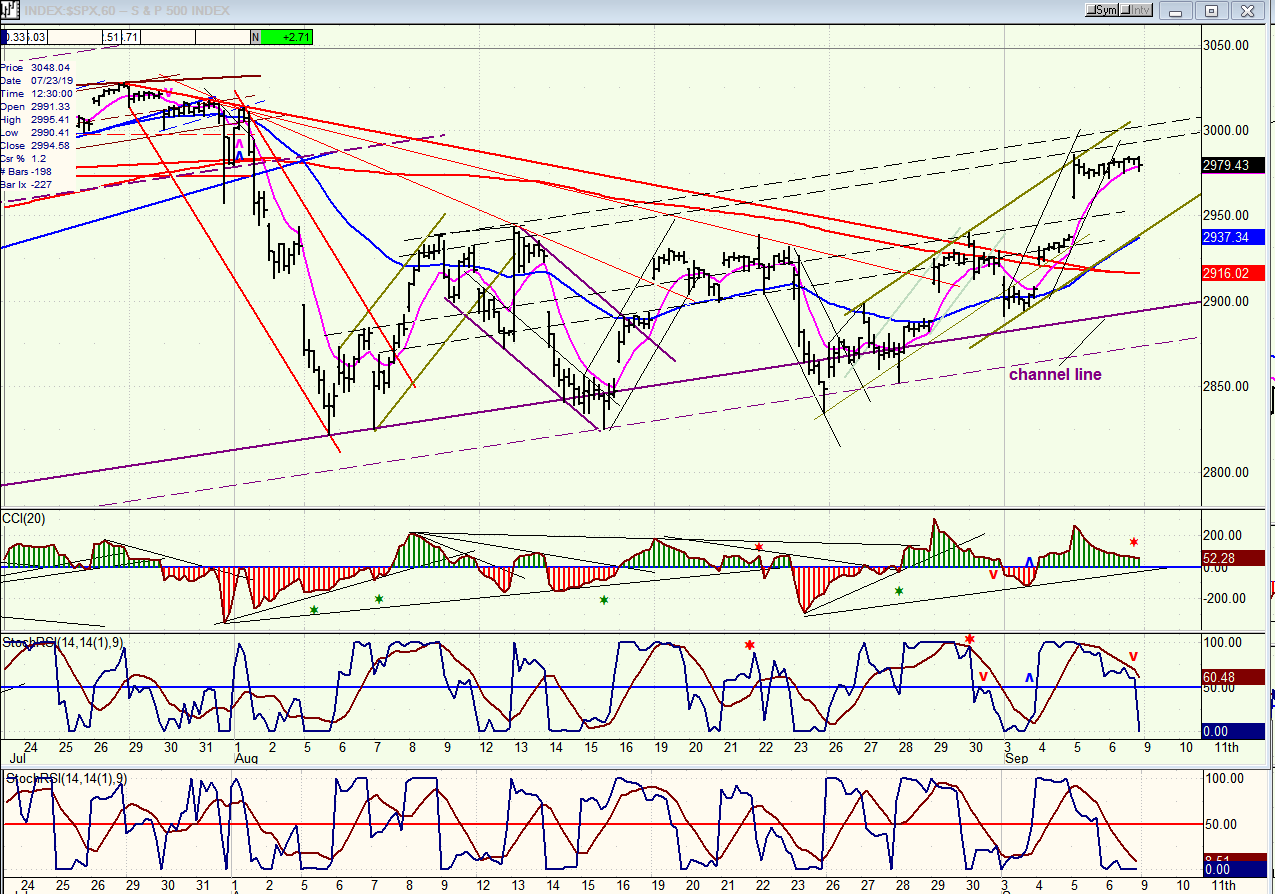
We concluded our analysis of the weekly chart by saying that the next few days of trading will tell us if the index can continue past current resistance and makes a new high, or if it fails to do so. The hourly chart is telling us that there are pretty fair odds that SPX will turn down from 2985. Both SRSIs (price and A-Ds) have already given a short-term sell signal but, although negative divergence has
already developed in the CCI, the indicator has not yet confirmed the sell by going negative. The index will also have to trade outside of the lower short-term channel line, which is being tracked perfectly by the 50-hr ma. Should this be accomplished over the next few days, it would be a strong statement supporting the accuracy of our 40-wk cycle analysis.
QQQ, SPX, DJIA, IWM (weekly)
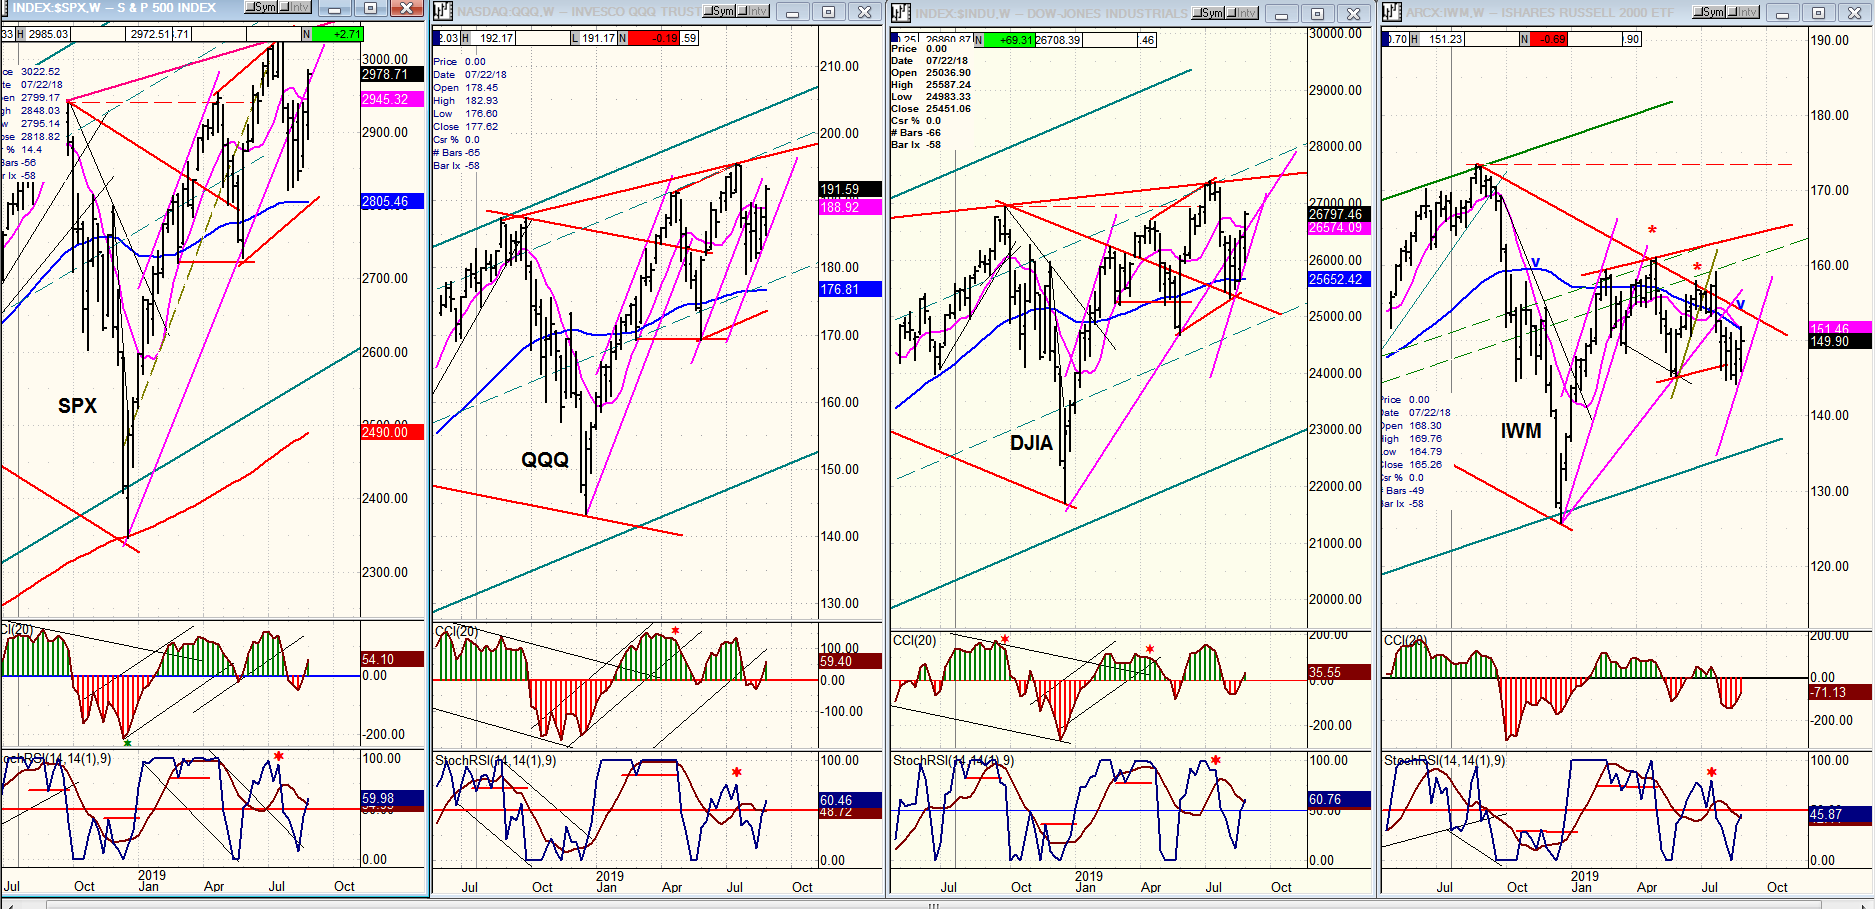
All four indexes rallied this past week. The strongest three broke out above their recent correction patterns. IWM did not. So, what’s new? Nothing! Until the latter shows some real strength, the current market action remains corrective and the next direction is not likely to be up.
UUP (dollar ETF) daily
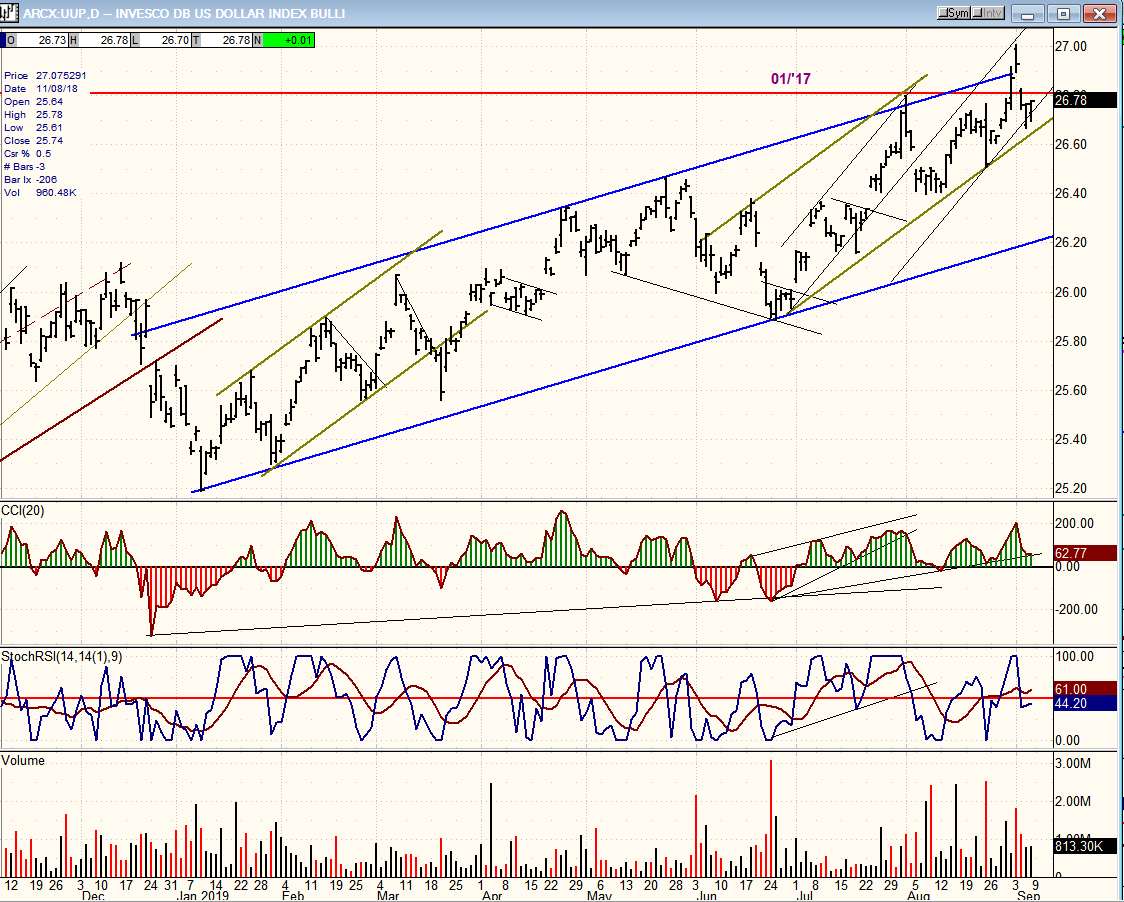
UUP extended its uptrend beyond the 01/’17 high, but immediately retraced below. This is not the kind of action that suggests an extension to the current uptrend. Instead, the chart has once again the appearance of an overbought condition more likely to start a correction instead of pushing higher. This will become more apparent if the index can move outside of the green channel.
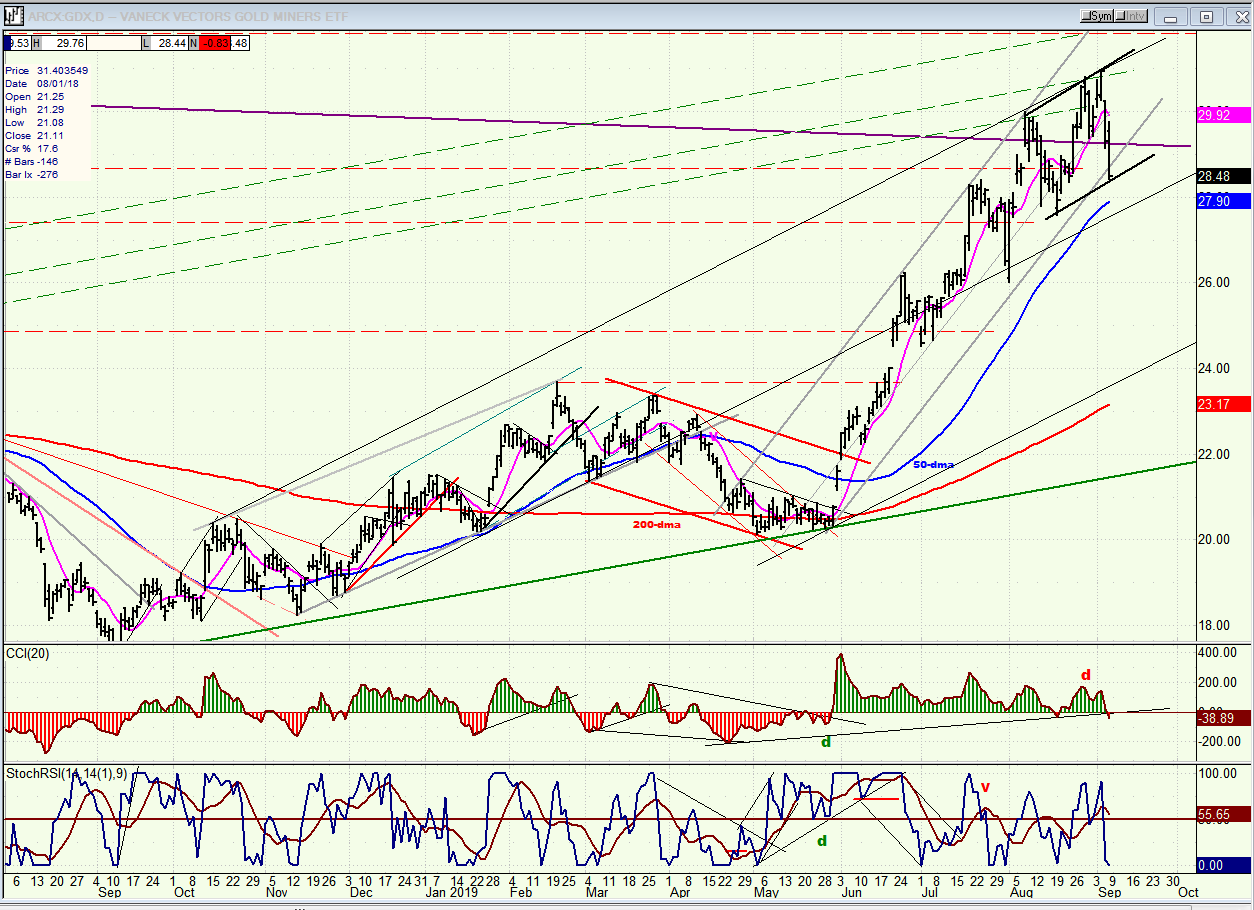
GDX (Gold miners ETF) weekly
Last week, I mentioned that the deceleration pattern appearing in GDX was suggestive of some corrective action ahead. This is what has happened since, and the index needs to hold this level or risk retracing to about 27-27.50 in what would be a normal digestion process of the recent uptrend.
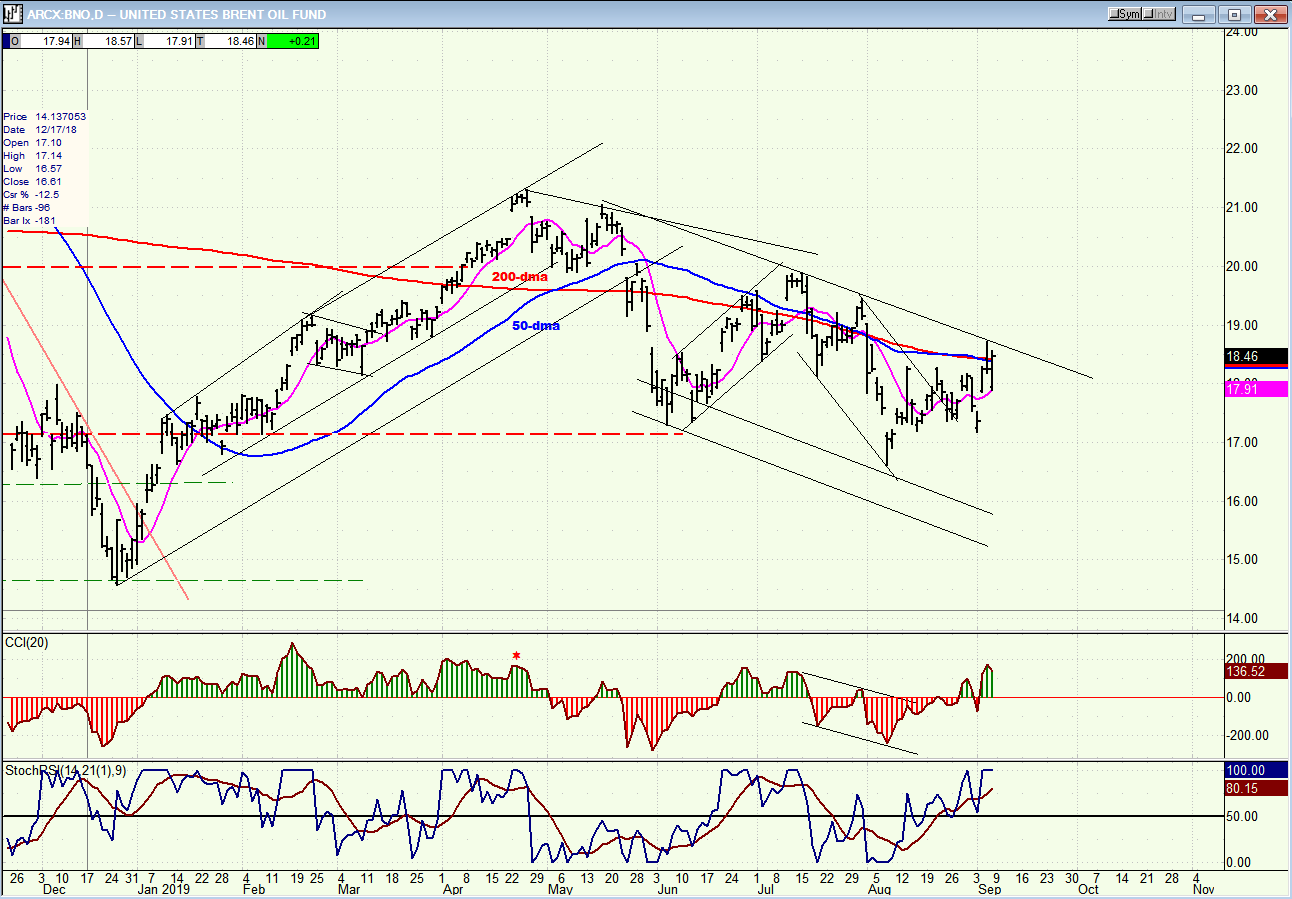
BNO (U.S. Brent oil fund) daily
BNO has rallied with the market, and reached the top of its corrective channel. Its continued progress will be dependent on additional market strength.
Summary
With last week’s rally, SPX has reached a critical level. Continued strength to a new high would suggest that the longer term trend has resumed. There is no real evidence that this about to take place, and next week’s action is expected to clarify the index’s position.
FREE TRIAL SUBSCRIPTON
With a trial subscription, you will have access to the same information that is given to paid subscribers, but for a limited time period. I think you will find that knowing how far a move can carry is one of the most useful benefits of this service, whether you are a trader or an investor -- especially when this price target is confirmed by reliable indicators which give advance warning of a market top or bottom. Furthermore, cycle analysis adds the all- important time element to the above price projections. For a FREE 4-week trial, further subscription options, payment plans, and for general information, I encourage you to visit my website at www.marketurningpoints.com.
The above comments about the financial markets are based purely on what I consider to be sound technical analysis principles. They represent my own opinion and are not meant to be construed as trading or investment advice, but are offered as an analytical point of view which might be of interest to those who follow stock market cycles and technical analysis.
********

When Andre Gratian was a stock broker years ago, a friend introduced him to technical analysis of the market. Consequently, it is not an exaggeration to say that Andre fell in love with this approach! Ever since then, it has become an increasingly important part of his professional life. Gratian has studied the works of Wyckoff, Edwards & Magee, Edward J. Dewey (cycles) and many others. However, one of my most profitable undertaking has probably been to study Point & Figure charting, which he finds invaluable in analyzing stocks and indices. If he were restricted to one methodology, this is the one that he would choose. This well-rounded background has given him what he feels to be a special insight into the stock market, facilitating the recognition of meaningful patterns and the ‘turning points’ in all trends, whether they be short or long term. Andre feels very comfortable discussing the stock market and passing on meaningful information to others. His subscribers include individuals and money managers throughout the world. Moreover, his Newsletters are currently published on several financial sites, here and abroad.


