Technical Analysis Of The Markets


Current Position of the Market
SPX: Long-term trend – Final long-term phase on the way? How much longer is the question.
Intermediate trend – We have started a correction of intermediate nature.
Analysis of the short-term trend is done on a daily basis with the help of hourly charts. It is an important adjunct to the analysis of daily and weekly charts which discusses the course of longer market trends.
Looking Toppy
Market Overview
Last week was the first time since the beginning of the rally from SPX 2835 that indicators displayed negative divergence at hourly, daily and weekly levels simultaneously. This is a serious warning that the significant correction that I have been anticipating—I should say “we” because I am not the only qualified analyst to share this view – may be about to start. Judging by the condition of the hourly indicators, this correction could begin as early as Monday -- even ahead of the FOMC meeting at which FED fund rates are expected to be lowered.
There is another compelling reason to heed this warning: half a dozen cycles -- some minor, some important -- are scheduled to make their lows between now and ~October 15, culminating with a 40-wk cycle low. I am not prepared to give a downside target for this correction, because the way the cycles are structured, the initial downtrend could be followed by another short period of distribution, after which the P&F chart will be able to give us a more reliable count for the extent of the downtrend.
After the powerful up-phase from 2346 to 2954 which peaked in late April, SPX began a large pattern of deceleration which has taken the form of a rounding top. If the last high of 3028 is not exceeded, and if my interpretation of what will take place over the next month or so is correct, we could already have seen the high of this pattern. Typically, we would then see a minor decline, followed by a rally which would also fail to make a new high before the downtrend begins to accelerate. The resulting correction could even eventually go beyond the low of the 40-wk cycle. That will depend on the market action after that down-phase has been completed. This is only looking ahead and not something cast in stone, but there is evidence that some very large, long-term investors are already engaged in defensive measures.
Market Analysis (The following charts are courtesy of QChart)
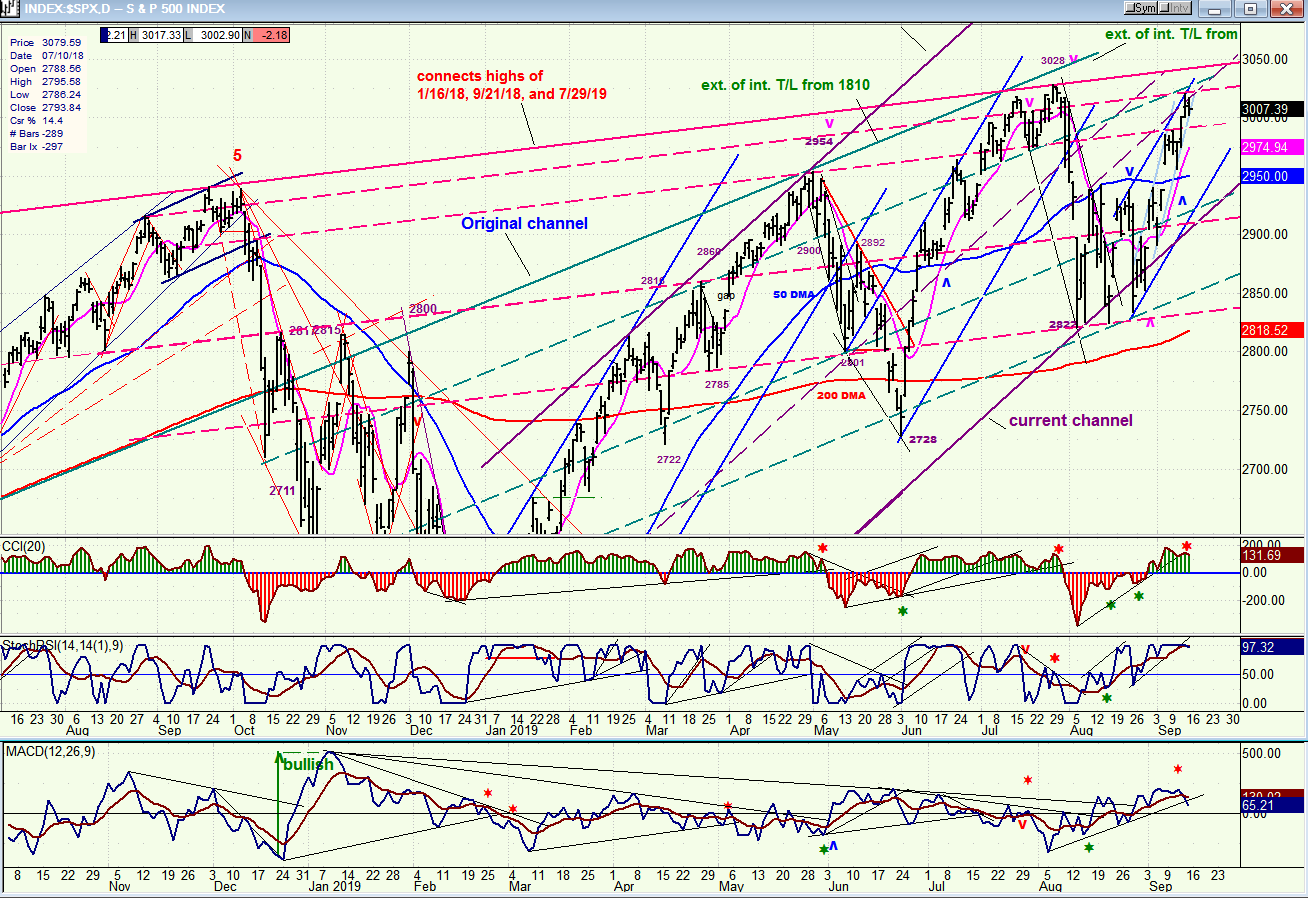
SPX daily chart
Last week I posted a weekly chart of the index. This week I go back to the daily chart which gives us a better view of what is happening short-term. Let’s start with what I pointed out last week! The most important trend line on this chart is the red trend line at the top. It connects the three tops which are mentioned and, since it has become a line of demarcation for the market, what SPX does in the next few days is extremely important. If it goes above that line, it will be a bullish sign, suggesting that the longer-term trend is continuing. On the other hand, if it does not, it can suffer a significant set-back. Since we are now within reach of that trend line, the choice is clear and it is imminent.
This is why the negative divergence which has begun to appear on the oscillators below cannot be ignored, since it is a warning that we are not likely to go through the red line, but will turn back down instead. The price action itself is exhibiting the same negative behavior. Besides the fact that the Fear and Greed index is bearish for the market, SPX has risen to a point where it is hitting the resistance caused by a conjunction of several parallel lines which is already having an effect. Friday’s trading remained within the confines of Thursday’s range, and the index looks ready to trade outside of a narrow channel which could pull it down. That alone, if it occurs, would only make the negative divergence of the indicators even worse, and could push the lowest one, the A-Ds oscillator (which normally tends to lead the market), into the red. Finally, as I mentioned earlier, a nest of cycle lows should form between now and mid-October and spell trouble for the market bulls.
Nevertheless, in spite of the warning initiated by all these potential bearish forces directly ahead, we must acknowledge that we don’t even have a smidgen of confirmation, yet! The index is still above not only the 50-dma, but the 9-dma as well. So, until the market’s action begins to confirm this nascent apocalypse, a little more patience will be required.
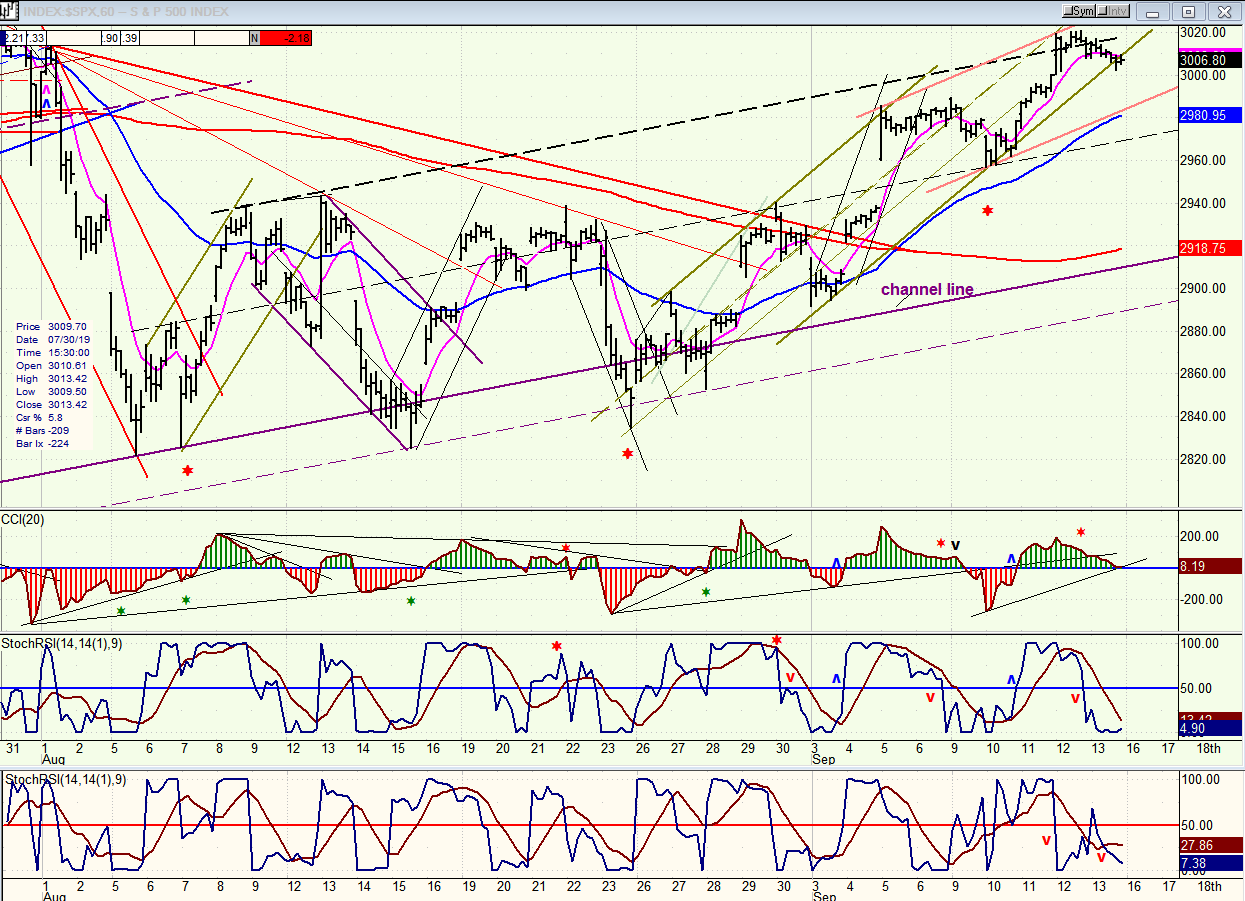
SPX hourly chart
If we are looking to the hourly chart to contradict what the daily is saying and make us more optimistic, we are going to be disappointed.
In the past few weeks, I got off track with the minor cycle which normally averages 10-11 trading days, but it sometime becomes erratic and difficult to follow. After a lot of deliberation, I believe that it has recaptured its normal rhythm, with the next low due on 9/24. If correct, and if it is already topping as suggested by the oscillators below, (two of which have already given a sell signal, with the third one on the verge of moving into negative territory) such an early top in this cycle (significant left translation) is an indication that larger cycles are already pressing down on it.
The market action shown on this chart suggests that if the minor cycle is turning down from here, the intermediate channel line from 2346 -- which held on three separate occasions and caused the recent rally – is about to be tested again and, if it gives way this time, we have confirmation that we are heading into the 40-wk cycle low by 10/15.
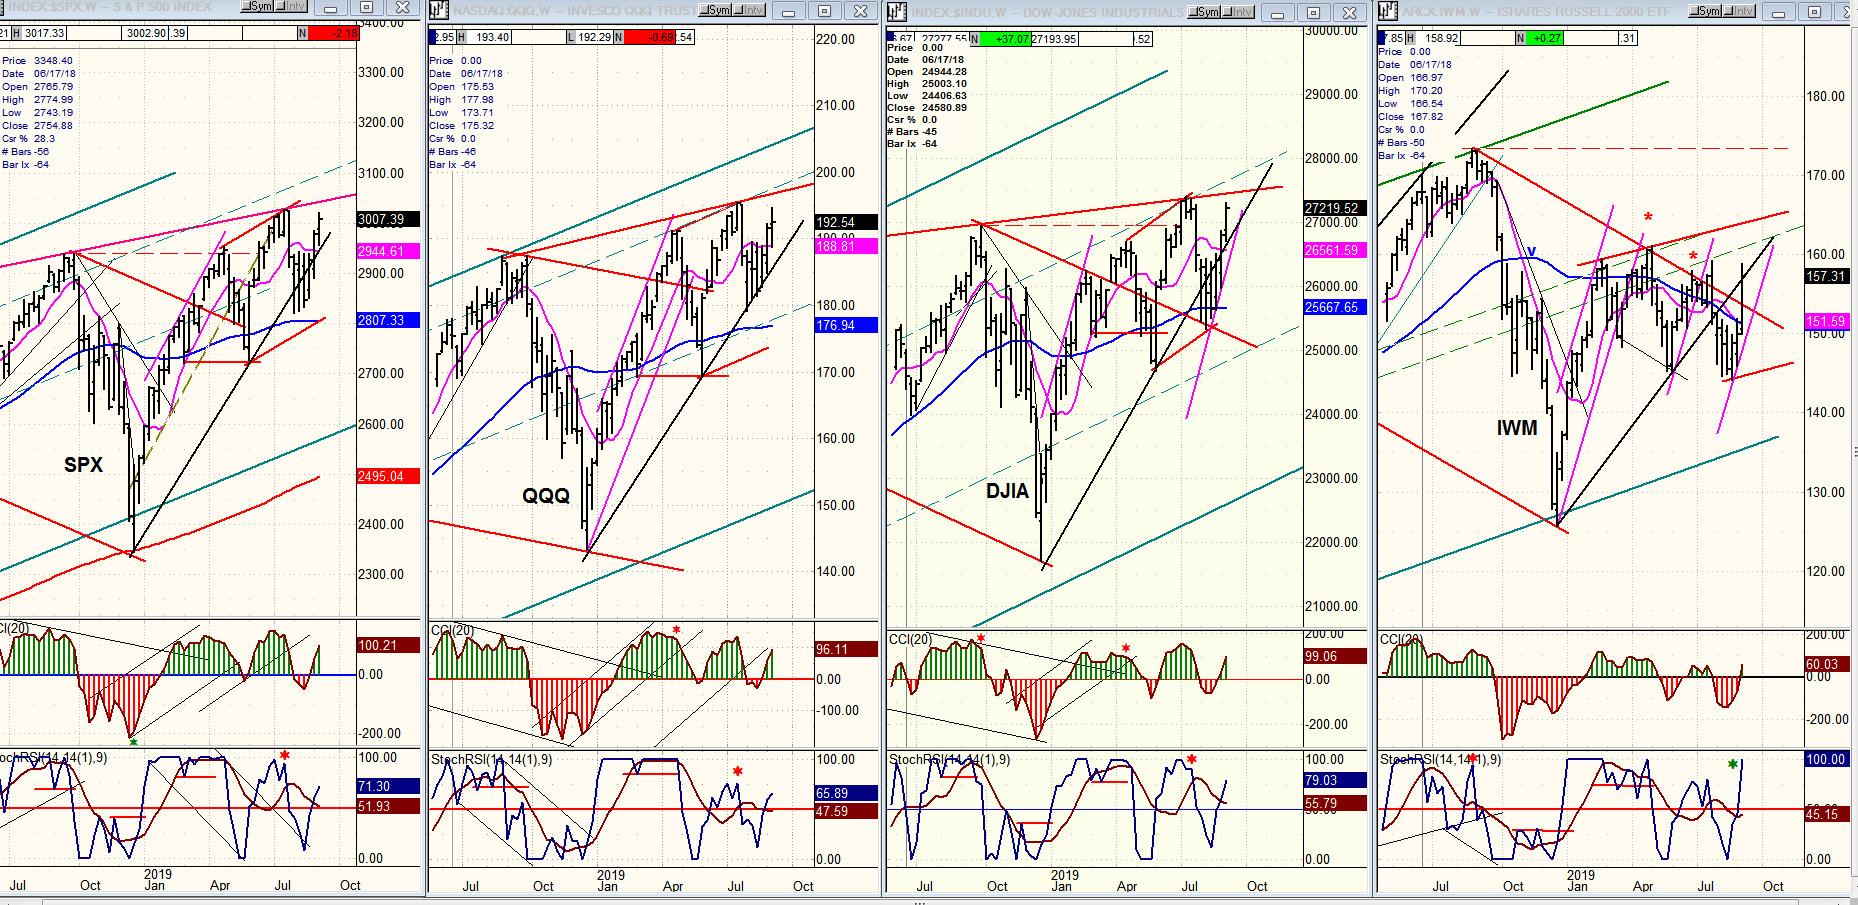
QQQ, SPX, DJIA, IWM (weekly)
IWM led to the upside last week, which is a radical change of mood for this index. However, so far it appears to be only a short, or even near-term condition. As you can see on the chart below, it had fallen so far below the others, that a little catching up was an option. The index had developed a two-phase P&F base, and it quickly reached the first objective of 157-158. If it can follow through, it could reach 162.
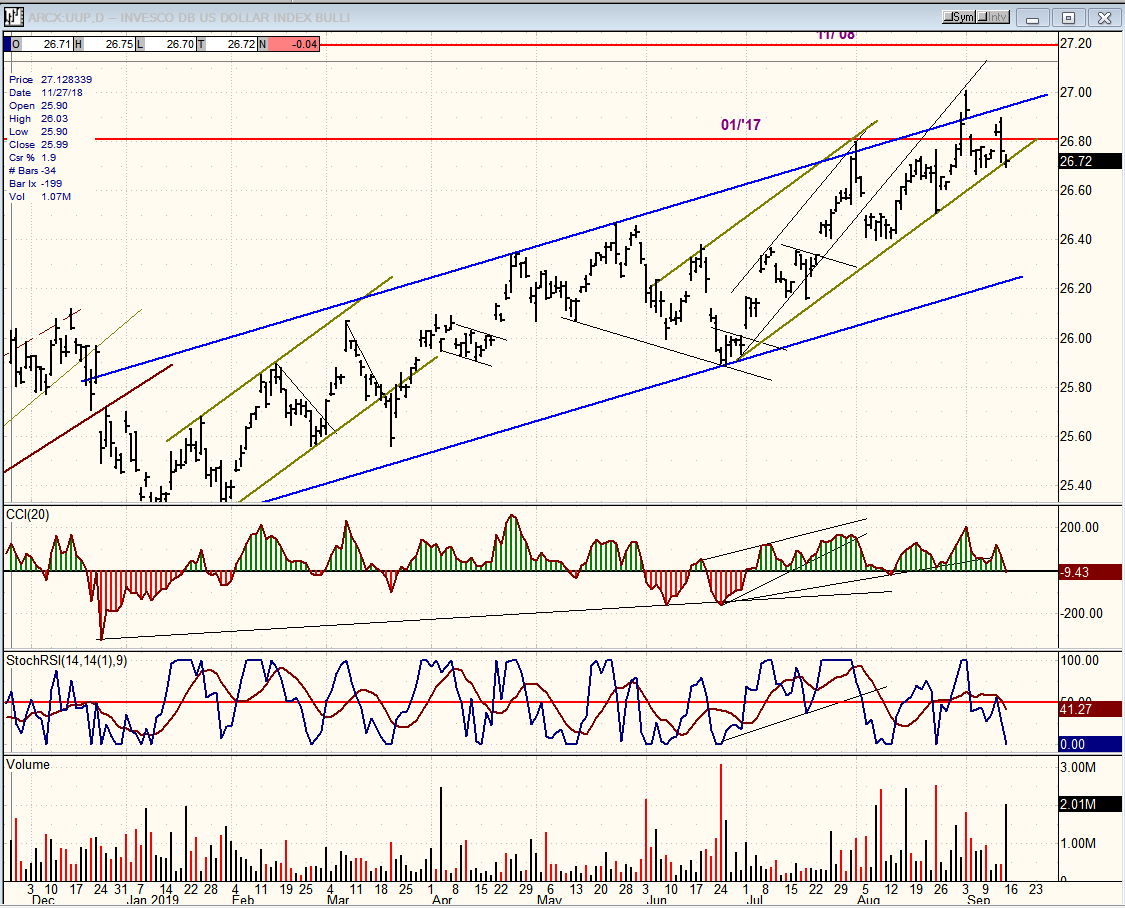
UUP (dollar ETF) daily
UUP appears to have retested its recent high and pulled back. It would not take much to push it outside of its green channel, which could be the start of a correction to the bottom of the blue channel.
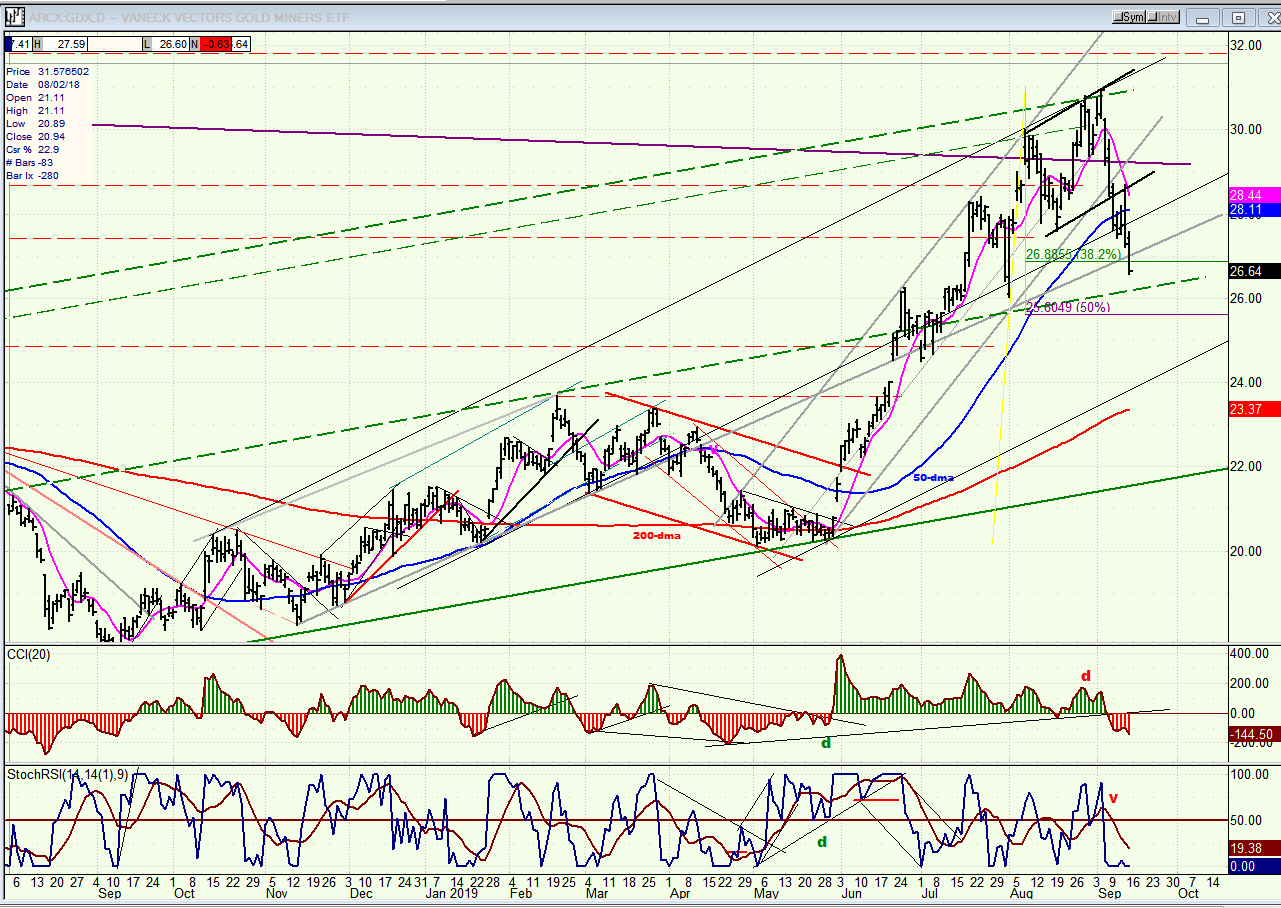
GDX (Gold miners ETF) weekly
Last week, I mentioned that the deceleration process in GDX could result in the first meaningful correction of its recent uptrend. Last week, it went past a .382 retracement and appears to be heading for the 50% level. This would coincide with a near-term P&F target, and this is also where support happens to be.
ACB (Aurora Cannabis) daily
ACB reached its stated target of 5.50 and bounced to 6.50 before pulling back. I suspect that it will now start building a base within its channel before it is ready to move outside of it.
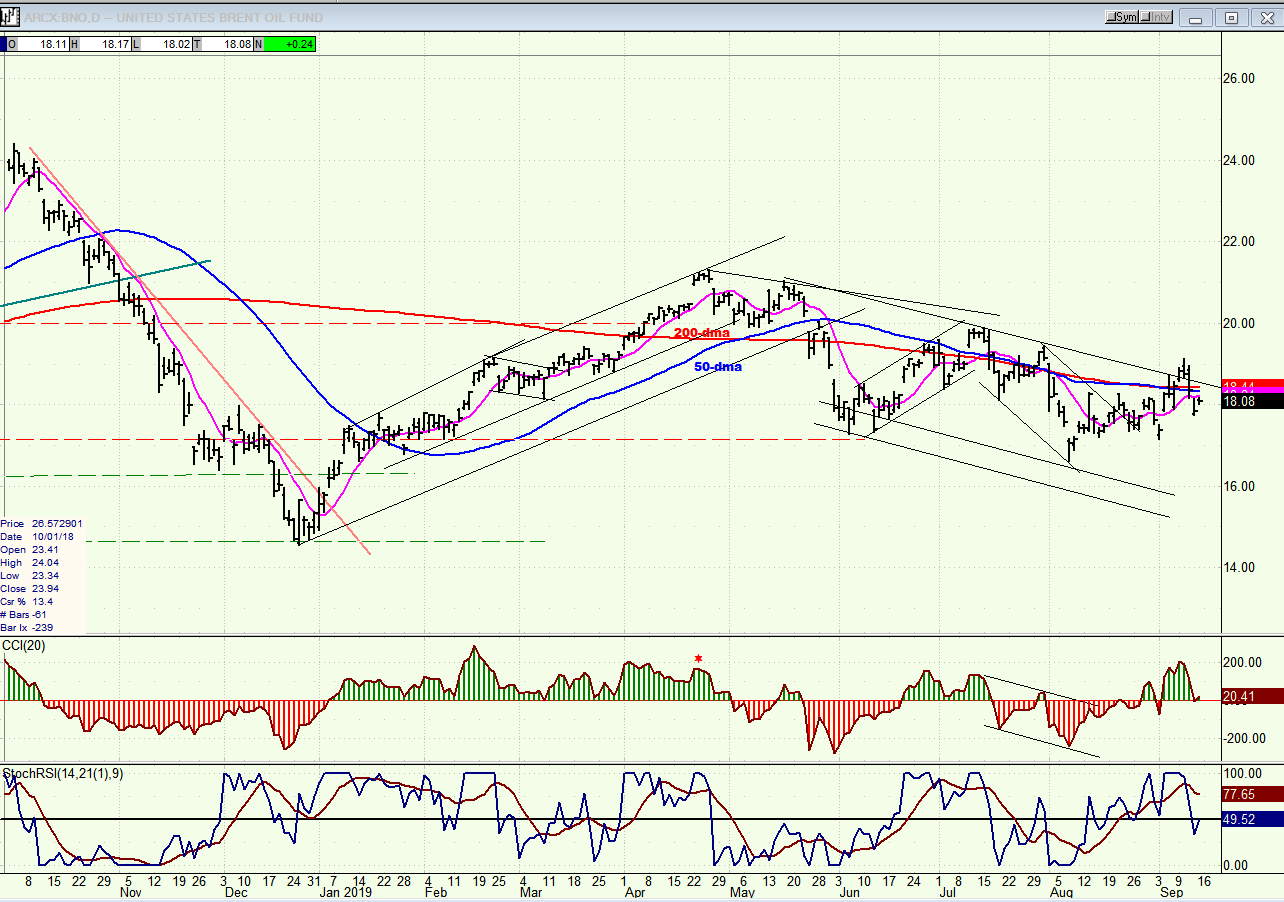
BNO (U.S. Brent oil fund) daily
BNO has been restricted by its channel and, after a brief attempt to go outside of it, pulled back inside. The attack on Saudi oil facilities could cause a brief spike in oil stocks but should not have an important impact on the longer trend, especially if the overall market begins to show weakness.
Summary
Although SPX pushed a little higher last week, multiple signs have appeared that could be advance warning of a reversal in trend. This is explained in detail above.
FREE TRIAL SUBSCRIPTON
With a trial subscription, you will have access to the same information that is given to paid subscribers, but for a limited time period. I think you will find that knowing how far a move can carry is one of the most useful benefits of this service, whether you are a trader or an investor -- especially when this price target is confirmed by reliable indicators which give advance warning of a market top or bottom. Furthermore, cycle analysis adds the all- important time element to the above price projections. For a FREE 4-week trial, further subscription options, payment plans, and for general information, I encourage you to visit my website at www.marketurningpoints.com.
The above comments about the financial markets are based purely on what I consider to be sound technical analysis principles. They represent my own opinion and are not meant to be construed as trading or investment advice, but are offered as an analytical point of view which might be of interest to those who follow stock market cycles and technical analysis.
********

When Andre Gratian was a stock broker years ago, a friend introduced him to technical analysis of the market. Consequently, it is not an exaggeration to say that Andre fell in love with this approach! Ever since then, it has become an increasingly important part of his professional life. Gratian has studied the works of Wyckoff, Edwards & Magee, Edward J. Dewey (cycles) and many others. However, one of my most profitable undertaking has probably been to study Point & Figure charting, which he finds invaluable in analyzing stocks and indices. If he were restricted to one methodology, this is the one that he would choose. This well-rounded background has given him what he feels to be a special insight into the stock market, facilitating the recognition of meaningful patterns and the ‘turning points’ in all trends, whether they be short or long term. Andre feels very comfortable discussing the stock market and passing on meaningful information to others. His subscribers include individuals and money managers throughout the world. Moreover, his Newsletters are currently published on several financial sites, here and abroad.


