Technical Analysis Of The Markets


Current Position of the Market
SPX: Long-term trend – There are no signs that the bull market is over.
Intermediate trend – Limited correction underway.
Analysis of the short-term trend is done on a daily basis with the help of hourly charts. It is an important adjunct to the analysis of daily and weekly charts which discusses the course of longer market trends.
Market Review
Point & Figure Overview of SPX
Long-term trend: The bull market which started in 03/09 shows no sign of having run its course. A rough count taken on the long-term Point & Figure chart gives us a potential target to as high as 4080. P&F does not predict time, only price. (no change)
Intermediate trend: Current topping pattern suggests minimum correction to 3260. Maximum to 3090. The minimum target has been surpassed. 3155-3160 is now likely.
Important Cycle
In February, three important cycles are scheduled to make their lows: the 2-yr cycle, the 20-wk cycle, and the 80-day cycle.
Market Analysis (Charts courtesy of QCharts
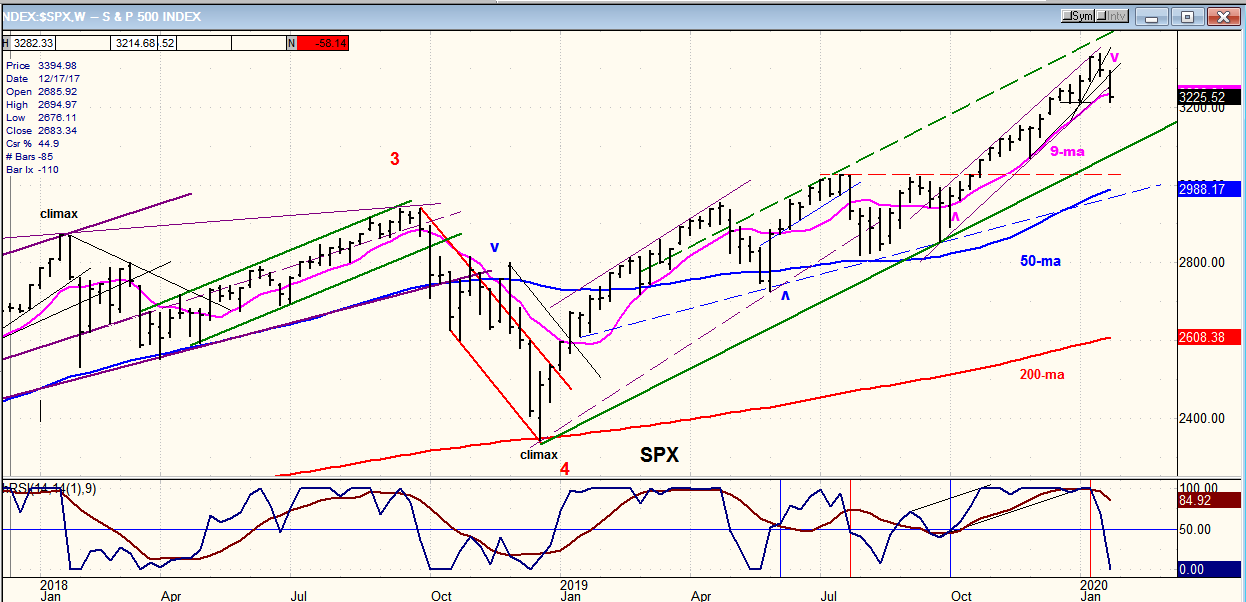
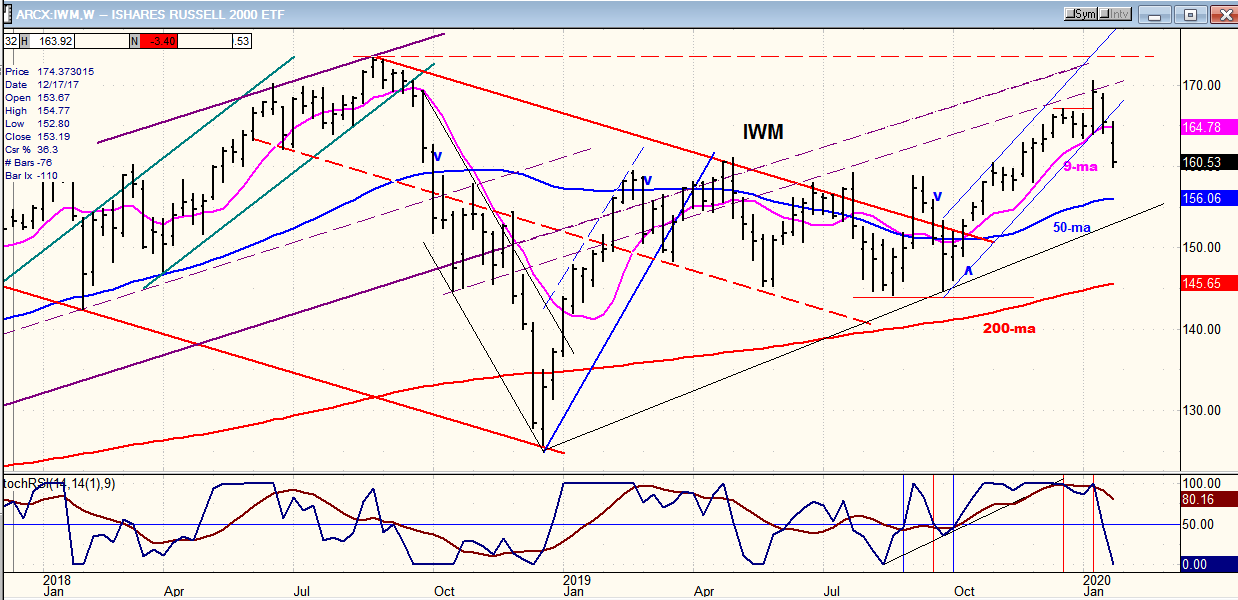
SPX-IWM weekly charts
The weekly (intermediate) trend line has been broken in both charts, suggesting that a correction of intermediate nature is underway. It is unlikely that the pull-back will last beyond the last week of this month, and it should end much sooner. Price projections are available in the P&F section.
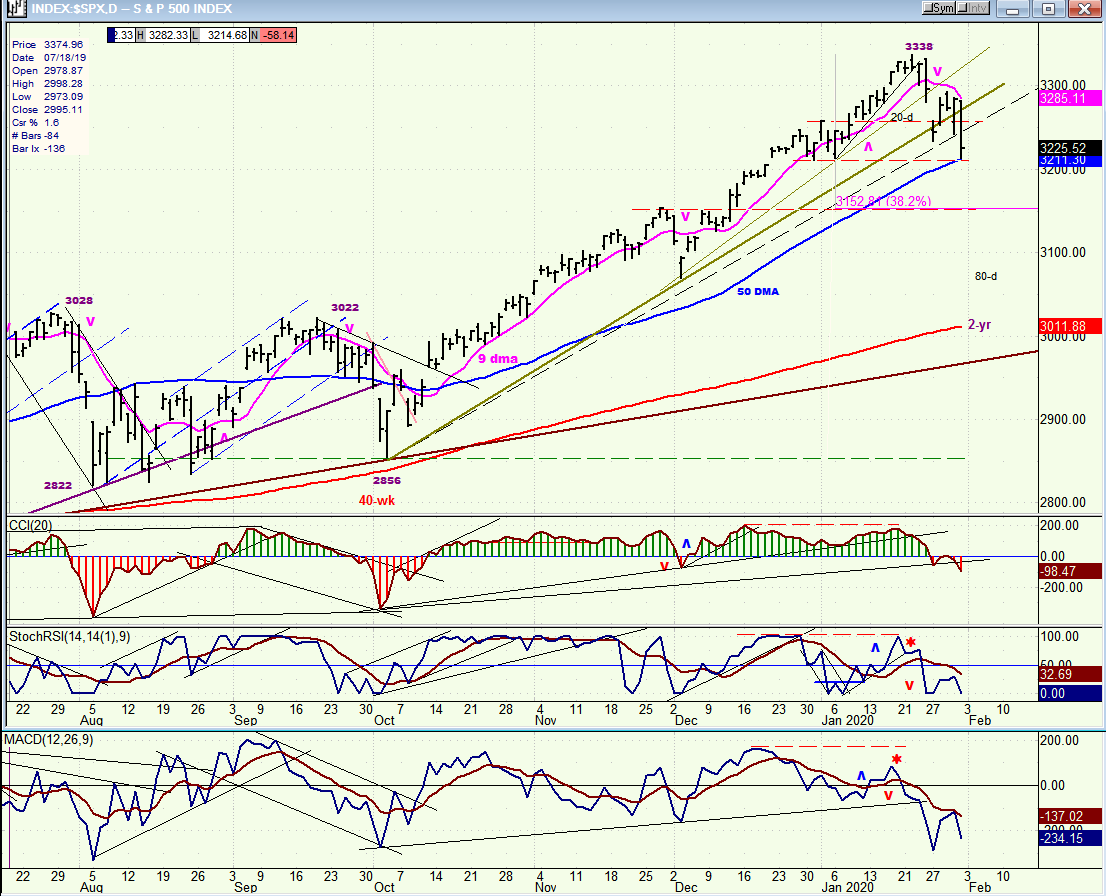
SPX daily chart
The bottoming cycles mentioned above finally gained control of prices after the index had risen to 3338. Since then, prices have fallen to Friday’s low of 3215, or 123 points, and could continue their declines for at least another 50 points into the middle of next week as the 80-day cycle makes its low. The unknown quantity is the 2-yr cycle whose low cannot be timed precisely because of its magnitude. If it extends beyond Thursday, then we can see prices reaching the maximum projection of 3145. The 20wk cycle which is due late in the month should not be a significant factor if the 2-yr has made its low before then, but it could provide a pause in the new uptrend. After all the cycles have bottomed, we can expect the market to resume its long-term uptrend until it is ready for the next correction.
The oscillators at the bottom of the chart gave us some advance notice that the market was ready to turn down by showing some negative divergence. Now that they are in full sell mode, they will most likely warn us of the next reversal to the upside by showing positive divergence ahead of the turn.
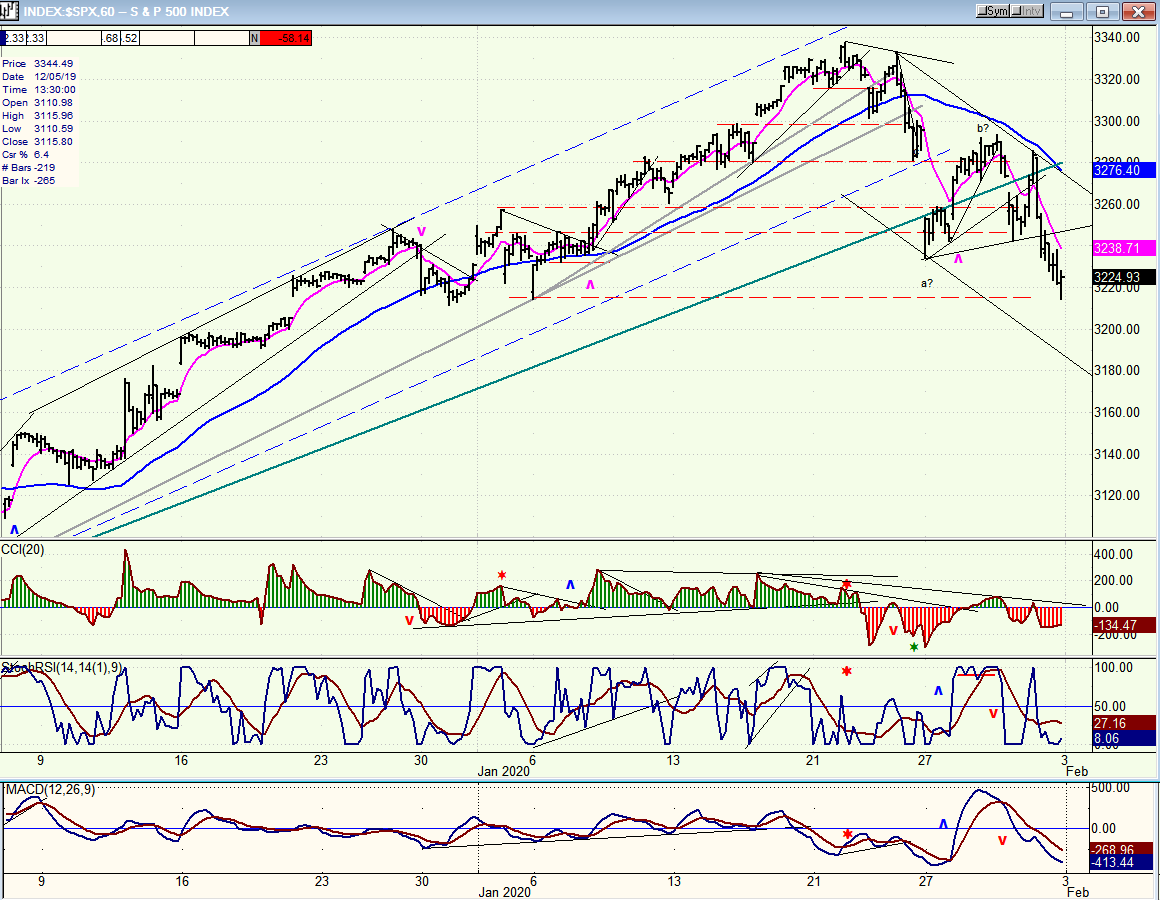
SPX hourly chart
The hourly chart is best suited to display the short-term market swings. There were few notable ones in the move from 2856 to 3338, with each minor correction limited in time and scope. In the next up-phase (whose extent has not yet been determined) the pull-backs generated by minor cycles could be more significant. But we will have to wait until we approach mid-year before we get another correction of the current magnitude, and possibly larger.
The CCI is showing some minor deceleration, but this is not likely to lead to a reversal until the 80-day cycle has made its low.
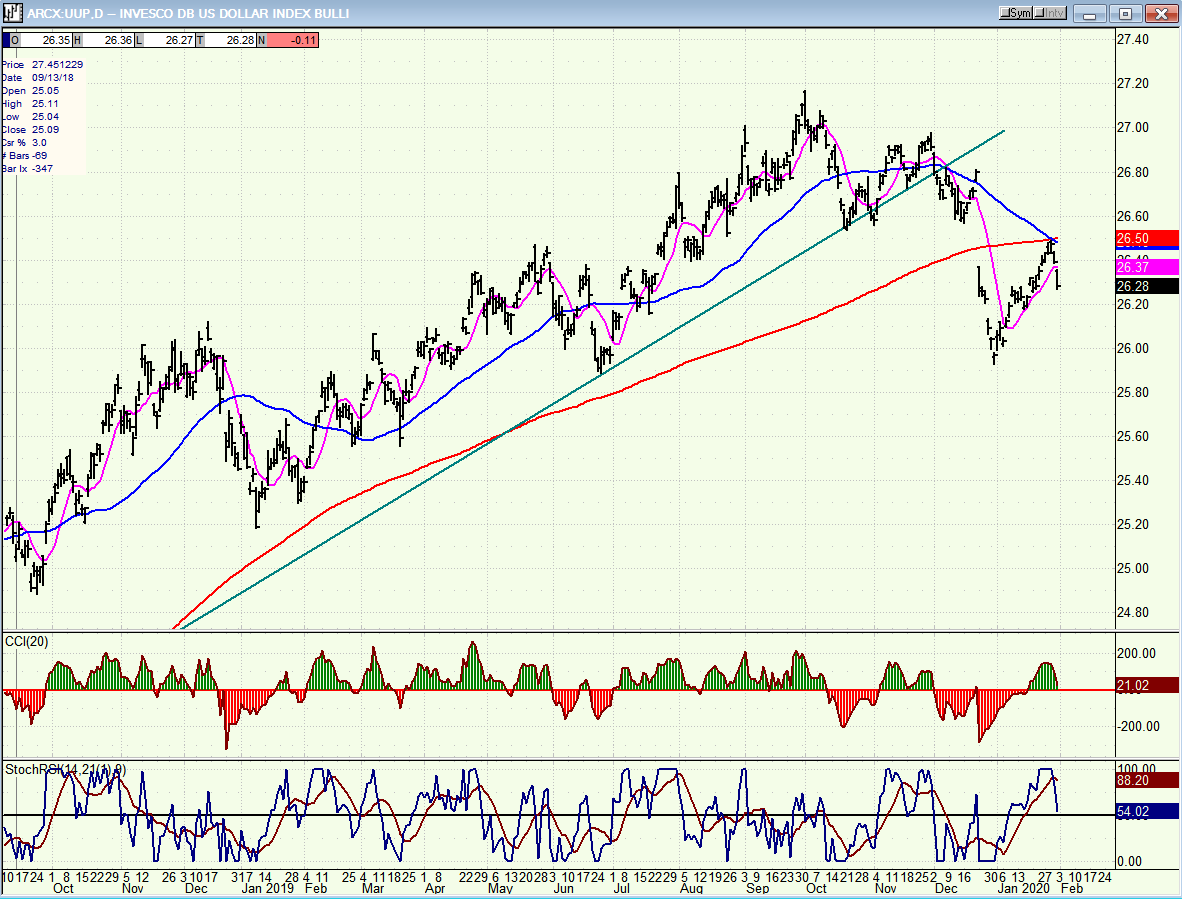
UUP (dollar ETF) dail
I am reverting to showing UUP now that enough time has passed since the dividend gap was created. By now, the indicators should should no longer be distorted. The green trend line originated in January 2018; and since it was decisively broken, it should signal a reversal of intermediate nature. This means that a correction back down to 25.00-25.50 can be expected.
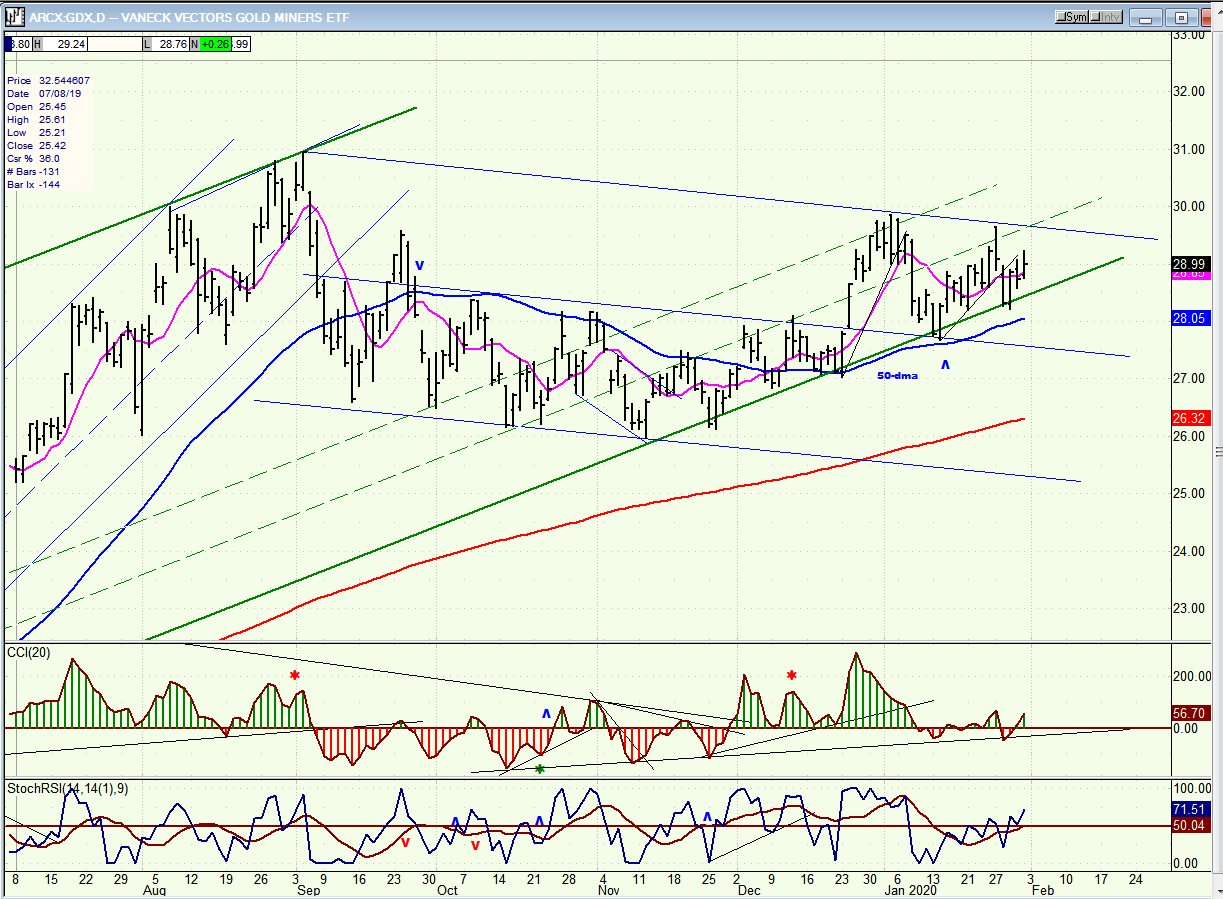
GDX (Gold miners ETF) daily
Since last November, GDX has been bouncing off its green trend/channel line. This is not a sign of real strength; and until the price can push beyond the blue downtrend line with more aggression than it currently displays, the index is risking additional consolidation/correction outside of the trend line.
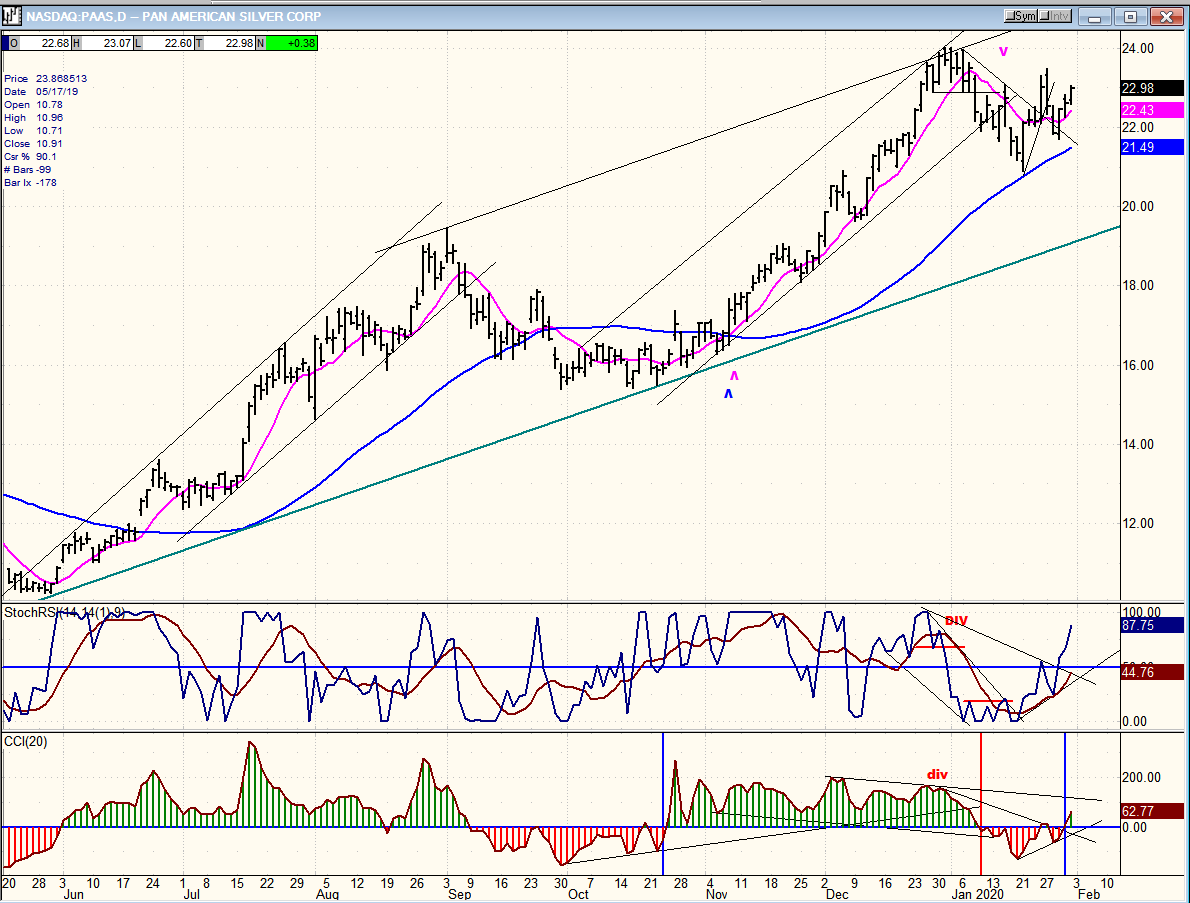
PASS (Pan American Silver Corp.) daily
Although the indicators have given buy signals, I am not convinced that PAAS is ready to extend its uptrend until it has consolidated for a bit longer. This could change if UUP extends its correction right away; and it would also affect GDX positively.
BNO (U.S. Brent oil fund) daily
BNO has matched the weakness in the market as it continued to correct along with it. It is possible that it could extend its decline for another point or so before it finds good support. BNO will be ready to reverse when the market cycles have made their lows.
Summary
The correction continues as anticipated and its end may come as early as this week if the two-year cycle makes its low in conjunction with the 80-day cycle. Potential price targets are given above.
FREE TRIAL SUBSCRIPTON
With a trial subscription, you will have access to the same information that is given to paid subscribers, but for a limited time period. I think you will find that knowing how far a move can carry is one of the most useful benefits of this service, whether you are a trader or an investor -- especially when this price target is confirmed by reliable indicators which give advance warning of a market top or bottom. Furthermore, cycle analysis adds the all- important time element to the above price projections. For a FREE 4-week trial, further subscription options, payment plans, and for general information, I encourage you to visit my website at www.marketurningpoints.com.
The above comments about the financial markets are based purely on what I consider to be sound technical analysis principles. They represent my own opinion and are not meant to be construed as trading or investment advice, but are offered as an analytical point of view which might be of interest to those who follow stock market cycles and technical analysis.
********

When Andre Gratian was a stock broker years ago, a friend introduced him to technical analysis of the market. Consequently, it is not an exaggeration to say that Andre fell in love with this approach! Ever since then, it has become an increasingly important part of his professional life. Gratian has studied the works of Wyckoff, Edwards & Magee, Edward J. Dewey (cycles) and many others. However, one of my most profitable undertaking has probably been to study Point & Figure charting, which he finds invaluable in analyzing stocks and indices. If he were restricted to one methodology, this is the one that he would choose. This well-rounded background has given him what he feels to be a special insight into the stock market, facilitating the recognition of meaningful patterns and the ‘turning points’ in all trends, whether they be short or long term. Andre feels very comfortable discussing the stock market and passing on meaningful information to others. His subscribers include individuals and money managers throughout the world. Moreover, his Newsletters are currently published on several financial sites, here and abroad.


