Technical Analysis Of The Markets


Current Position of the Market
SPX Long-term trend: Uptrend from the 2009 low continues.
SPX Intermediate trend: Uncertain. Need time to evaluate
Analysis of the short-term trend is done on a daily-basis with the help of hourly charts. It is an important adjunct to the analysis of daily and weekly charts which discuss longer market trends.
Correction over Next Week?
Point & Figure overview of SPX
Long term trend: The bull market which started in 2009 shows no sign of having run its course. A long count taken on the long term P&F chart gives us a potential target as high as 4080. P&F does not predict time; only price. (no change)
Intermediate trend: If this correction is only a normal dip caused by the 20-wk cycle, the next projection is 3630.
Important (known) cycles
I follow only a few cycles which I use in my analysis. This is complemented by the analysis of Erik Hadik (www.insiidetrack.com).
The 20-wk cycle is due on about 2/26
Market Analysis (Charts courtesy of QCharts)
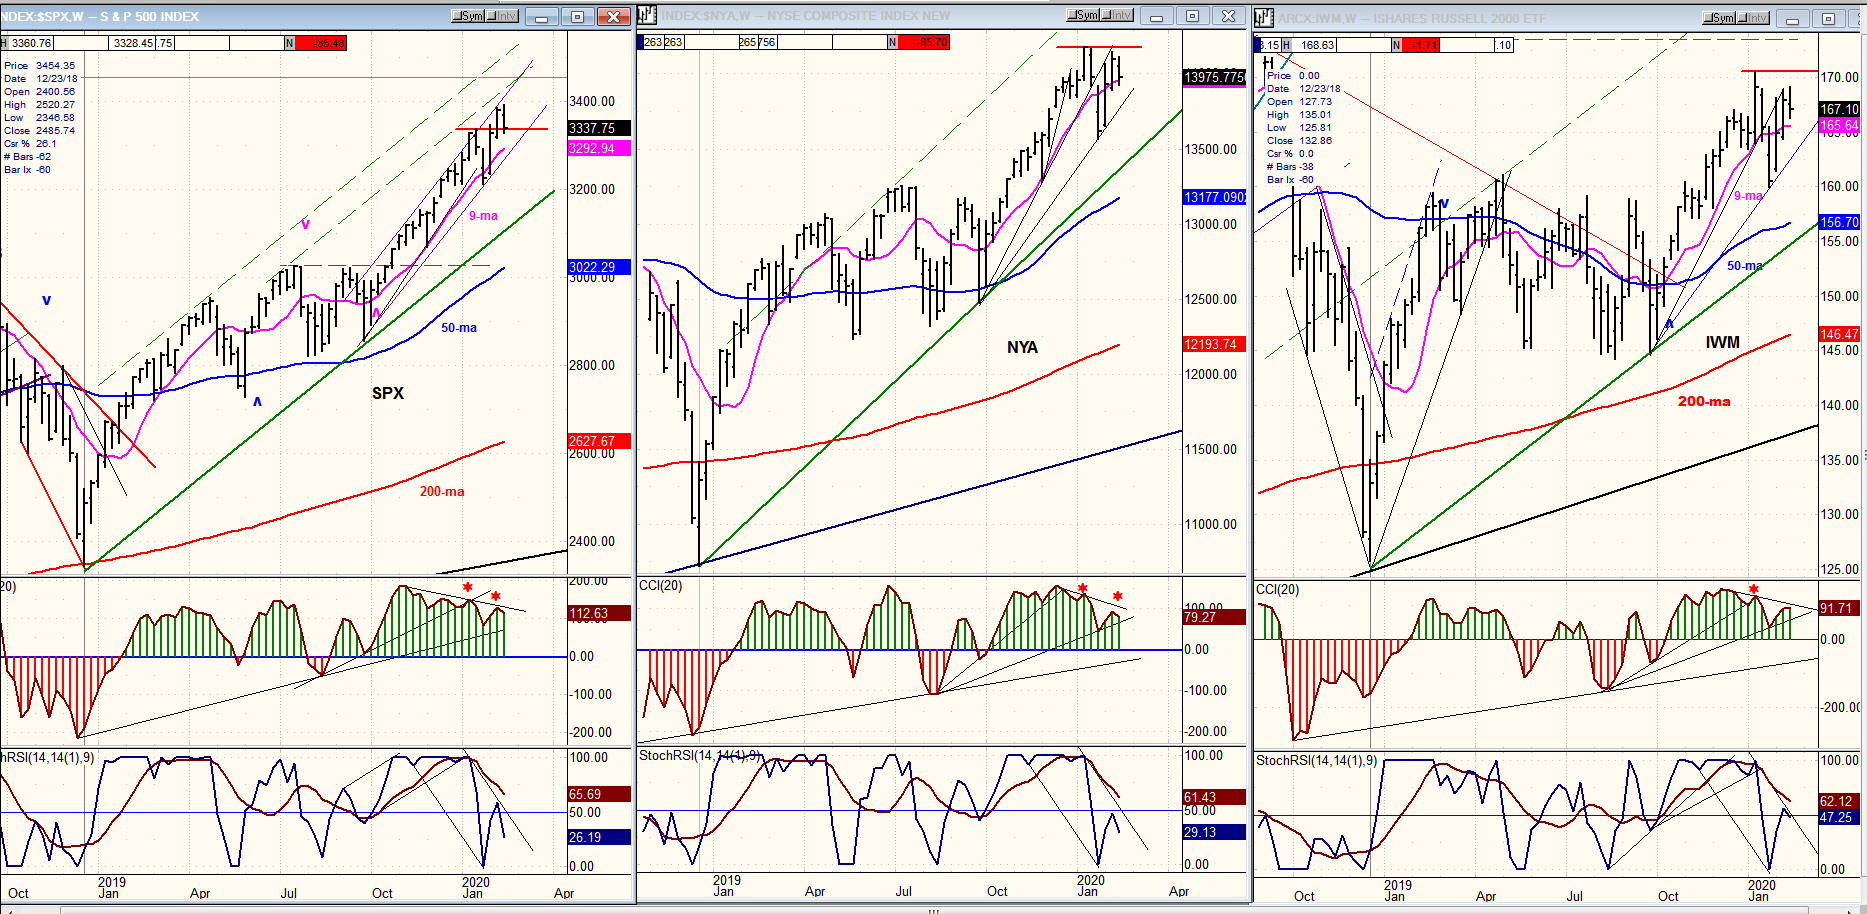
SPX-NYA-IWM weekly charts:
The current 65-point pull-back in the SPX is only a blip on the weekly chart. And it will probably stay that way if this correction is only caused by the bottoming action of the 20-wk cycle. But we’ll need to make sure that this is confirmed by future market action. Concerns about the coronavirus is increasingly producing comments about how the economy could be affected if the virus continues to spread. If these fears persist, it could have a larger impact on the market’s performance than seen thus far. This would become apparent if a brief rally is followed by a deeper correction.
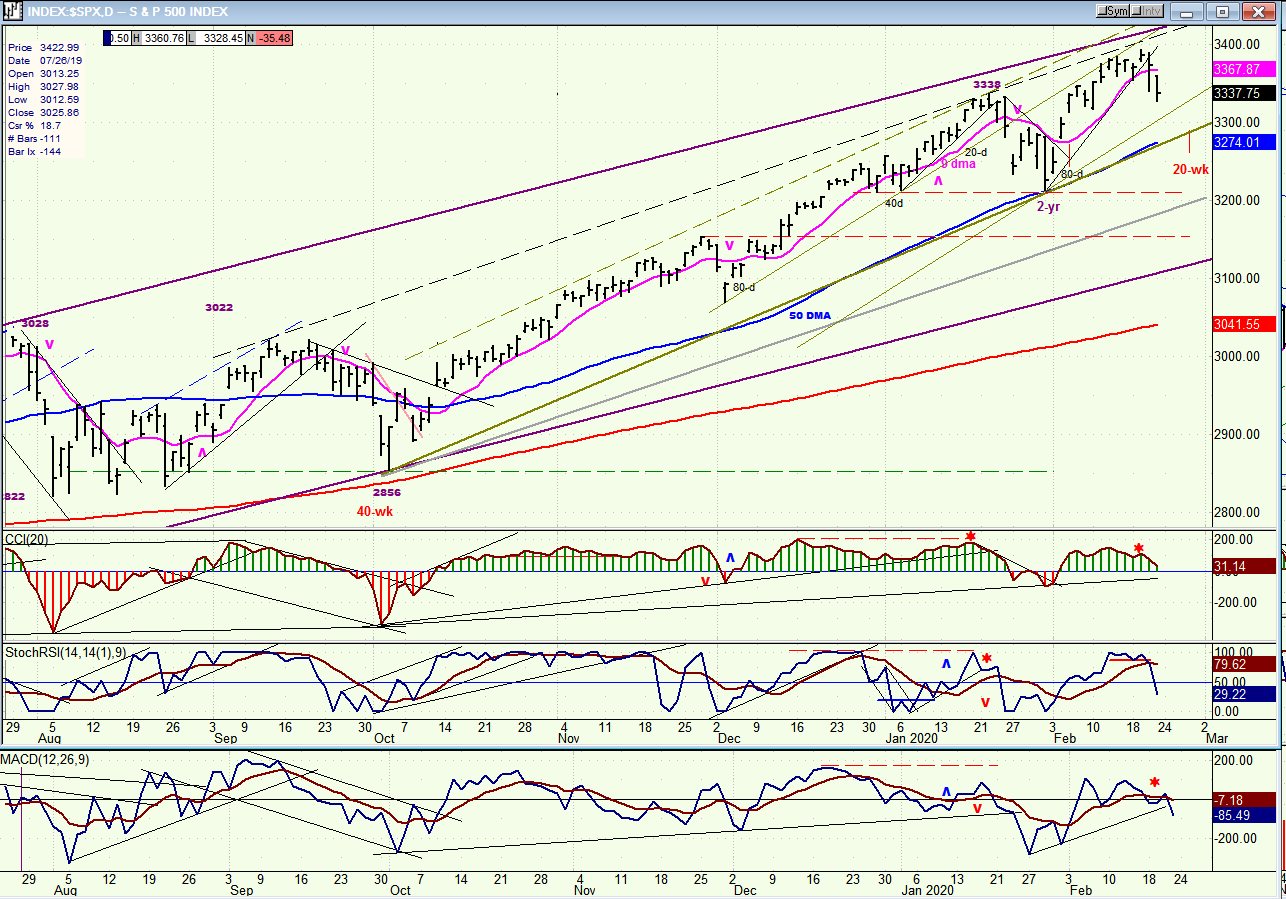
SPX daily chart
The current correction is ostensibly caused by the bottoming 20-wk cycle, with its low estimated to be ideally on 2/27. The ideal target for this low is 3305. Price and time of the actual low can obviously vary and this is when the indicators are useful since they warn of the approaching reversal point. Note that the daily oscillators are still down-trending, and that on Friday the index closed below its (pink) 9-dma after making a new correction low for the day. No sign of pending reversal here. A little later on, we’ll look at the hourly chart which fine-tunes reversals to see if it is issuing a warning.
But first, I want to discuss what should happen after the cycle has made its low. Three weeks ago SPX completed a correction which was caused by the 2-yr cycle coming to the end of its phase and turning up, generating a 180-point rally before the declining 20-wk cycle was able to stage a counter-trend. A normal expectation would be that we are near another reversal to the upside and that we should see the index make a new high and keep rising until it eventually reaches the next intermediate projection of 3630. If, however, the index fails to make a new high, or turns down again shortly afterwards, something is not normal and we should be on the alert for more market weakness -- perhaps much more market weakness.
The unknown factor which could affect the market and to what extent, is if the coronavirus infection continues to expand in China and outside of China, and its economic repercussions. The market should soon tell us what to expect, so stay alert!
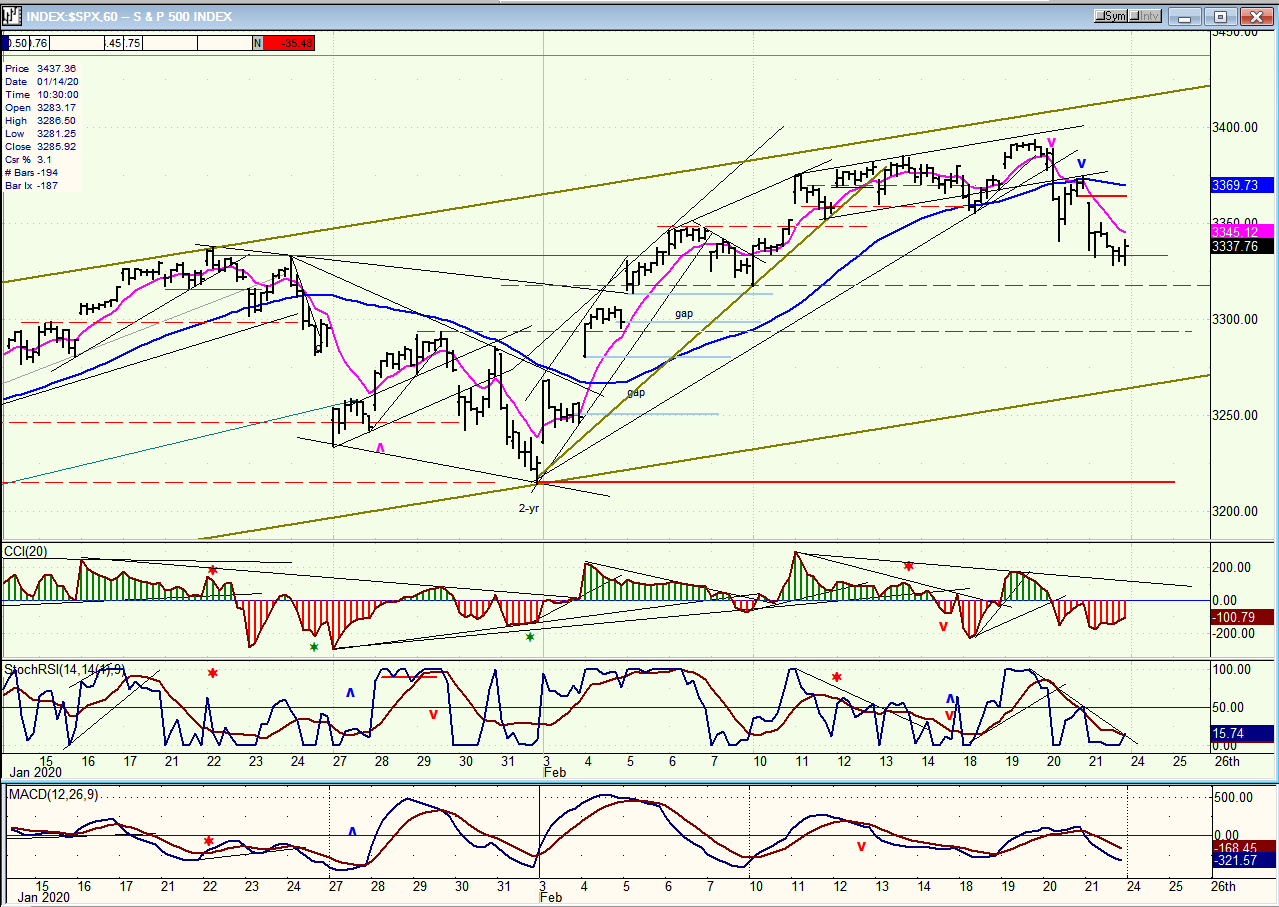
SPX hourly chart
After slowing the advance from the 2-yr cycle rally to a crawl, the bottoming 20-wk cycle finally turned it around and, as of Friday, did not show any clear sign that it had yet reached its low point, although some positive divergence is beginning to appear in the CCI. But this divergence can quickly disappear if the index drops another 30 points by the middle of next week, which is the potential given to the correction by the 5X P&F chart. Declining below 3305 would begin to look abnormal, as would any rally which fails to make a new high or reverses soon afterwards, suggesting that forces other than these two cycles are in play, and that investors should proceed cautiously..
UUP (dollar ETF)
After a rally from its 3-mo cycle low which was rapidly developing into an exponential uptrend, UUP finally reversed its move suddenly, with no distribution and started to correct on Friday. It’s too soon to know if this is the top of the 3-mo cycle and if the index has started a decline which will continue to its next low due near the end of March. By next week, we should have a better idea.

GDX (gold miners)
Last week I mentioned that GDX showed that it was on the verge of breaking out of a bullish-looking formation. It did not disappoint and quickly moved from near 28.00 to a Friday close of 30.65, near its high of the day. 30.50 was the minimum expectation for this move, but since it shows no sign of having topped, one could expect higher prices. It has a bullish-looking P&F chart for both short and long term and could move to 32.50 before the end of this move.

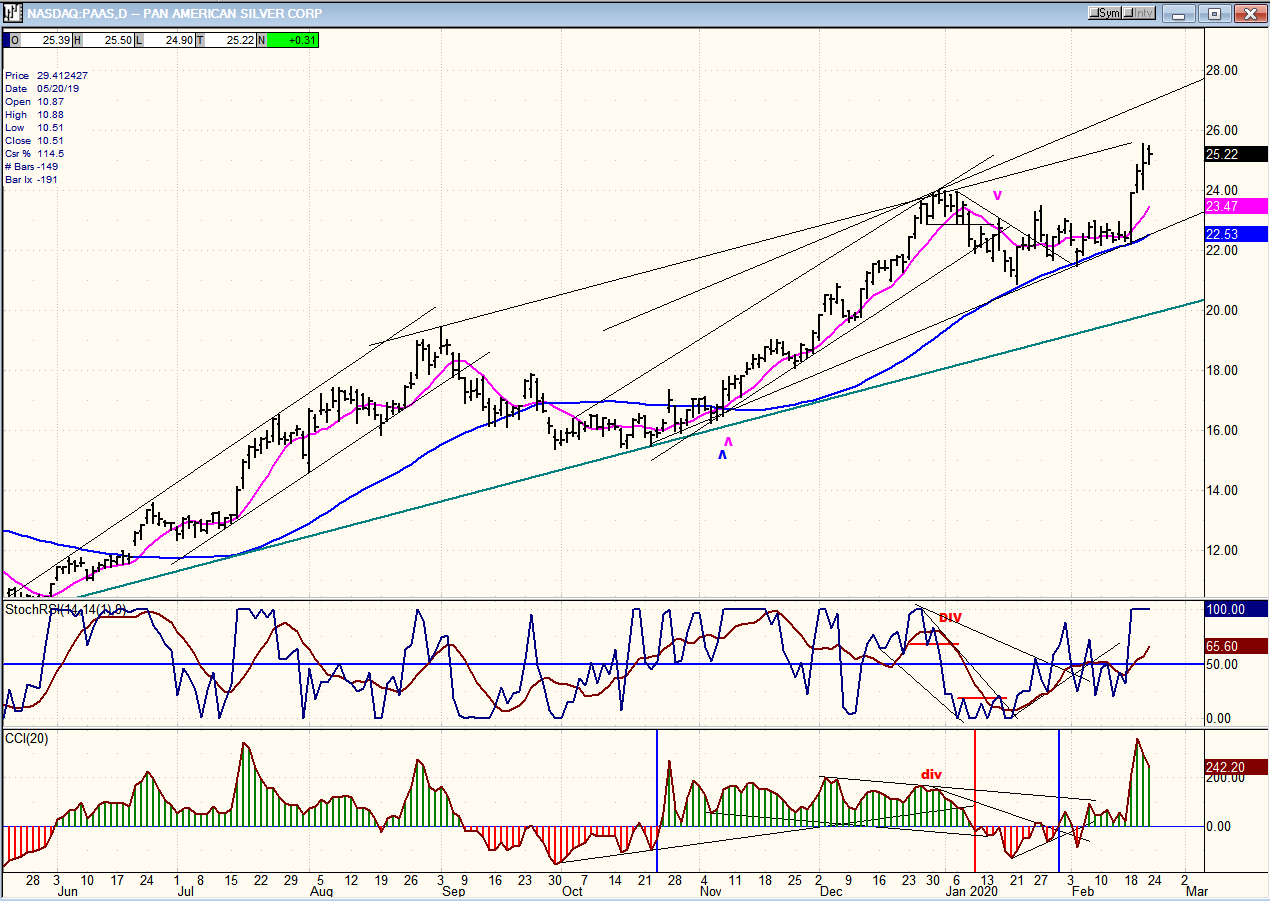
PAAS (Pan American Silver Corp)
I also mentioned that PAAS had made a bullish formation and that it was near a break-out. By Friday, the stock had risen from 22.25 to 25.50 and was encountering some resistance at the top of its price channel. However, like GDX, it does not look finished and could move as high as 29, thereby creating a steeper price channel before consolidating.
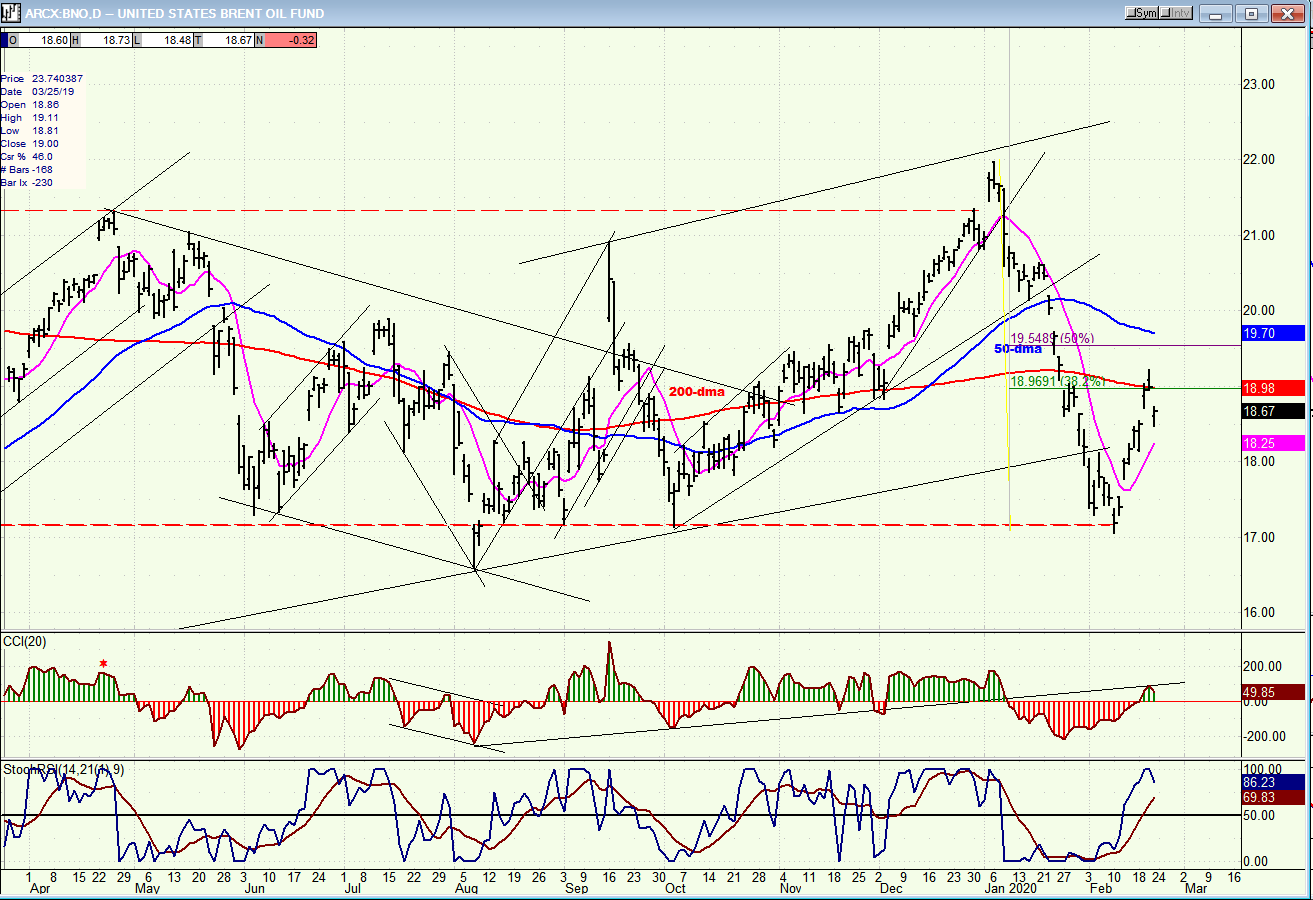
BNO (U.S. Brent Oil fund)
After a sharp correction which found support at previous lows, BNO retraced a little over .382 of its decline and turned down again on Friday. Depending on what the overall market does, the index could build a base near its recent low, or make new lows.
Summary
We have entered a period of uncertainty which could have a significant negative impact on the stock market if the coronavirus infection continues to spread rapidly, not just in China but throughout the rest of the world. Already, China is showing severe economic effects, and this could expand to the world economy as well. Best be cautious until we have more clarity about this situation.
Free trial subscription
With a trial subscription, you will have access to the same information that is given to paid subscribers, but for a limited time period. Over the years, I have developed an expertise in P&F charting (price projection), cycles (timing), EWT (structure), and general technical analysis which enables me to warn subscribers of pending reversals in market trends and how far that trend can potentially carry. For a FREE 4-week trial, subscription options and payment plans, I encourage you to visit my website at www.marketurningpoints.com.
The above comments and those made in the daily updates and the Market Summary about the financial markets are based purely on what I consider to be sound technical analysis principles. They represent my own opinion and are not meant to be construed as trading or investment advice, but are offered as an analytical point of view which might be of interest to those who follow stock market cycles and technical analysis.
*********

When Andre Gratian was a stock broker years ago, a friend introduced him to technical analysis of the market. Consequently, it is not an exaggeration to say that Andre fell in love with this approach! Ever since then, it has become an increasingly important part of his professional life. Gratian has studied the works of Wyckoff, Edwards & Magee, Edward J. Dewey (cycles) and many others. However, one of my most profitable undertaking has probably been to study Point & Figure charting, which he finds invaluable in analyzing stocks and indices. If he were restricted to one methodology, this is the one that he would choose. This well-rounded background has given him what he feels to be a special insight into the stock market, facilitating the recognition of meaningful patterns and the ‘turning points’ in all trends, whether they be short or long term. Andre feels very comfortable discussing the stock market and passing on meaningful information to others. His subscribers include individuals and money managers throughout the world. Moreover, his Newsletters are currently published on several financial sites, here and abroad.
More from Gold-Eagle


