Technical Analysis Of The Markets
 share
share
 share
share
 share
share
 share
share
 share
share
Current Position of the Market
SPX: Long-term trend – We are in an official bear market
Intermediate trend – Concluding initial rally in a downtrend.
Analysis of the short-term trend is done daily with the help of hourly charts. It is an important adjunct to the analysis of daily and weekly charts which discusses the course of longer market trends.
Topping Behavior
Important Cycles
A 52-day cycle making its low on 5/14 interjected itself before the next 80-day Hurst (45-td) cycle low due ~6/08. This had the effect of altering the short-term price structure.
Point & Figure Overview of SPX
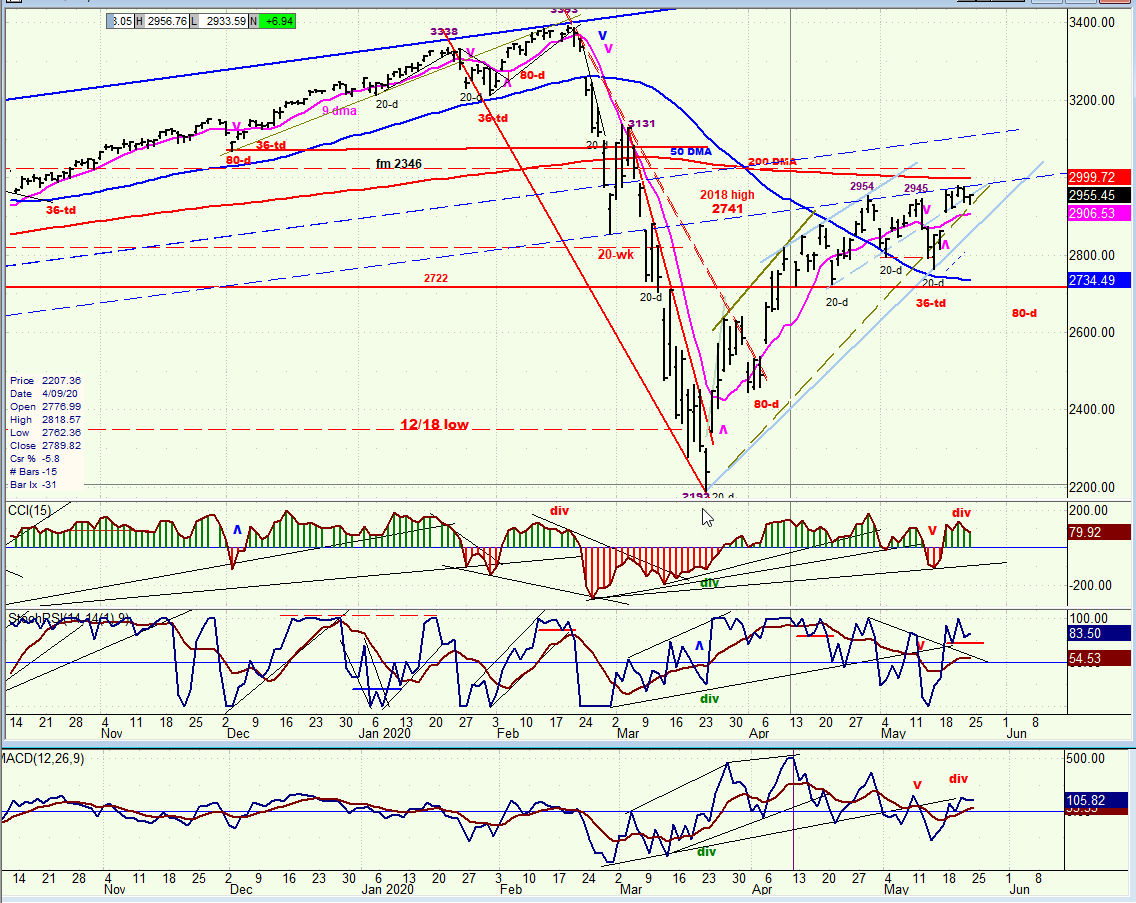
Intermediate trend: I should have stayed with my previous 2970 projection! A new distribution pattern is now in progress between 2940-2980.
Market Analysis (Charts courtesy of QChart)
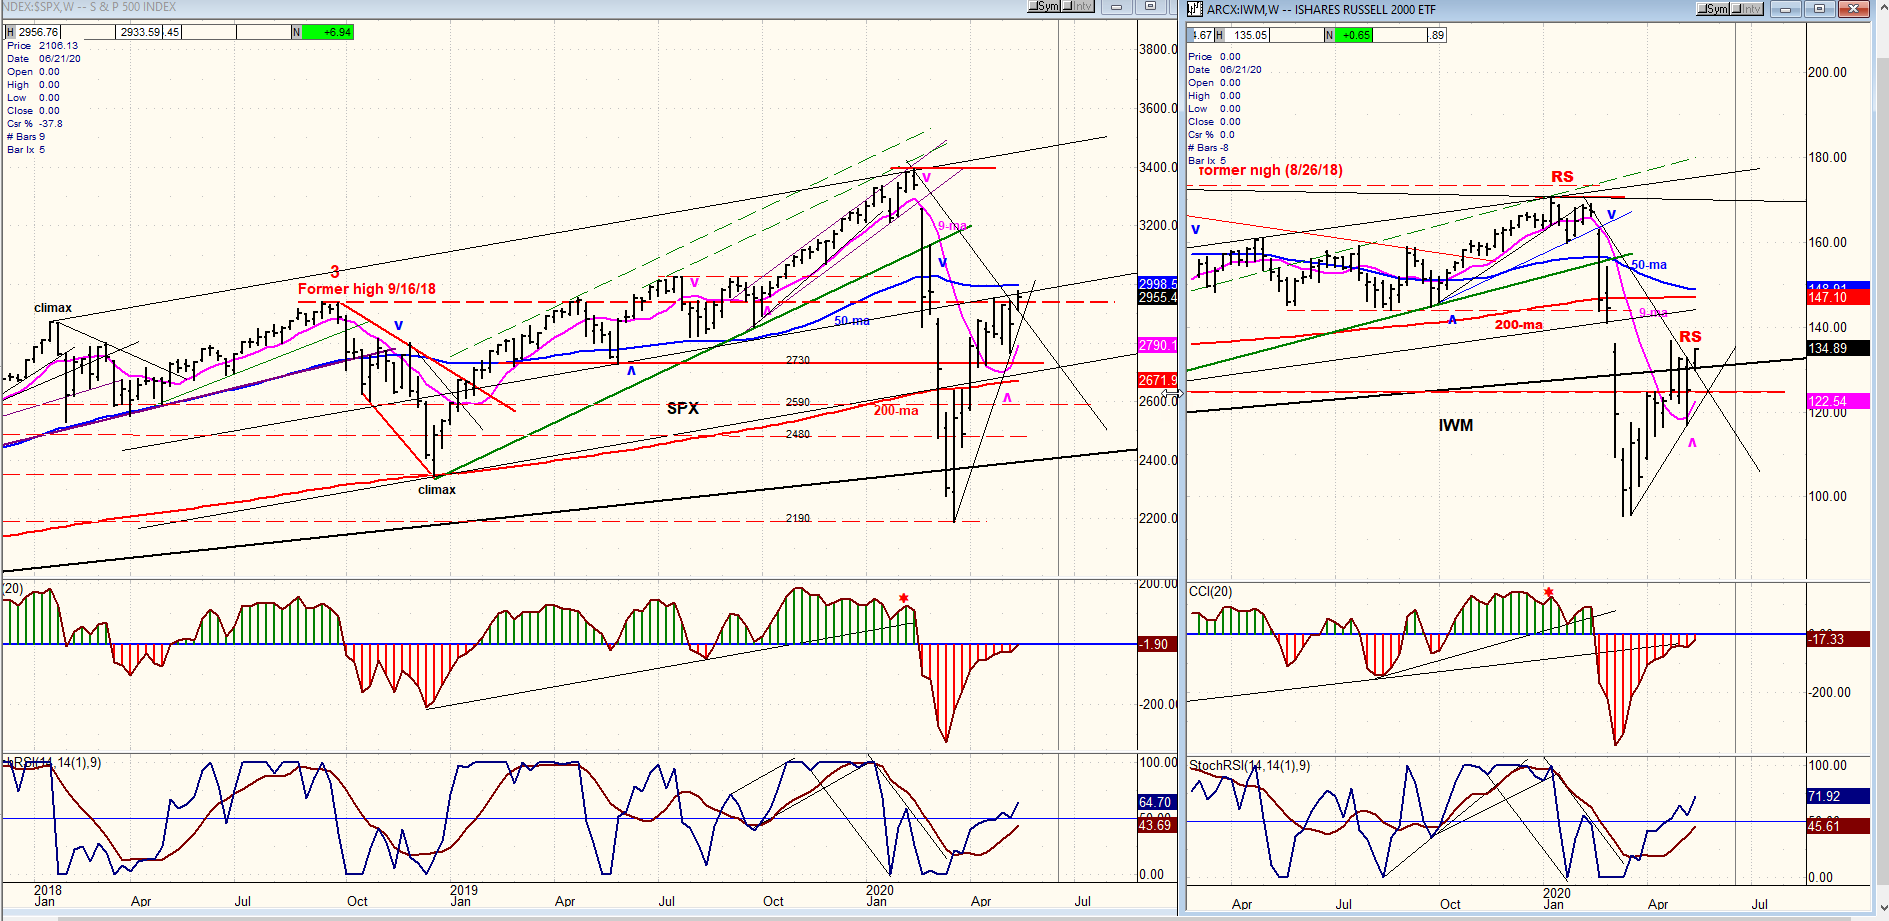
SPX-IWM weekly charts
The new cycle had enough strength to take the SPX slightly beyond its high of three weeks ago. This altered the P-F pattern and caused the distribution phase to take place at a higher level, thereby modifying the short-term price analysis and nullifying the previous downside projection. Next week should determine if the high of the 80-day cycle has been reached. The 50-wk MA is a short distance higher and should act as resistance if the index challenges that level.
IWM failed to make a new high and remains a laggard.
SPX daily chart
The 52-calendar day cycle (36-td) was unexpected and has altered the price structure, causing the index to reach a slightly new high instead of starting the 80-day decline from a lower level. Friday’s price action suggests that we may not be finished with the short-term topping formation which is underway. If there is a new high ahead, it should be restricted by the 200-dma, which roughly corresponds to the 50-wk MA and currently runs at about 3000.
With the 80-day cycle low rapidly approaching, we should be very close to beginning a decline into its due date during the first week of June, but with IWM slightly stronger over the near-term (while weaker at the weekly level) it is not unconceivable that both indices could make a new high next week before rolling over.
The daily oscillators have already turned down but have remained positive. They will have to turn and stay negative before we can be convinced that an intermediate term signal has been given.
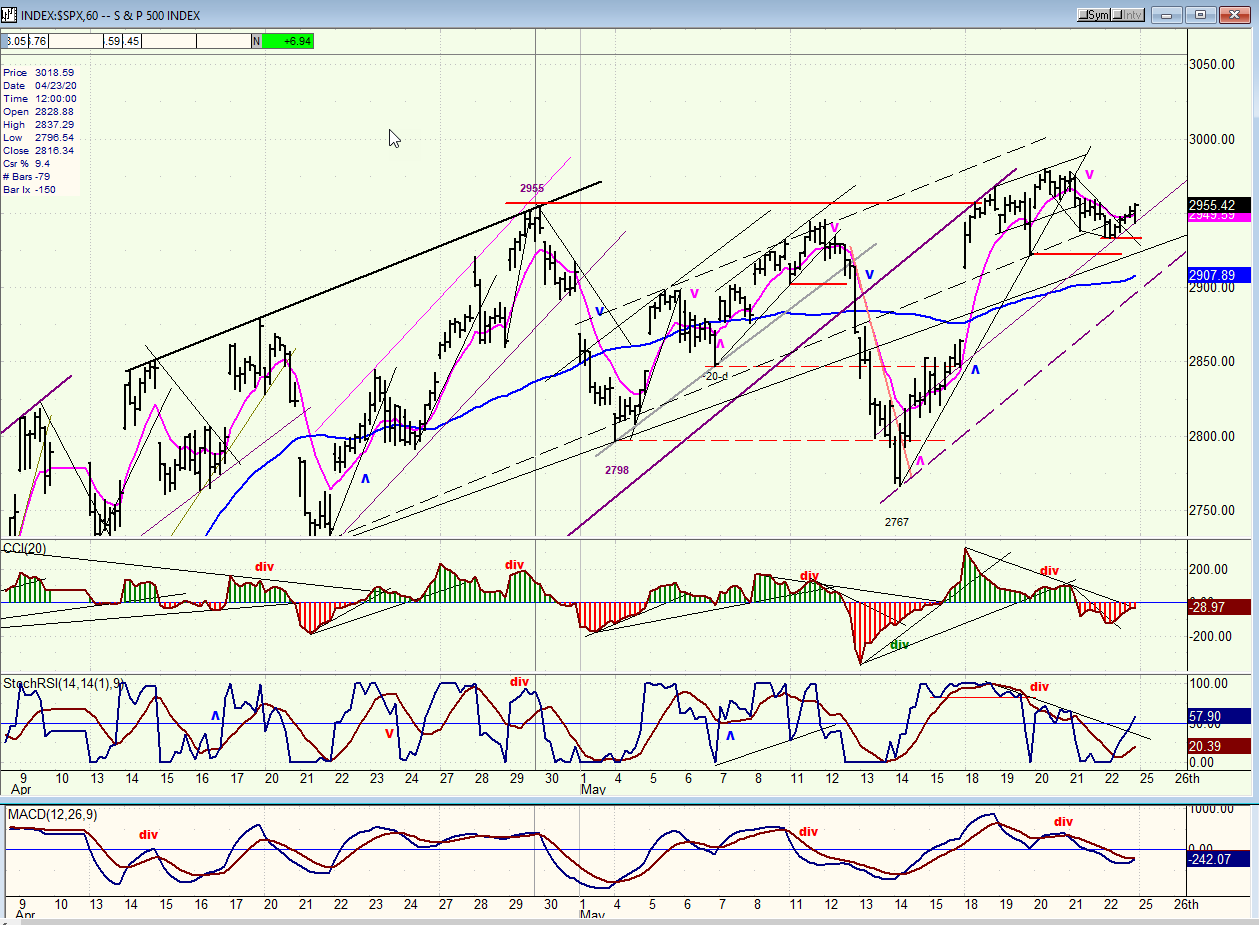
SPX hourly chart
It is “interesting” that overnight futures dropped down to 2905 (the level of the SPX hourly 50-MA) and rallied strongly by Friday’s opening. When this happens, SPX will often retest the overnight lows shortly after the opening, but this was not the case on Friday. SPX only formed a small base at 2933 and rallied for the rest of the day, almost turning the existing sell signal into a buy. If we open higher next Tuesday, we may retest the 2980 high before we are pulled lower by the 80-day cycle. This would increase the current congestion pattern which has formed above 2940.
At a minimum, trading below its week’s low would bring about a sell signal.
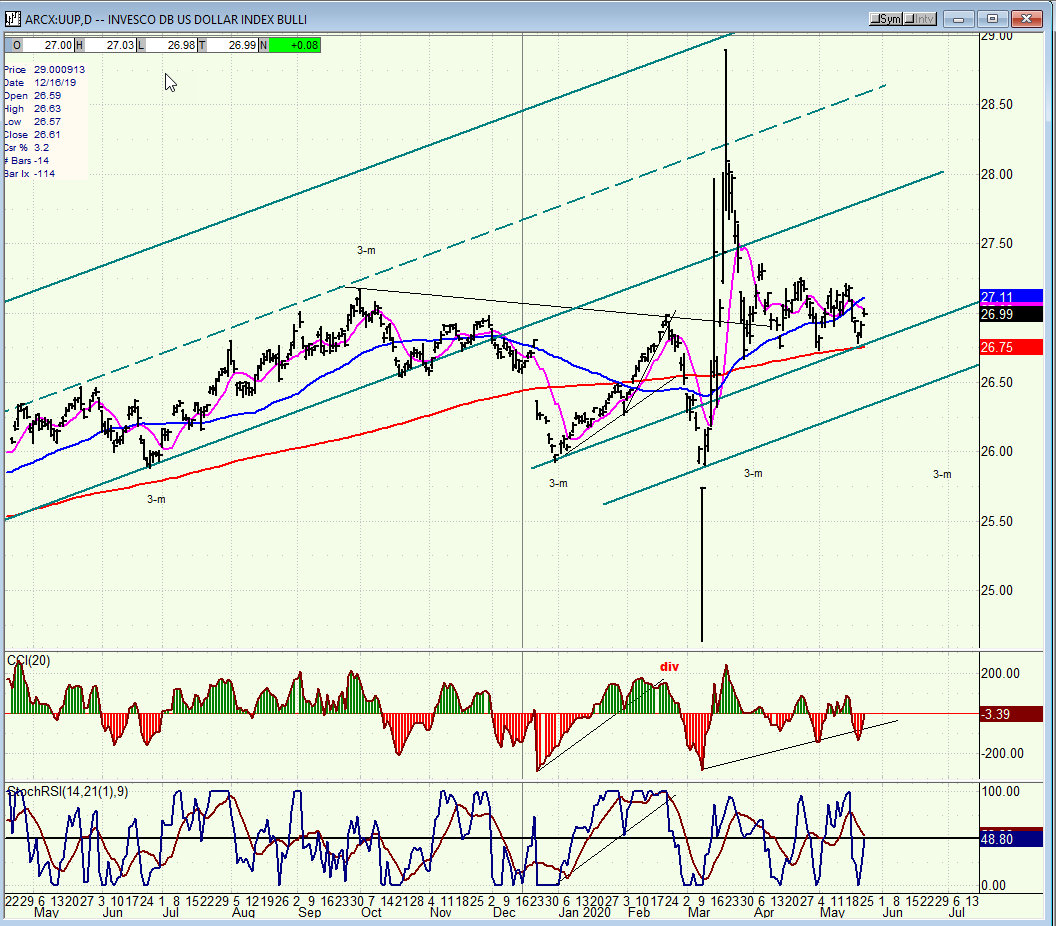
UUP (dollar ETF) daily
UUP continues to trade in a narrow range, but could soon be pulled down into the 3-mo cycle low which is now only about a month away.
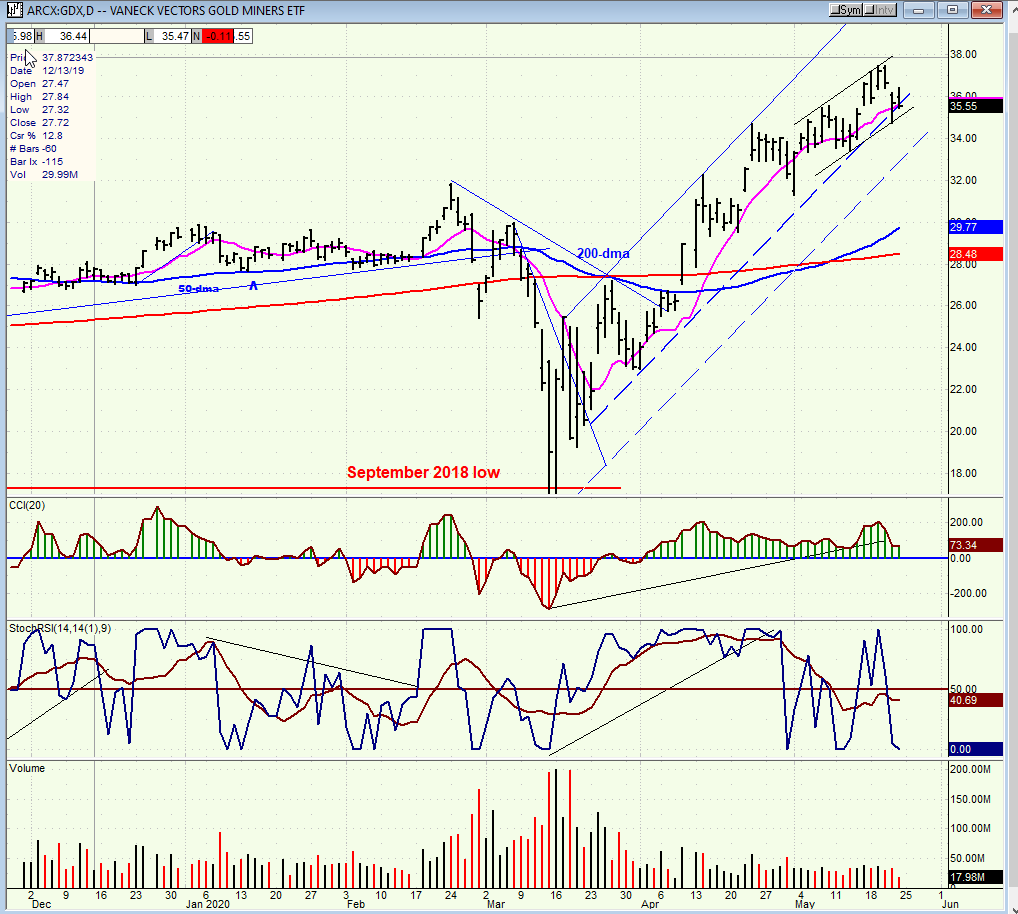
GDX (Gold miners ETF) daily
GDX has continued to extend its uptrend and filled an interim projection to 37.50. After a short consolidation, it could extend to about 39.00 before entering in a much more important consolidation period.
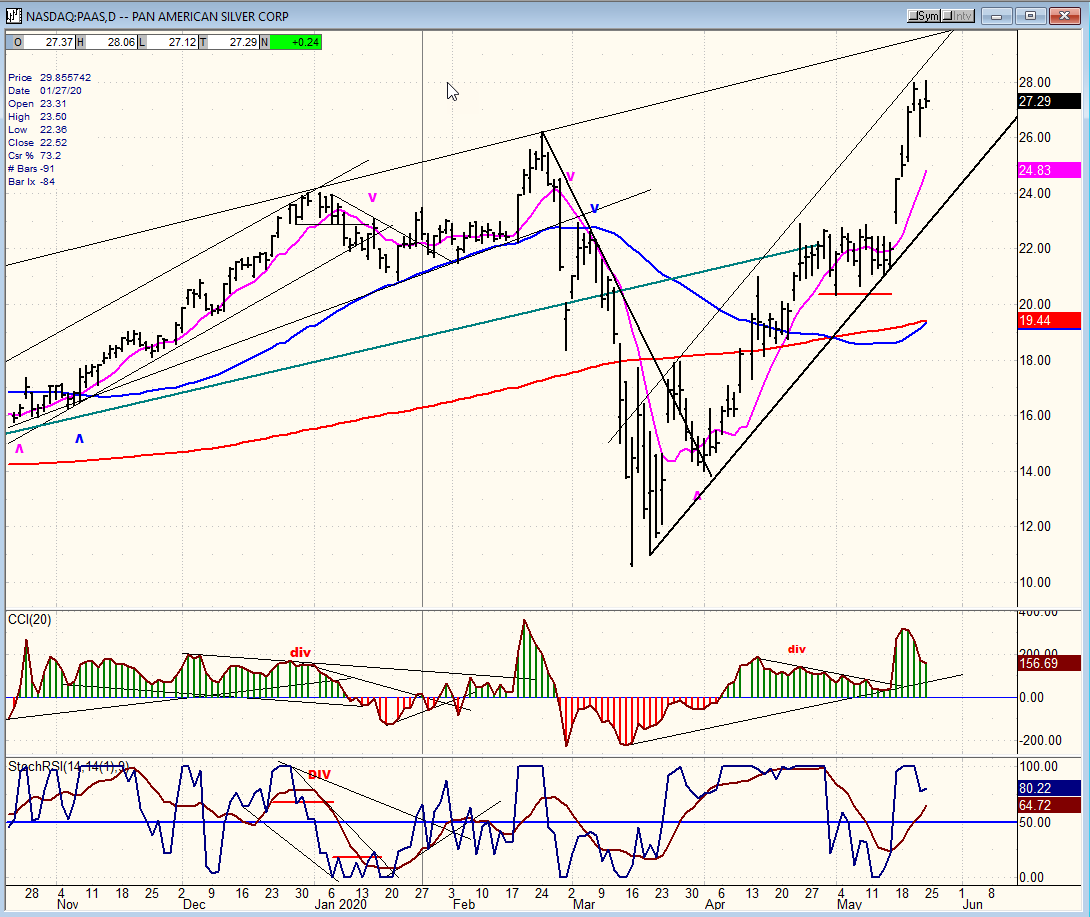
PAAS (Pan American Silver Corp.) daily
PAAS should be able to reach ~30.00 (in conjunction with GDX 39.00) before rolling over and starting a corrective pattern.
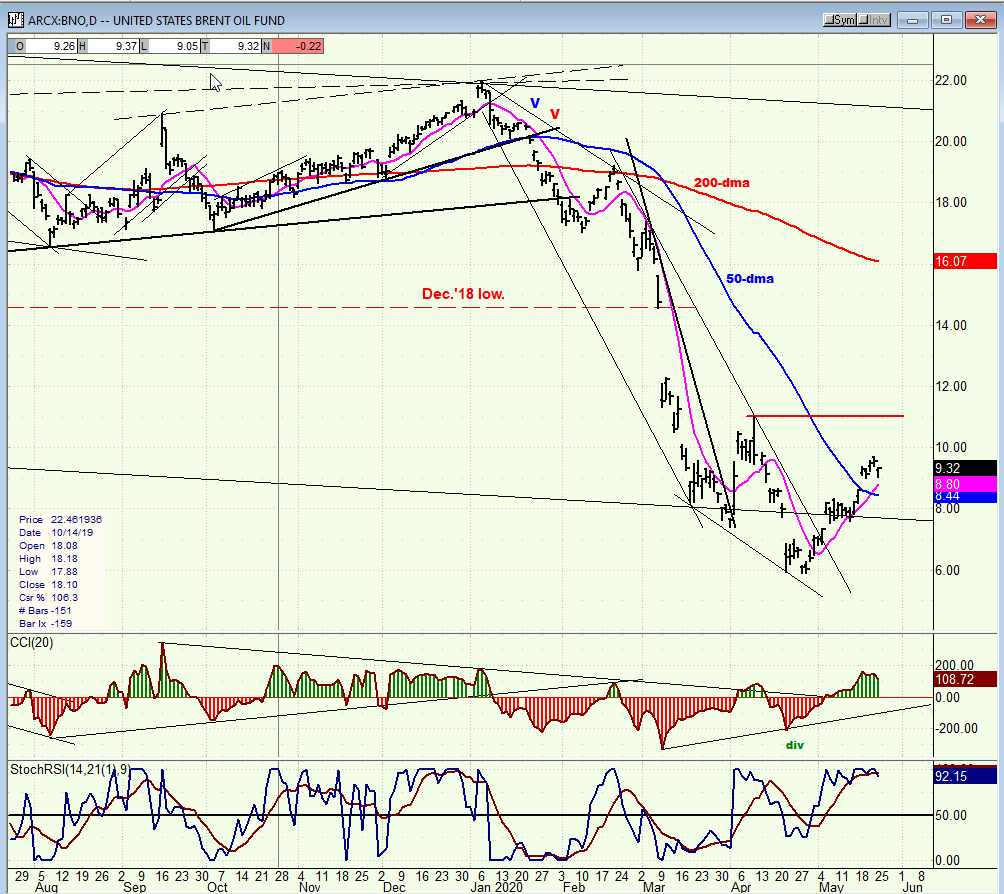
BNO (U.S. Brent oil fund) daily
BNO should push a little higher as SPX makes a short-term top before declining into the 80-day cycle low.
Summary
An “encroaching” cycle (52-day) made its low on 5/14 and altered the short-term index structure. This will reduce the future impact of the 80-day cycle to a much less significant decline than it would have been otherwise. Since the short-term top is not completely formed just yet, we will need to see just how much congestion is produced before we can gauge the cycle’s impact.
FREE TRIAL SUBSCRIPTON
With a trial subscription, you will have access to the same information that is given to paid subscribers, but for a limited time period. I think you will find that knowing how far a move can carry is one of the most useful benefits of this service, whether you are a trader or an investor -- especially when this price target is confirmed by reliable indicators which give advance warning of a market top or bottom. Furthermore, cycle analysis adds the all- important time element to the above price projections. For a FREE 4-week trial, further subscription options, payment plans, and for general information, I encourage you to visit my website at www.marketurningpoints.com.
The above comments about the financial markets are based purely on what I consider to be sound technical analysis principles. They represent my own opinion and are not meant to be construed as trading or investment advice, but are offered as an analytical point of view which might be of interest to those who follow stock market cycles and technical analysis.
********
share
share
share
share
share

When Andre Gratian was a stock broker years ago, a friend introduced him to technical analysis of the market. Consequently, it is not an exaggeration to say that Andre fell in love with this approach! Ever since then, it has become an increasingly important part of his professional life. Gratian has studied the works of Wyckoff, Edwards & Magee, Edward J. Dewey (cycles) and many others. However, one of my most profitable undertaking has probably been to study Point & Figure charting, which he finds invaluable in analyzing stocks and indices. If he were restricted to one methodology, this is the one that he would choose. This well-rounded background has given him what he feels to be a special insight into the stock market, facilitating the recognition of meaningful patterns and the ‘turning points’ in all trends, whether they be short or long term. Andre feels very comfortable discussing the stock market and passing on meaningful information to others. His subscribers include individuals and money managers throughout the world. Moreover, his Newsletters are currently published on several financial sites, here and abroad.


