Technical Analysis Of The Markets


Current Position of the Market
SPX Long-term trend: For now, the best guesstimate is that we are still in the bull market which started in 2009. Where we go from here and how far will be gauged after the September-October correction.
SPX Intermediate trend: Intermediate correction in progress.
Analysis of the short-term trend is done daily with the help of hourly charts. It is an important adjunct to the analysis of daily and weekly charts which discuss longer market trends.
Counter-trend Rally?
P&F: The short-term projects an Initial reversal to ~3330, then a potential for ~3400 (filled)
Note: I will discontinue the P&F projections in this portion of the letter. They are best incorporated in the newsletter itself and providing them here is redundant.
Cycles: Looking ahead! 90-yr cycle – last low: 1932. Next low: 2022
7-yr cycle – last low: 2016. Next low: 2023
Nest of short-term cycle lows on about 10/15-20
Market Analysis (Charts courtesy of QCharts
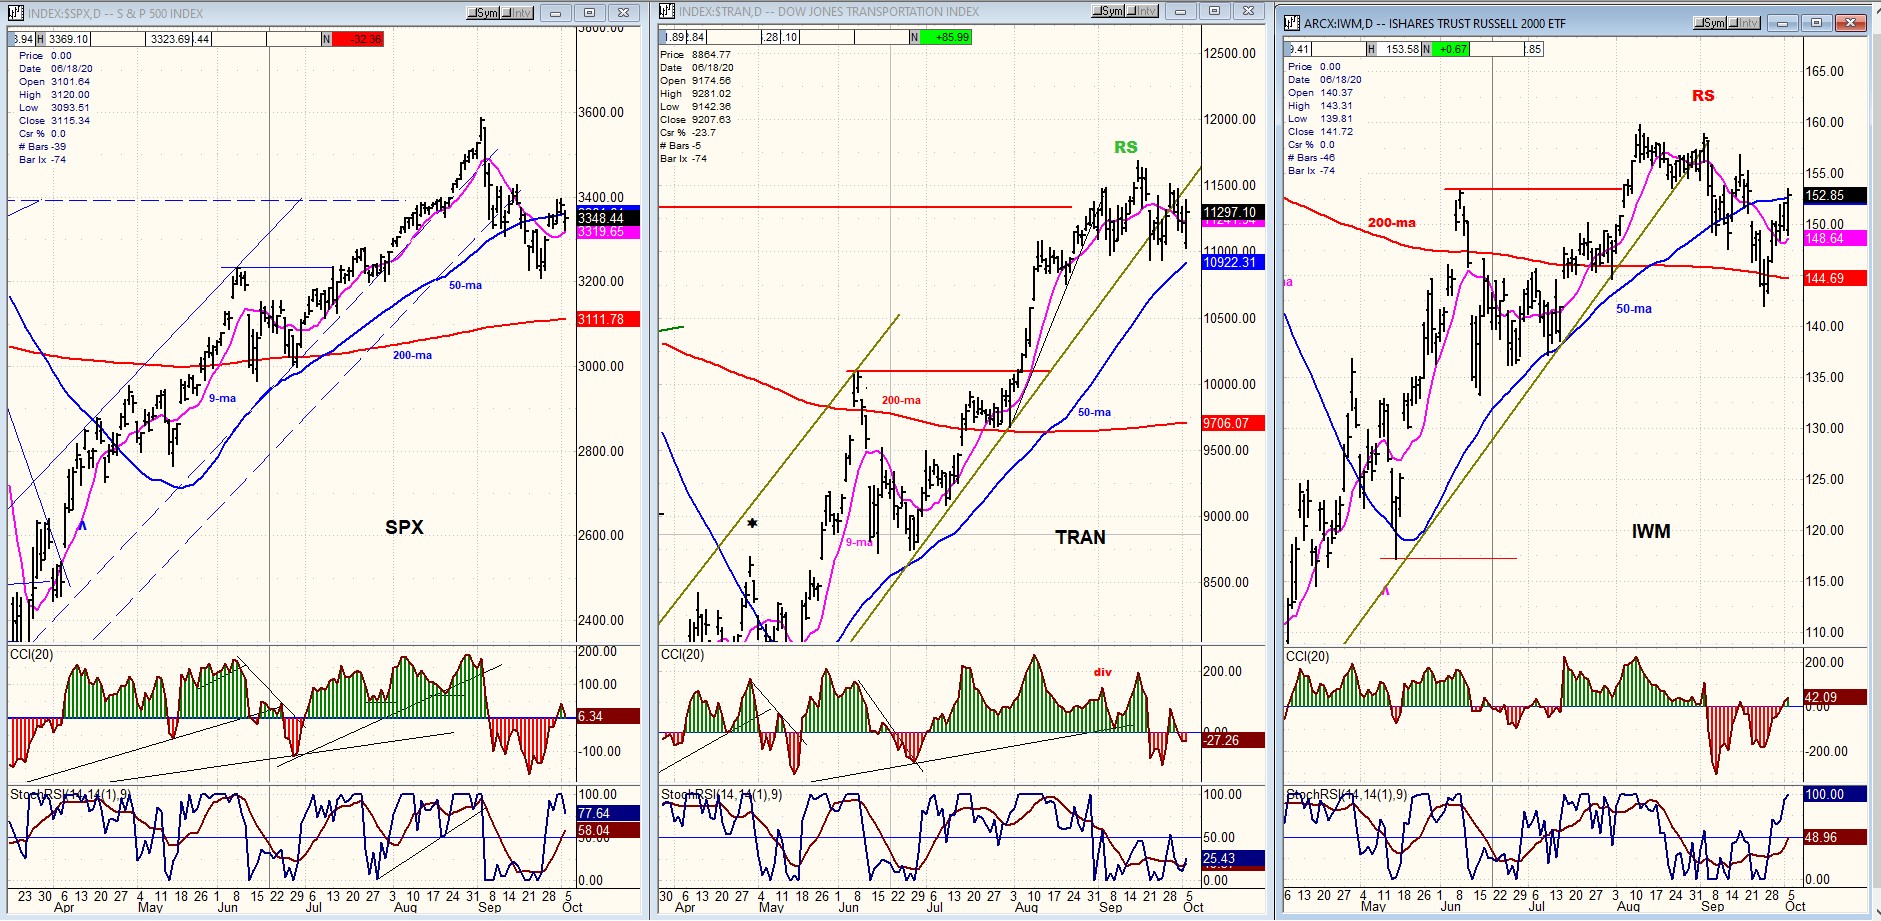
SPX-TRAN-IWM daily charts:
The relationship between SPX and what are considered leading indicators remained pretty much the same last week. This does not change the forecast for the market which is that we are in a corrective mode after having made an all-time high in the benchmark indexes in early September.
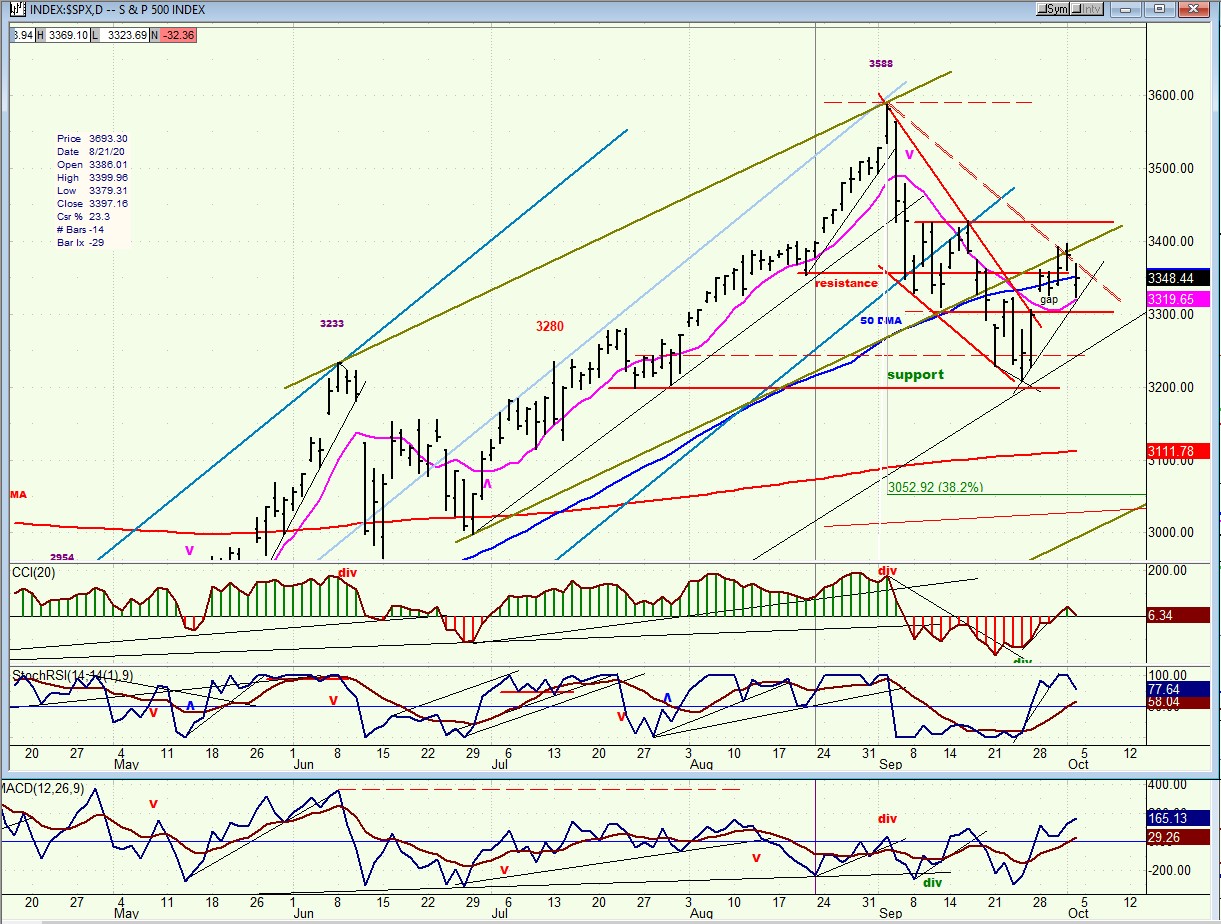
SPX daily chart
The SPX primary trend from the March low can be reduced to two phases: the first, (the strong phase) ended in early June at 3233, and the second, (the deceleration phase) still managed to take the index to a new all-time high of 3588 in early September. I have identified both with different color channels, and we can see on the chart that the bottom channel line of both was breached in the price corection which started on 9/03.
The index made an initial low on 9/24 after retracing 379 points to 3209 and bounced back to ~3400, finding resistance at the bottom channel line of the deceleration channel. This brought some selling, and on Friday SPX pulled back to 3320 before closing at 3348. The rebound from 3209 is likely nothing more than a rally in a downtrend which will soon give way to more selling and an extension of the correction from the high, but perhaps not until a slightly higher recovery high beyond 3400 has been reached.
As stated earlier, a normal correction of a .382 retracement of the uptrend from the March low could lead to a continuation of the selling pattern down to 3053. It could also retrace fifty percent of the uptrend, and this would take it down to about 2900 before the correction ends. After it is over, we should expect another market rally to unfold which has a fifty-fifty chance of making a new all-time high. In other words, we don’t know what will happen after this correction and we should give the market a chance to tell us.
An outside possibility is that the current correction will end at the recent low of 3320. I would give that possibility very low odds, but as long as we have not triggered a sell signal at the weekly time frame, we cannot exclude this possibility.
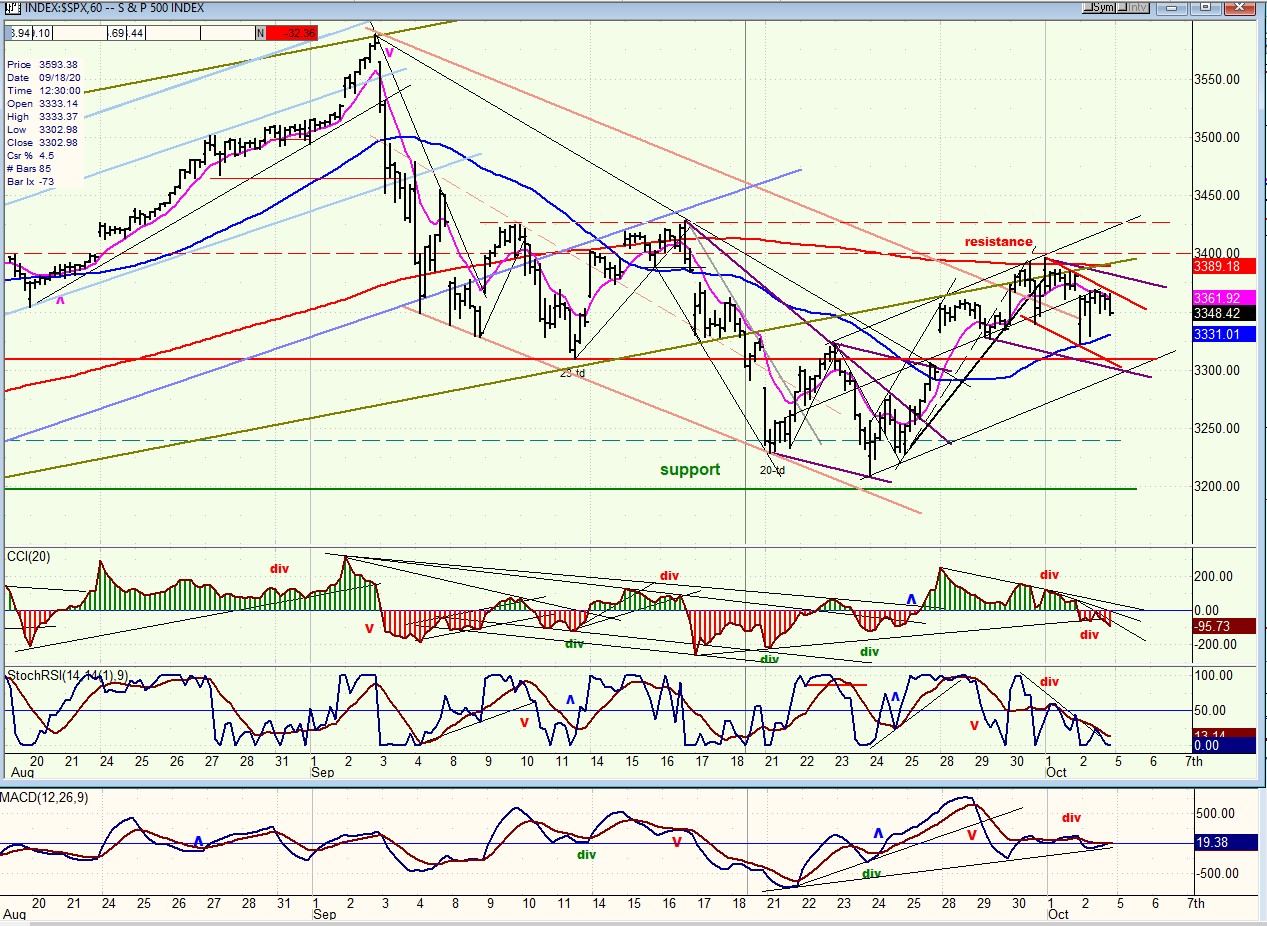
SPX hourly chart
The hourly chart gives us a chance to examine the short-term more closely. We have been in a corrective mode since the 3588 top and there is no sign that the correction is over. The most likely scenario is that we are simply completing the first phase of the decline and that we are having a mid-course consolidation. That consolidation may itself be only halfway over and we could challenge ~3400 one more time before we extend the main corrective pattern to the lower levels suggested above.
For now, a continued near-term downtrend to about 3300 is possible before beginning the next phase of this countertrend move which, if it takes place, would be limited to next week.
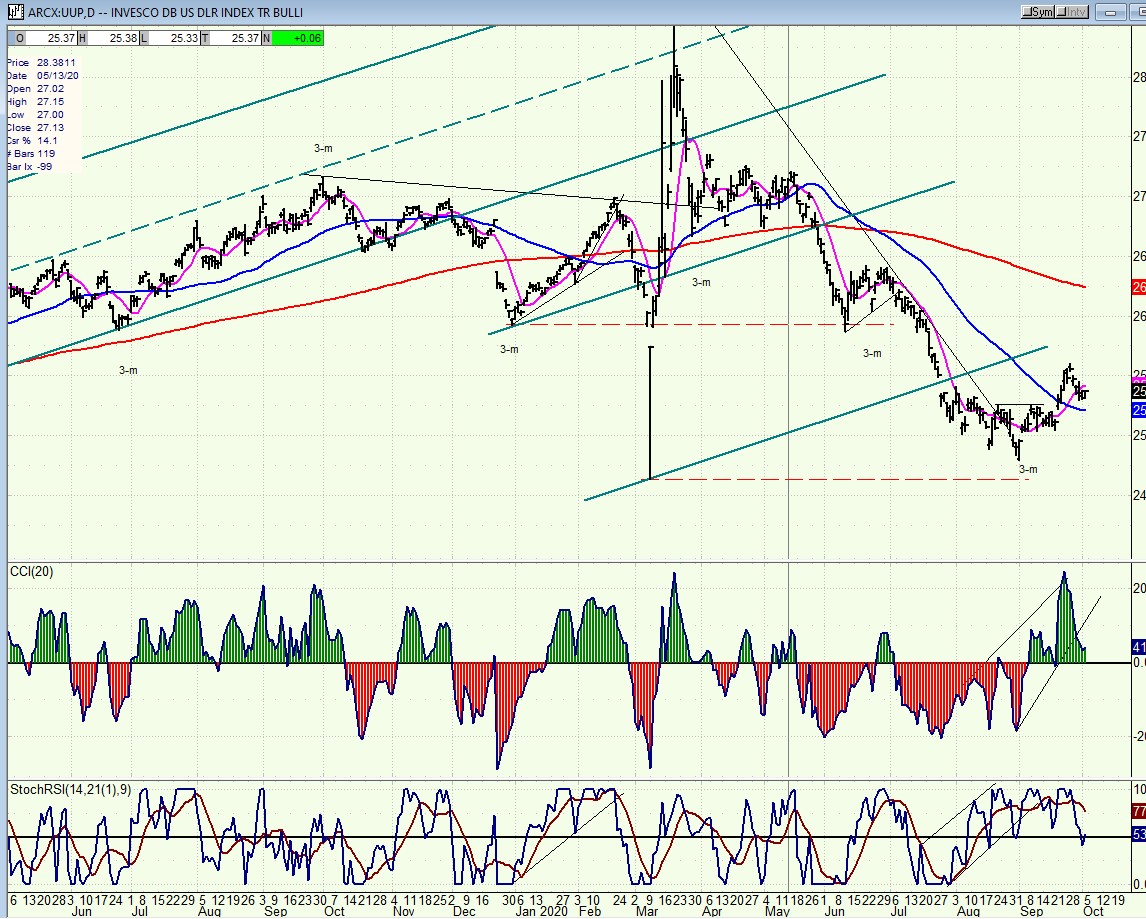
UUP (dollar ETF) ($USD chart not available from this data provider)
UUP has rebounded since the 3-mo low was made in early September and it is currently consolidating for another advance which should take it a little higher before it reaches its intermediate objective.
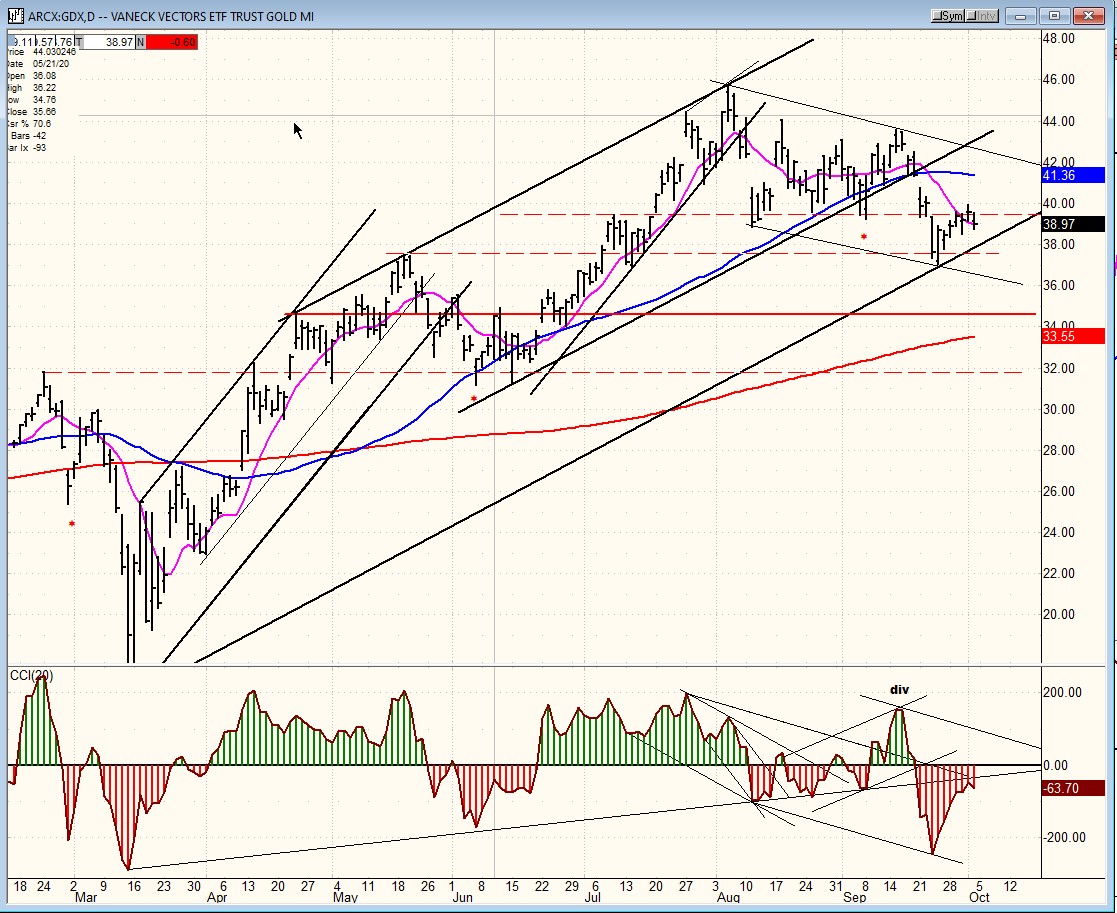
GDX (gold miners)
GDX continues to consolidate after nearly tripling in price since its March low. There is no sign that the consolidation is over, and it is likely that slightly new lows will be seen before it ends. This is a consolidation in an uptrend which has a much higher price projection based on a four-year accumulation pattern.
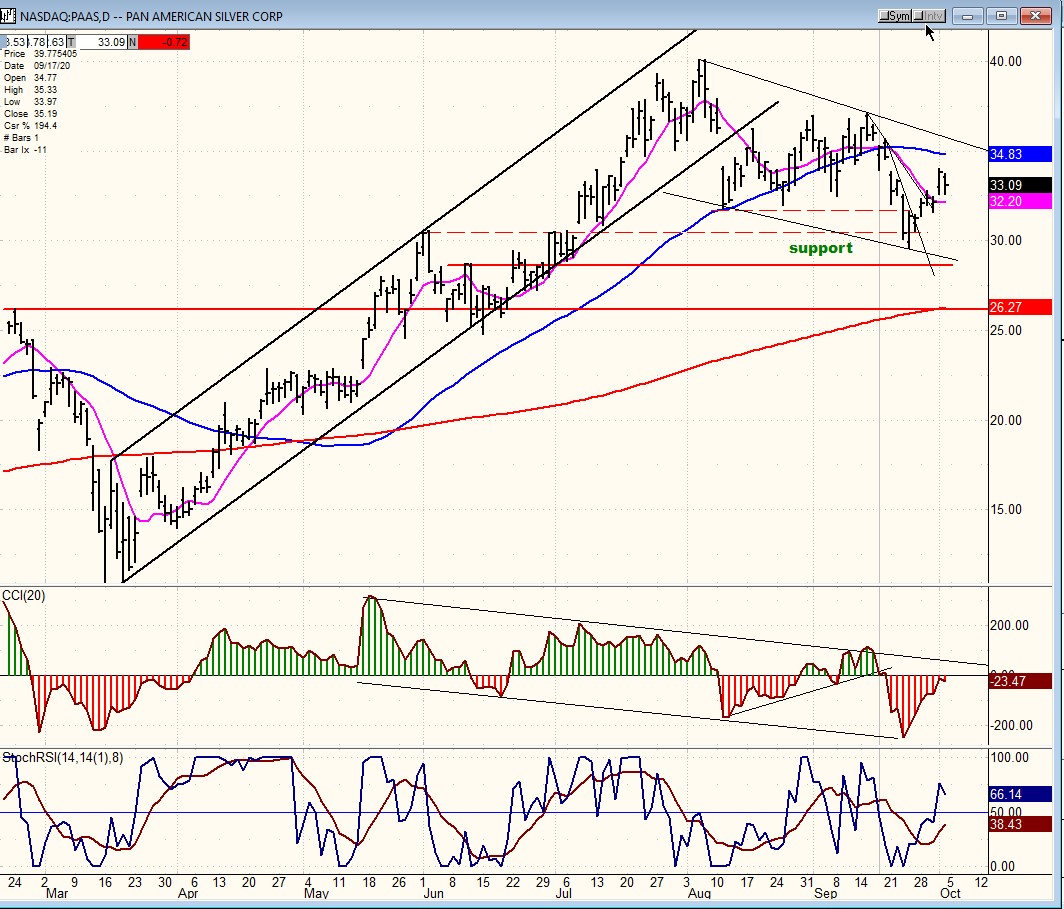
PAAS (Pan American Silver Corp)
PAAS is generally stronger than GDX, having nearly quadrupled in price since its March low, but its price pattern is pretty much in sync with GDX. The current consolidation/correction is likely to take it to at least 29 and perhaps even a little lower.
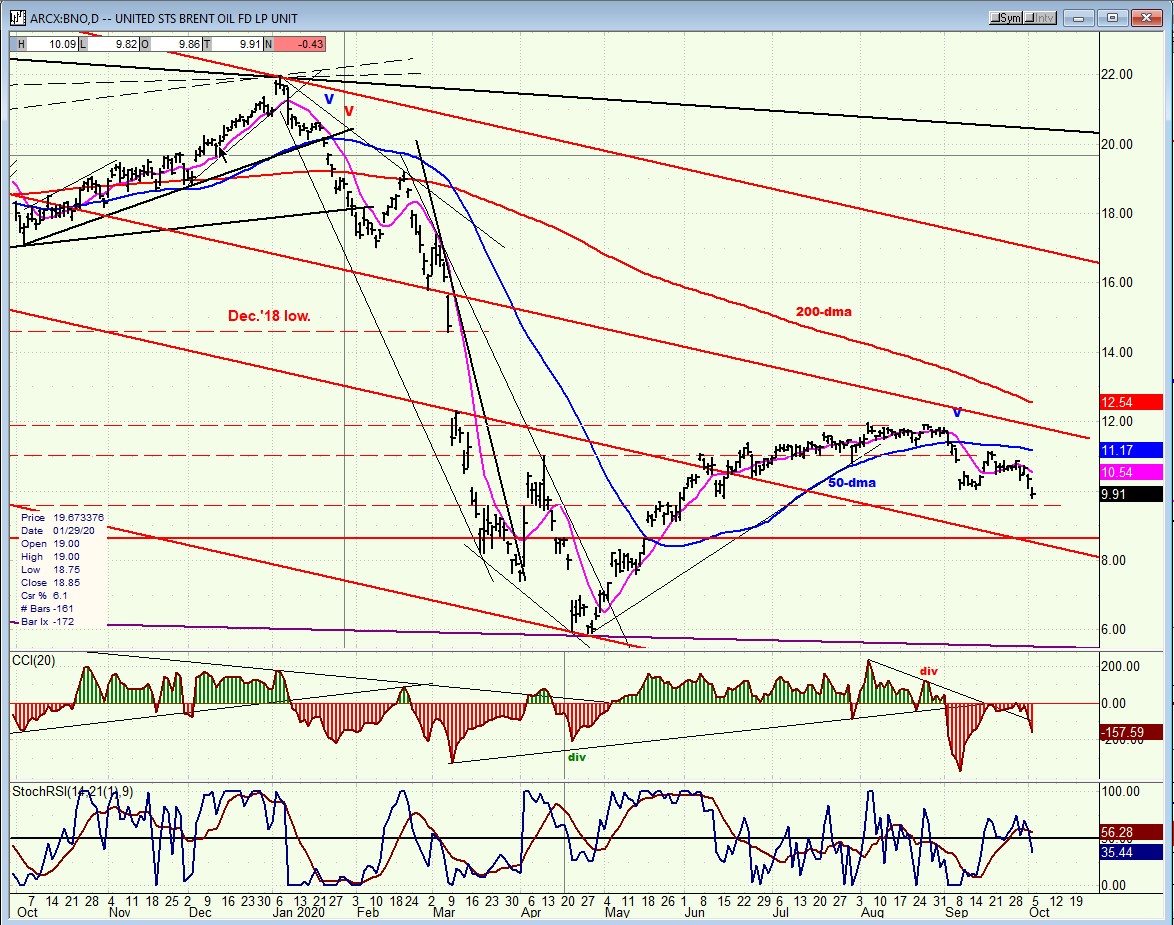
BNO (U.S. Brent Oil fund)
BNO continues to correct and could find at least temporary support a little lower and bounce; but that does not necessarily mean that the entire correction will be over.
Summary
SPX is likely about halfway through its correction and in a temporary uptrend which may already be over if it loses too much ground over the next couple of days -- even though cycles appear to be favorable to an extension of the mid-course consolidation for another week.
Free Trial Subscription
With a trial subscription, you will have access to the same information that is given to paid subscribers, but for a limited time-period. Over the years, I have developed an expertise in P&F charting (price projection), cycles (timing), EWT (structure), and general technical analysis which enables me to warn subscribers of pending reversals in market trends and how far that trend can potentially carry. For a FREE 4-week trial, subscription options and payment plans, I encourage you to visit my website at www.marketurningpoints.com.
The above comments and those made in the daily updates and the Market Summary about the financial markets are based purely on what I consider to be sound technical analysis principles. They represent my own opinion and are not meant to be construed as trading or investment advice but are offered as an analytical point of view which might be of interest to those who follow stock market cycles and technical analysis.
********

When Andre Gratian was a stock broker years ago, a friend introduced him to technical analysis of the market. Consequently, it is not an exaggeration to say that Andre fell in love with this approach! Ever since then, it has become an increasingly important part of his professional life. Gratian has studied the works of Wyckoff, Edwards & Magee, Edward J. Dewey (cycles) and many others. However, one of my most profitable undertaking has probably been to study Point & Figure charting, which he finds invaluable in analyzing stocks and indices. If he were restricted to one methodology, this is the one that he would choose. This well-rounded background has given him what he feels to be a special insight into the stock market, facilitating the recognition of meaningful patterns and the ‘turning points’ in all trends, whether they be short or long term. Andre feels very comfortable discussing the stock market and passing on meaningful information to others. His subscribers include individuals and money managers throughout the world. Moreover, his Newsletters are currently published on several financial sites, here and abroad.


