Technical Analysis Of The Markets


Current Position of the Market
SPX Long-term trend: There is some good evidence that we are still in the bull market which started in 2009.
SPX Intermediate trend: An intermediate correction has ended.
Analysis of the short-term trend is done daily with the help of hourly charts. They are important adjuncts to the analysis of daily and weekly charts which discuss longer market trends.
Uptrend in Process
Cycles: Looking ahead! 90-yr cycle – last low: 1932. Next low: 2022
7-yr cycle – last low: 2016. Next low: 2023
Market Analysis (Charts courtesy of QCharts
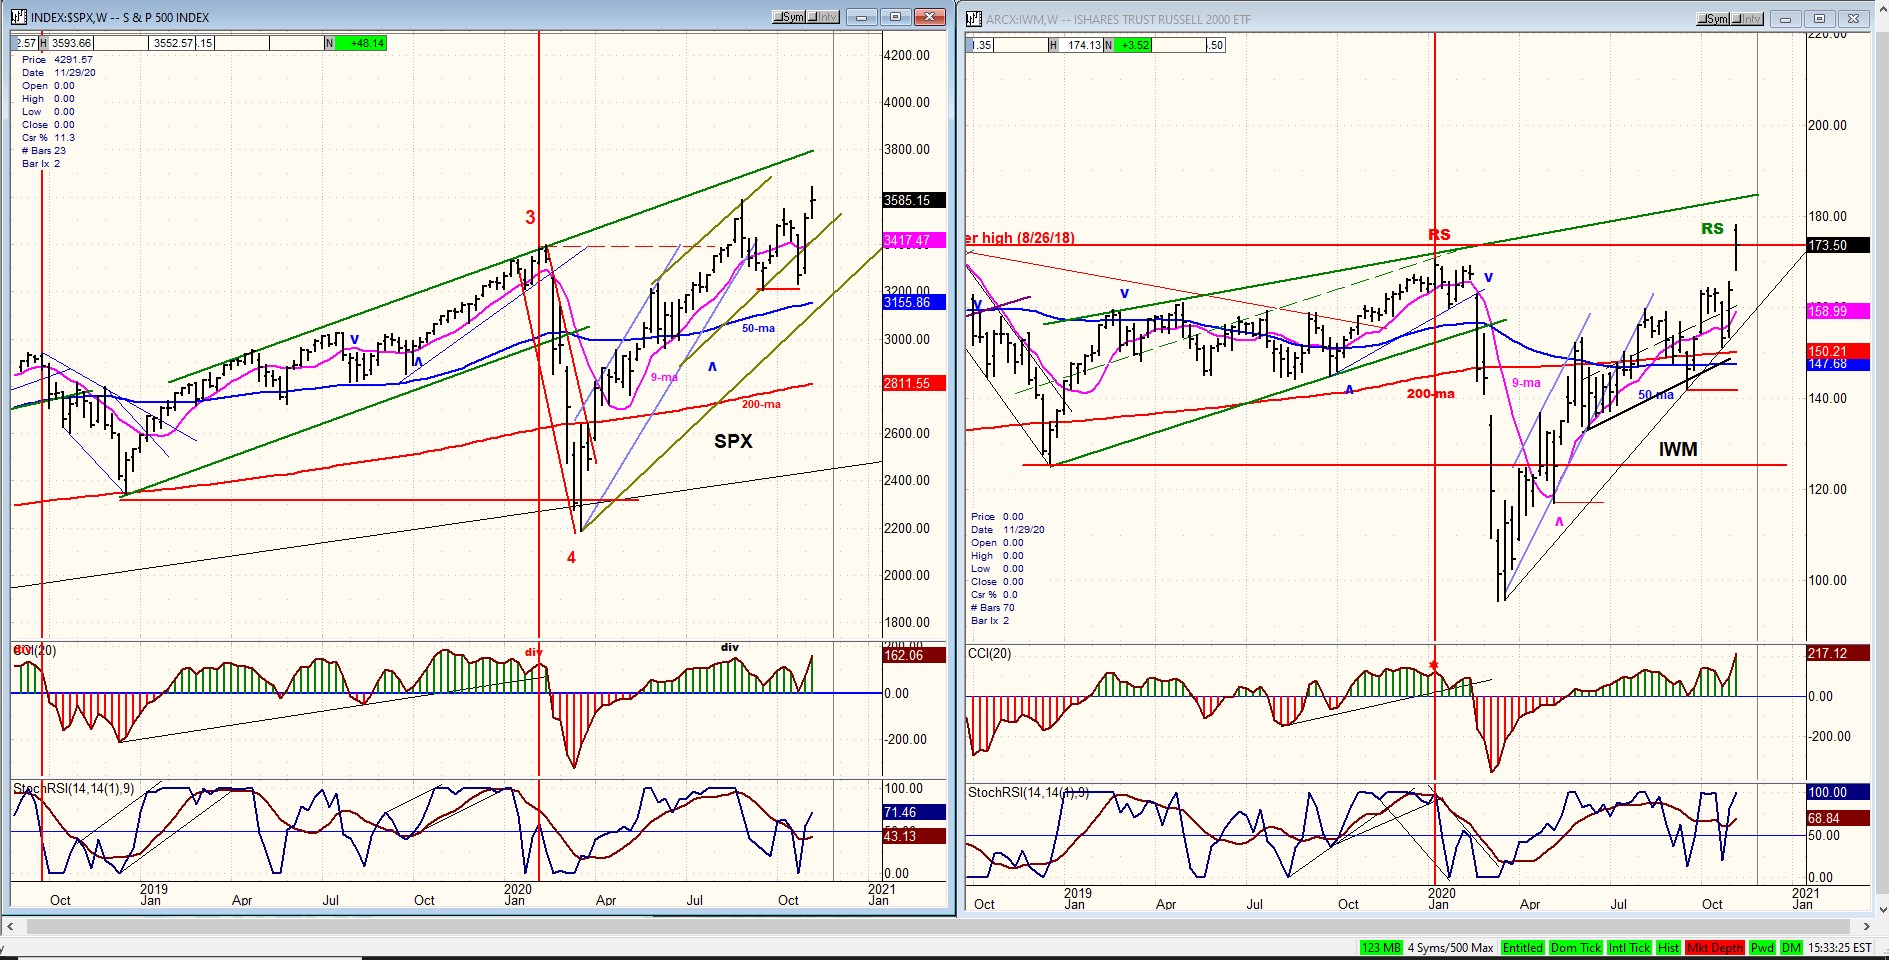
SPX-IWM weekly charts
If there is any question about the market’s position take a look at IWW which not only surged ahead of SPX this past week, but drove past its 8/26/’18 price to make a new all time high. We don’t need to elaborate on this feat but just let the evidence speak for itself: the bull market is still alive and well!
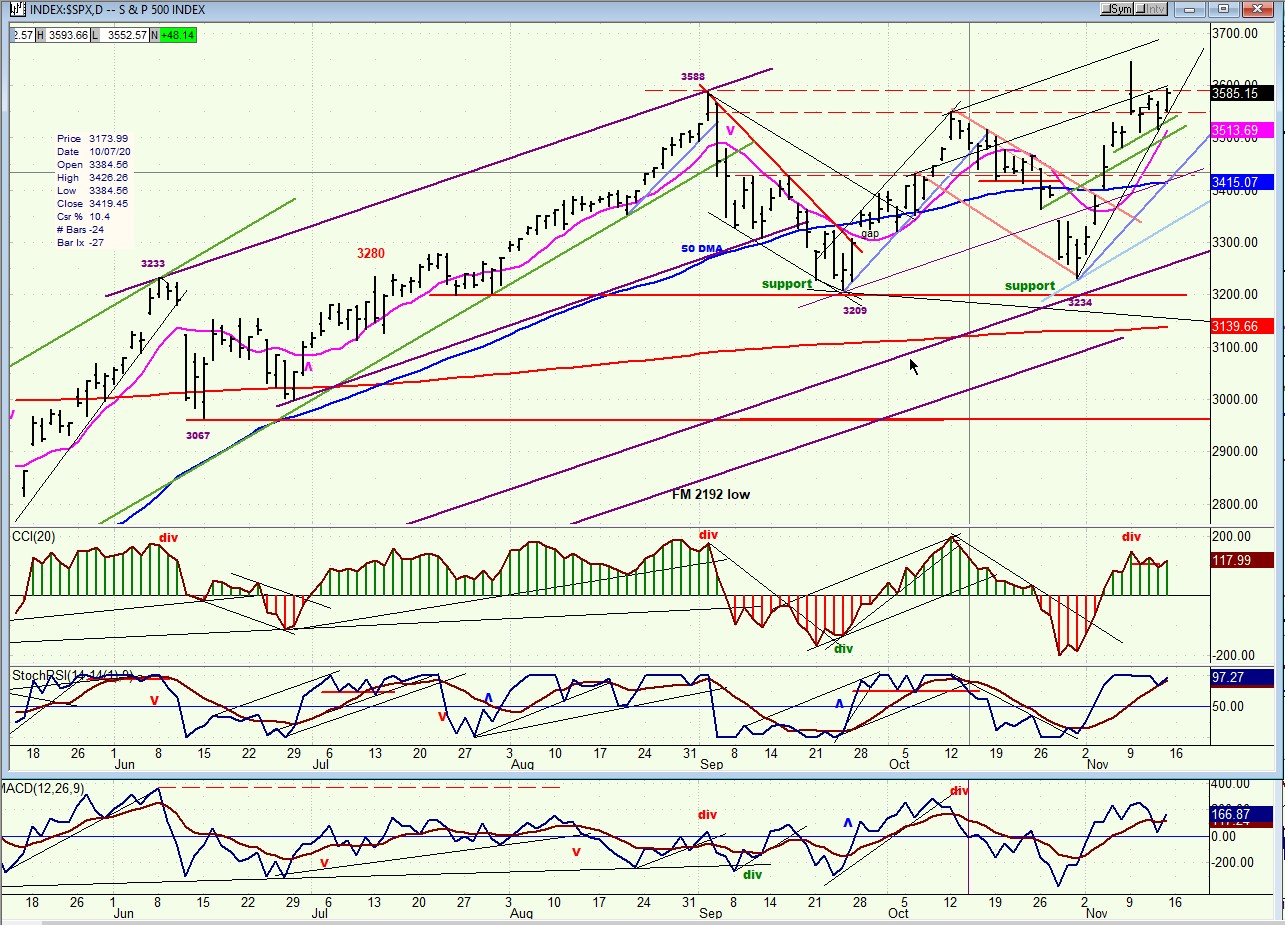
SPX daily chart
After a 3-day consolidation, SPX appears to be resuming its uptrend, confirming that the new bull market high made on Monday was not a fluke. After a brief hesitation, all three oscillators turned back up on Friday and, for the first time since 2008, IWM made a new all-time high.
Before we get carried away too far with all this bullishness, let’s not forget that there is also ample evidence that we are now in the 5th wave of the bull market, though exactly how close to the top remains to be determined. Perhaps we should enjoy the ride and let IWM warn us when we are near the end of the move.
For now, the P&F chart continues to be our most reliable guide for short and intermediate trends. It currently suggests that the next intermediate top will come at ~4150.
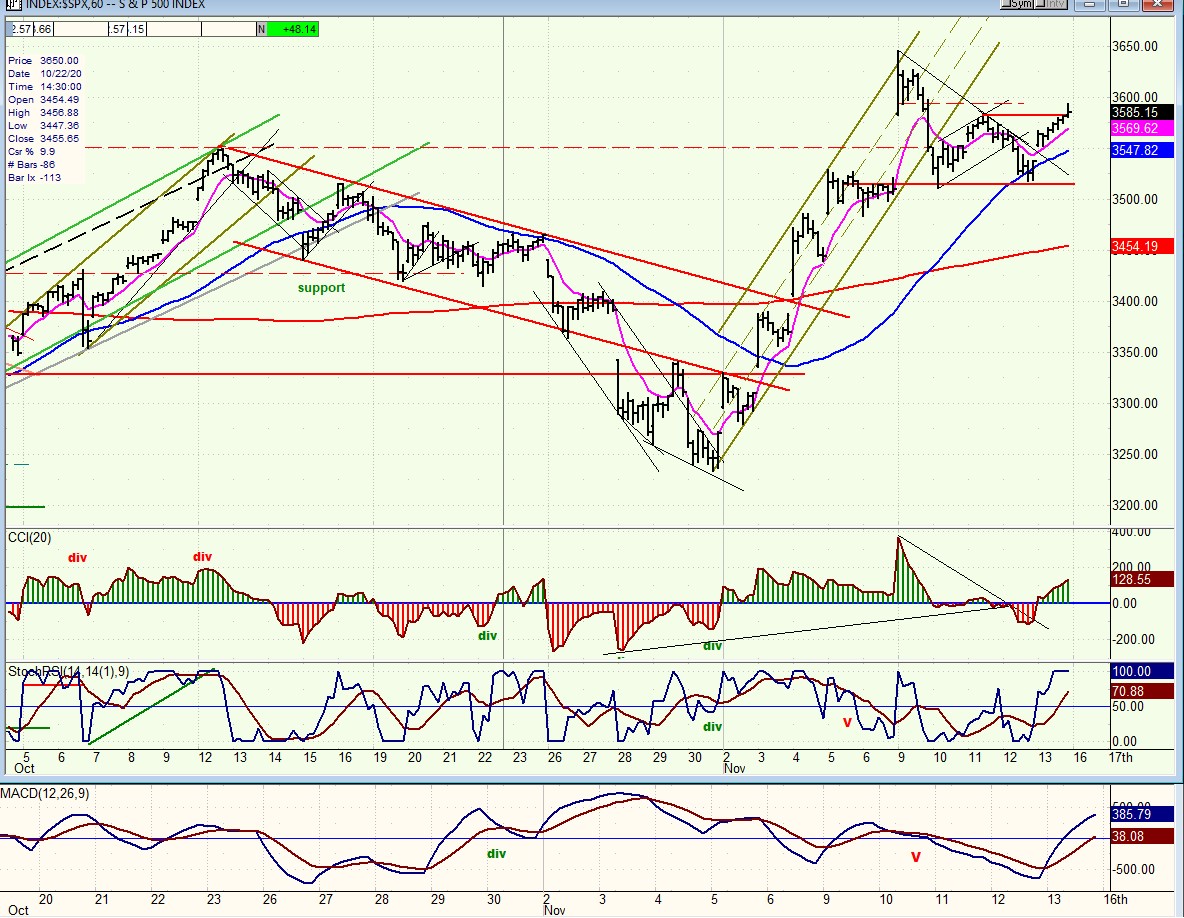
SPX hourly chart
Under “Cycles” (above), I had stated that the next intermediate low would probably come in mid-November. That looks to have been fairly accurate, although a slightly deeper correction had been anticipated. The next minor cycle bottomed on Thursday; and there could be one more due over the next day or two. After that, it should be clear selling on the upside again!
The move from 3234 has all the appearance of a break-out move which did not stop until after it had exceeded the previous high of 3550 as well as the all-time high of 3588. This is also demonstrated by the steep angle of the advance. After this minor consolidation is over, new highs should follow but at a less-steep incline until the index has reached its next projection target of about 4150. With each new high, we need to relate the SPX performance to that of IWM to make sure that the latter is not warning of an important top. However, our current concern should be to look for an intermediate top, but not yet for the top of the bull market which, if Erik Hadik is correct, may not come until April-May 2021.
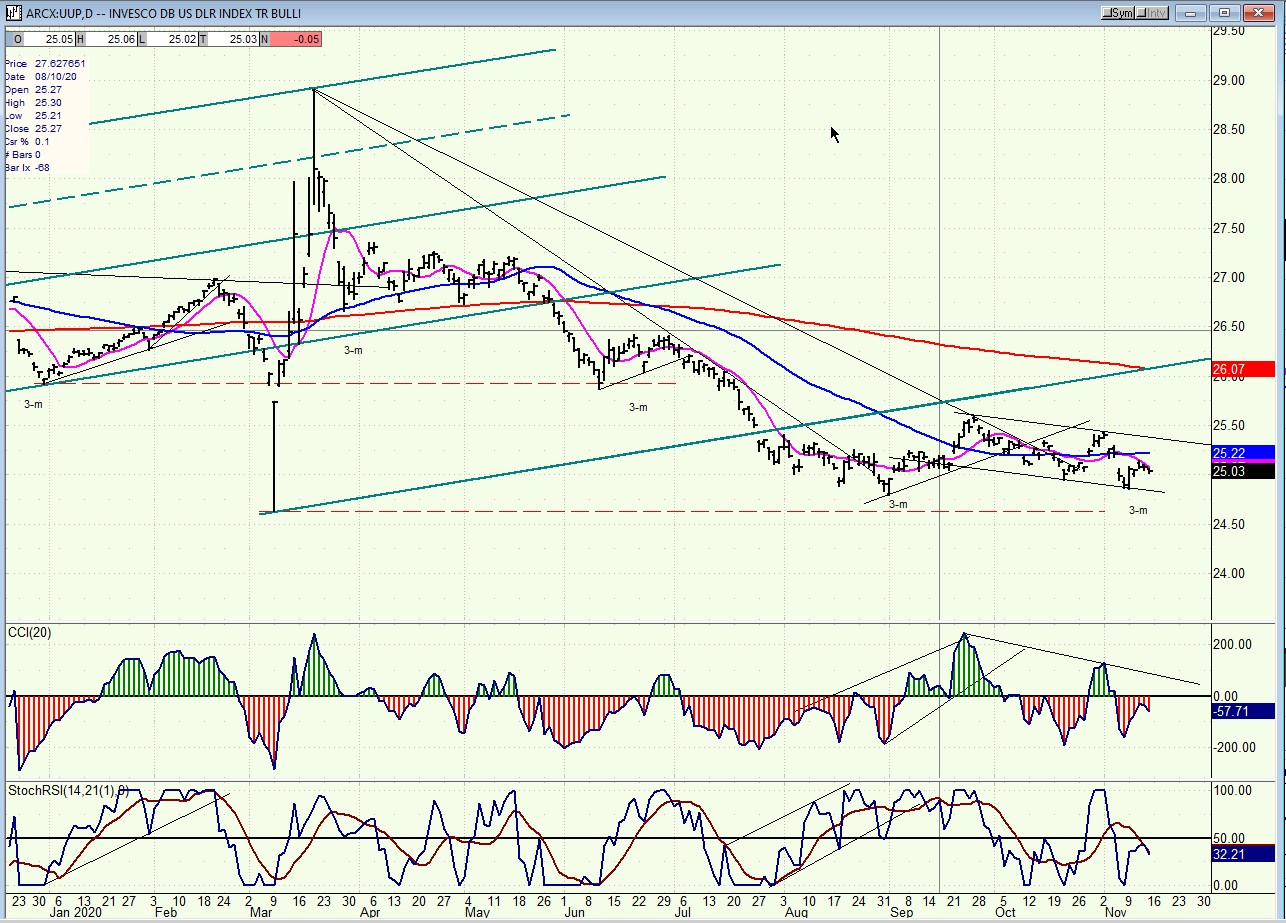
UUP (dollar ETF) ($USD chart not available from this data provider)
After a mild correction, UUP probably made its 3-mo cycle low and looks ready to extend its move higher, at least during the early stages of the cycle up-phase. This may not have much of an adverse effect on gold, but it could delay the resumption on the latter’s major uptrend.
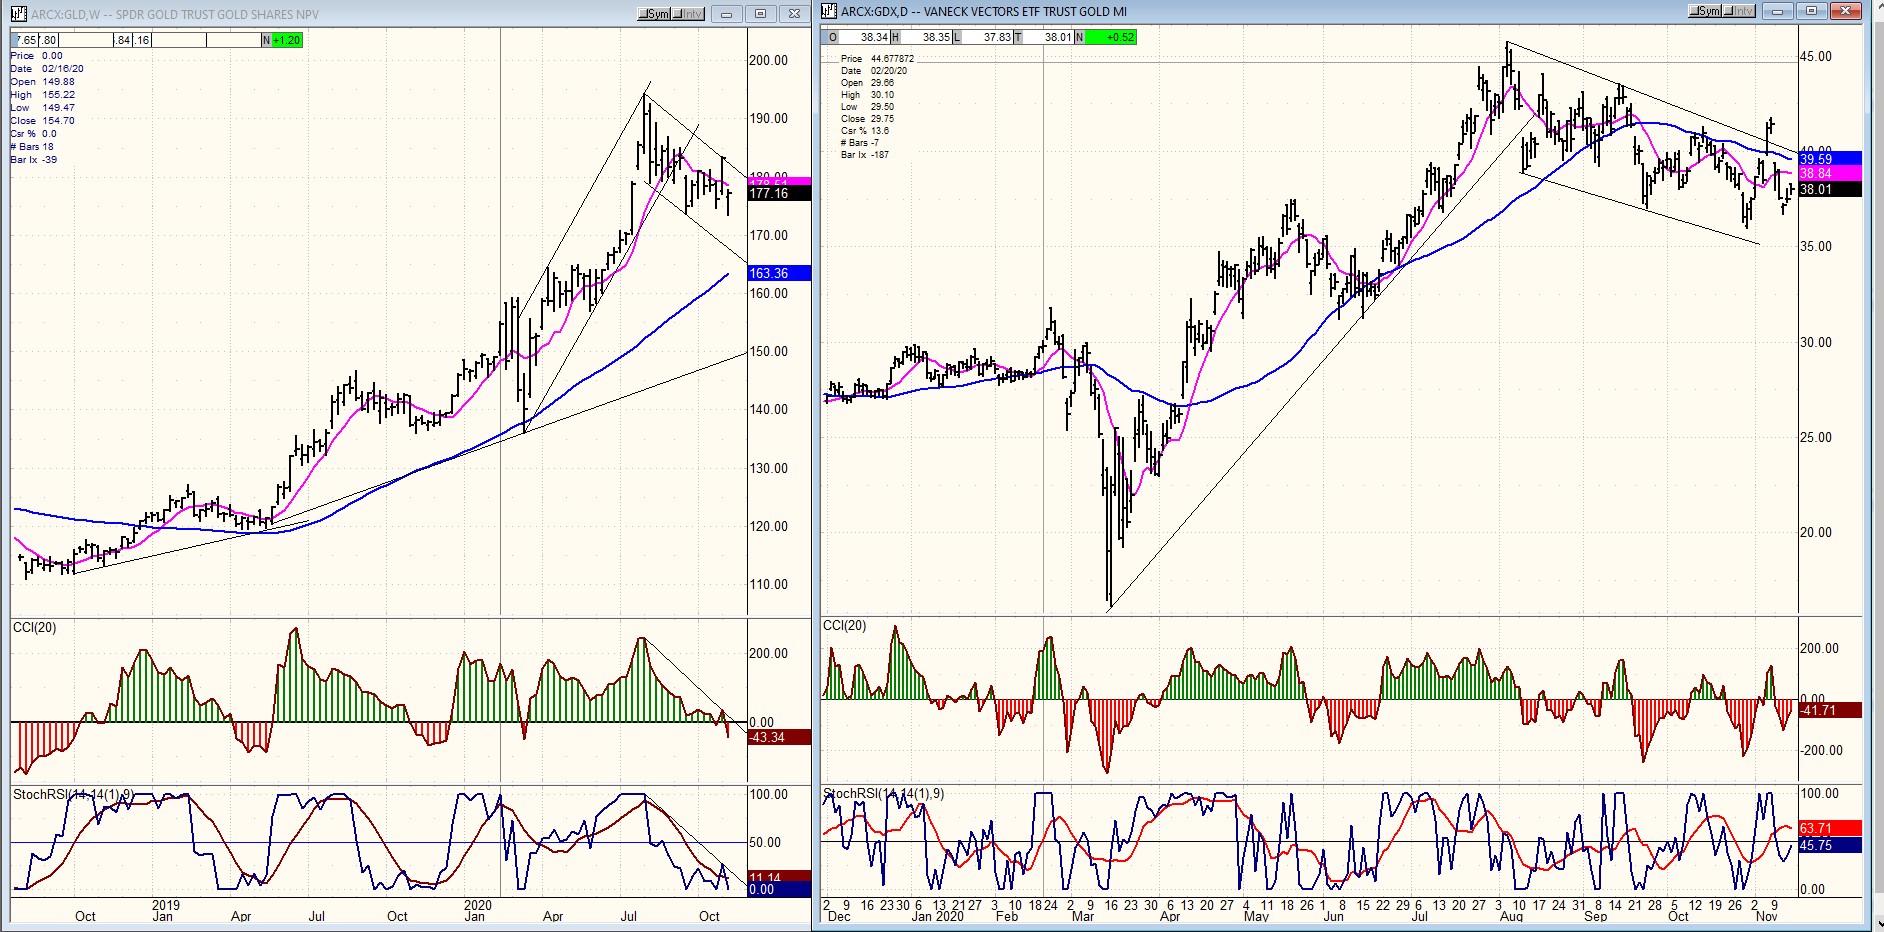
GLD (gold-wkly), GDX (gold miners-dly)
I am now charting GLD (gold ETF) and GDX side by side because this will help to evaluate the performance of GDX more accurately. One can see that both charts are in strong uptrends and that they are both engaged in a correction after making a new high in July. We could expect a little more consolidation from gold, since UUP just made its cycle low, but historically the cyclic correlation with gold, and especially with GDX, does not seem to be that reliable. It is therefore more prudent to judge GLD and GDX on their own merits. Even looking at the performance of GDX vs. GLD, we cannot draw exact correlations since GLD remained well above its 2019 low during the March 2020 correction, while GDX dropped beyond its 2019 low by a small margin.
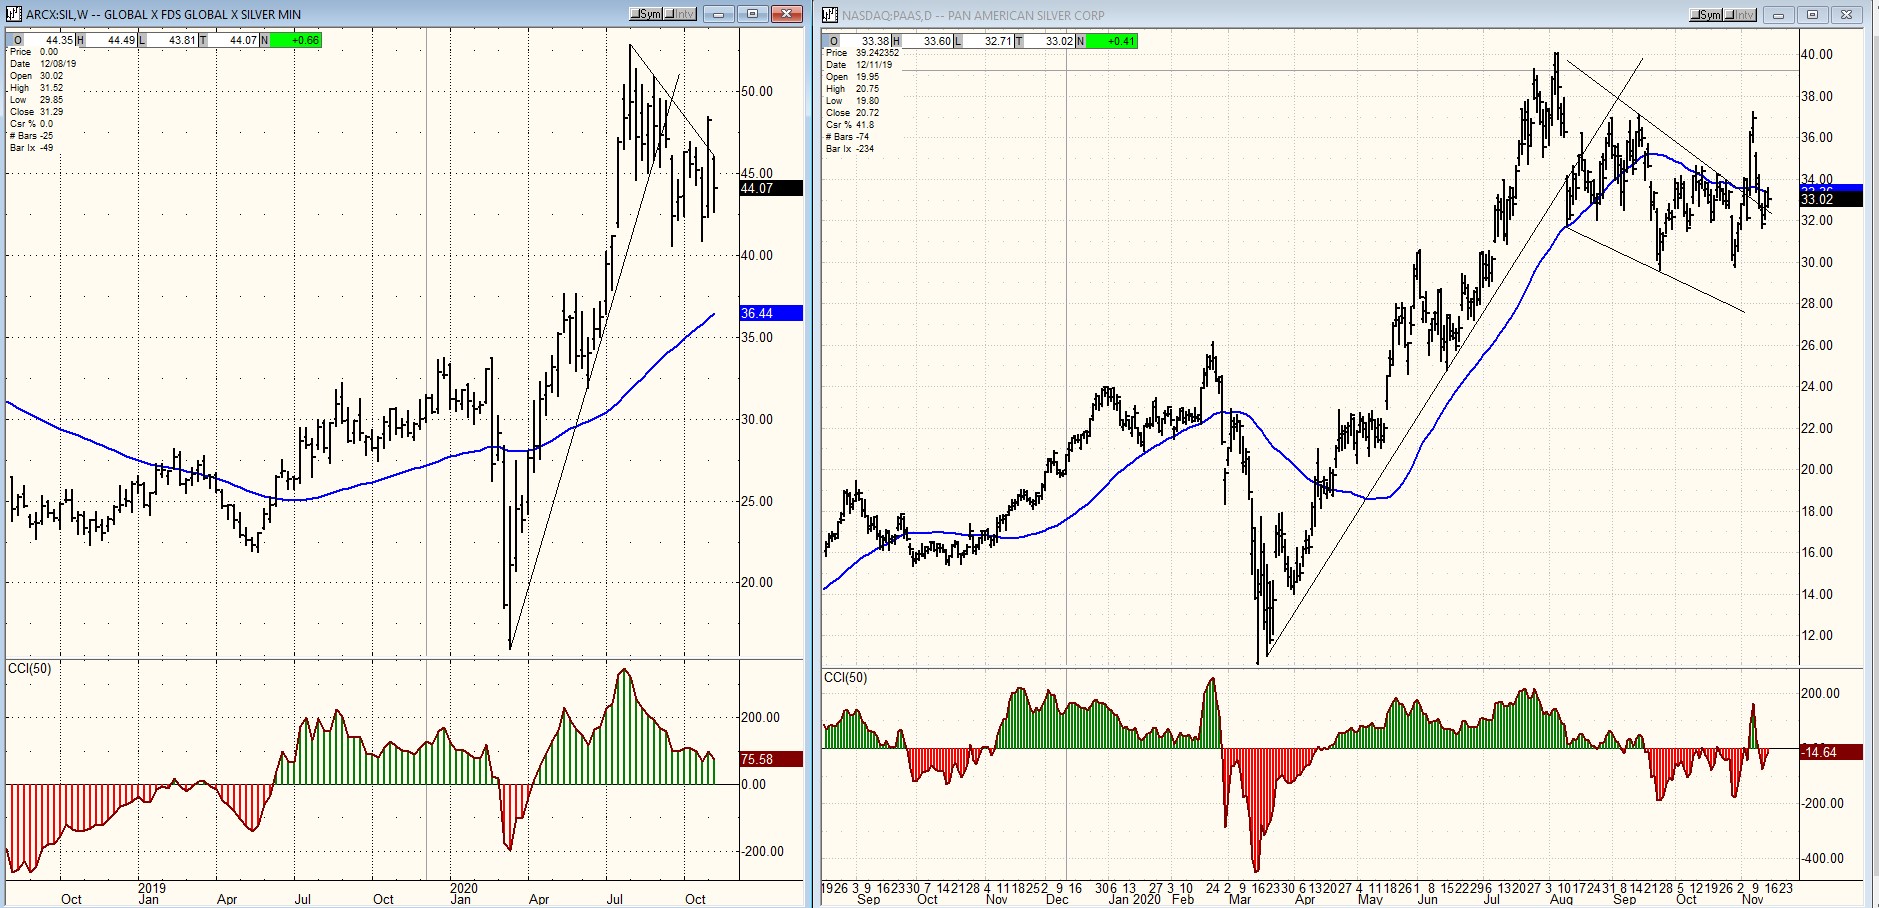
SIL (silver-wkly), PAAS (Pan American Silver Corp-dly)
I am also starting to chart PAAS on the same page as SIL. Both appear to be more closely correlated than GLD and GDX. It is also evident that SIL and PAAS are both undergoing an intermediate correction, and that in their case also, UUP’s action may delay the continuation of their long-term uptrend.
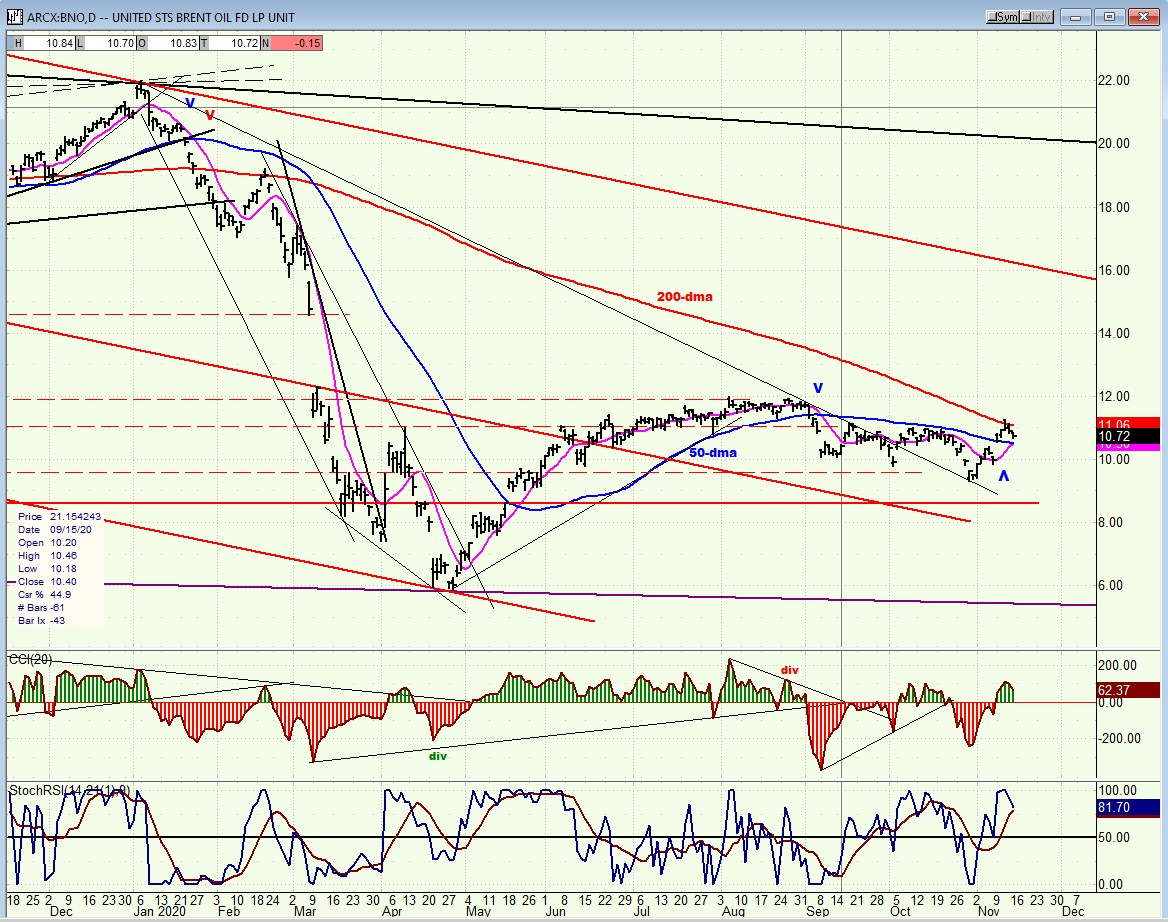
BNO (U.S. Brent Oil fund)
I have mentioned in the past that BNO tends to move with the market. This was glaringly exemplified by BNO’s crash along with SPX earlier this year but BNO, although it did recover from its earlier plunge, did not do so to the extent that SPX did, and spent most of the year making a base. With the market in a new uptrend, it now appears to be ready to move higher. It has already risen above the 50-dma (important) and may be ready to do the same with its 200-dma. This action could trigger a move to about 14 in the near future.
SUMMARY
SPX made in intermediate low on 10/30 and is resuming its uptrend. This move is expected to carry to about 4150 before the next intermediate correction takes place.
Andre
NOTE: You may now view our new website at https://marketurningpoints.com
Free trial subscription
With a trial subscription, you will have access to the same information that is given to paid subscribers, but for a limited time-period. Over the years, I have developed an expertise in P&F charting (price projection), cycles (timing), EWT (structure), and general technical analysis which enables me to warn subscribers of pending reversals in market trends and how far that trend can potentially carry. For a FREE 2-week trial, subscription options and payment plans, I encourage you to visit my website at https://marketurningpoints.com
The above comments and those made in the daily updates and the Market Summary about the financial markets are based purely on what I consider to be sound technical analysis principles. They represent my own opinion and are not meant to be construed as trading or investment advice but are offered as an analytical point of view which might be of interest to those who follow stock market cycles and technical analysis.
********

When Andre Gratian was a stock broker years ago, a friend introduced him to technical analysis of the market. Consequently, it is not an exaggeration to say that Andre fell in love with this approach! Ever since then, it has become an increasingly important part of his professional life. Gratian has studied the works of Wyckoff, Edwards & Magee, Edward J. Dewey (cycles) and many others. However, one of my most profitable undertaking has probably been to study Point & Figure charting, which he finds invaluable in analyzing stocks and indices. If he were restricted to one methodology, this is the one that he would choose. This well-rounded background has given him what he feels to be a special insight into the stock market, facilitating the recognition of meaningful patterns and the ‘turning points’ in all trends, whether they be short or long term. Andre feels very comfortable discussing the stock market and passing on meaningful information to others. His subscribers include individuals and money managers throughout the world. Moreover, his Newsletters are currently published on several financial sites, here and abroad.


