Technical Analysis Of The Markets


Current Position of the Market
SPX Long-term trend: There is some good evidence that we are still in the bull market which started in 2009 and which could continue into the first half of 2021 before coming to an end.
SPX Intermediate trend: May continue until SPX reaches ~4150 (March 2021).
Analysis of the short-term trend is done daily with the help of hourly charts. They are important adjuncts to the analysis of daily and weekly charts which determine longer market trends.
Last pull-back before intermediate top?
Cycles: Looking ahead! 90-yr cycle – last low: 1932. Next low: ~2022. (inversion likely)
7-yr cycle – last low: 2016. Next low: 2023
Market Analysis (Charts courtesy of QCharts
Except for some relative weakness in the last two days of the week, IWM has kept up with SPX, although even such a small margin of divergence has, in the past, indicated that a minor correction could lie ahead. This may be the case again since other signs, such as negative divergence in the daily oscillators is also warning of a potential reversal.
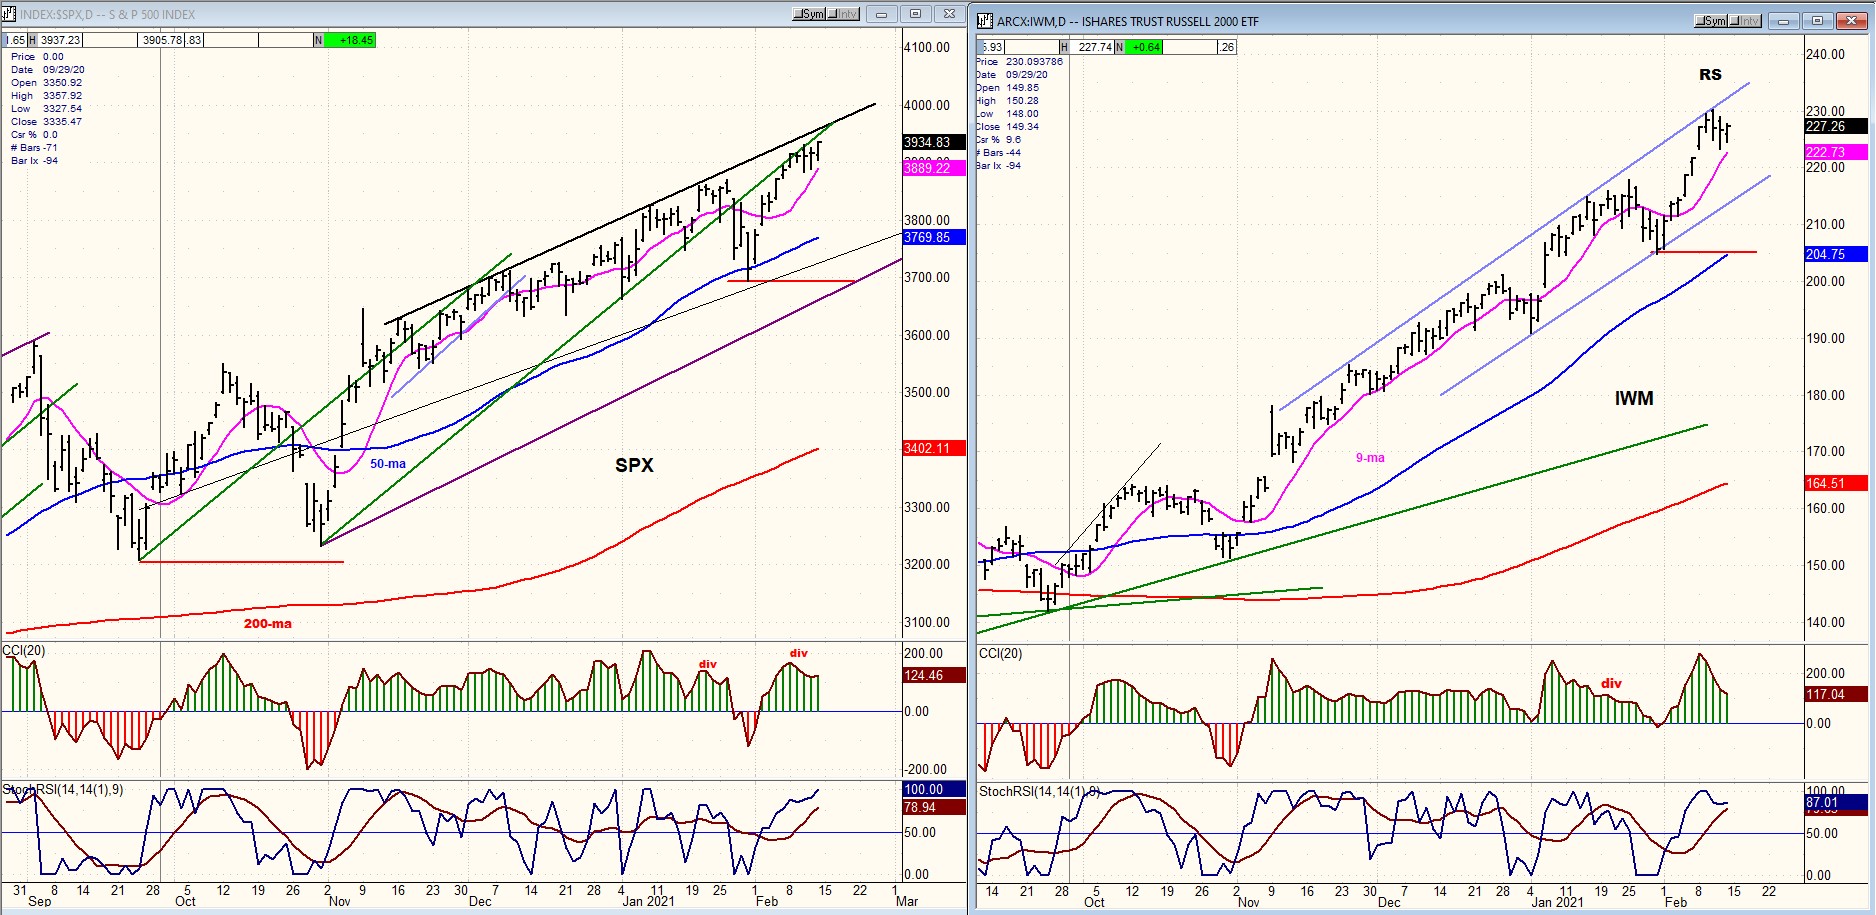
SPX daily chart
On Friday, SPX closed at a new all-time high slightly surpassing the price level established two days earlier, but it did so as negative divergence was being registered in the CCI. A month ago, a similar pattern was created in the price and in the CCI. This resulted in a short-term correction of about 175 points which occurred when the index broke below a trend line which originated at the intermediate low of 3234. A corrective pattern of similar degree could repeat itself if the index trades outside of the small blue channel which has held price in an uptrend since the last short-term low.
With SPX approaching 3950, it places it only two hundred points away from the target of 4150 which has been designated as an intermediate top based on a count obtained from the Point & Figure chart pattern that was created during the low of March 2020. This is still not likely to be the top of the bull market which started in March 2009, and that honor may be relinquished to the following important high in the vicinity of 4450 (which is the next count available from the March 2020 low).
We should also keep in mind that the next 7-year cycle is due to make its low in 2023 and that some time must be allotted for an important decline into that date. Therefore, it is not inconceivable that we could see a major market top make its appearance before long. The previous two 7-year lows were in 2016 and 2009.
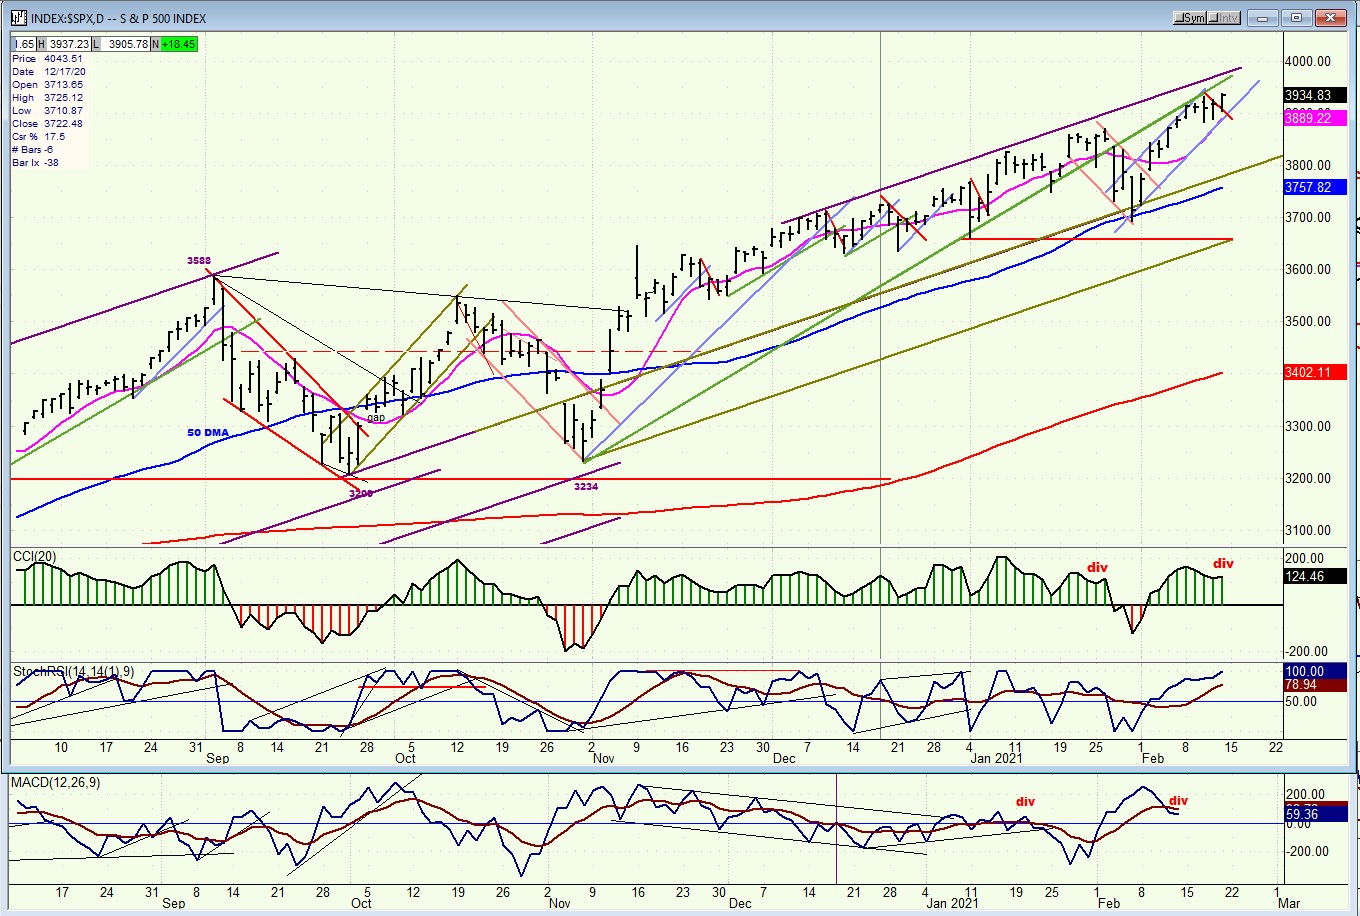
SPX hourly chart
In the daily chart segment, I mentioned that the current pattern was similar to that of the last short-term top. This is even more apparent on the hourly chart. SPX is also approaching the top of the channel which has characterized the trend since it made its first peak after the last intermediate low of 3234. On this chart, we see that it pulled back on two previous occasions after reaching the top channel line; but there were three previous times when the index was arrested by that channel line.
This consistent resistance at the channel top, combined with the daily divergence in the daily CCI, strongly suggests that we should expect another pull-back over the near-term. There is also divergence in the hourly A-Ds oscillator, but none yet in the momentum oscillators. This would suggest that SPX could still move a little higher before topping closer to the channel line resistance. This is consistent with the P&F chart which calls for a move to 3940-50 before reaching the maximum price target for this move.

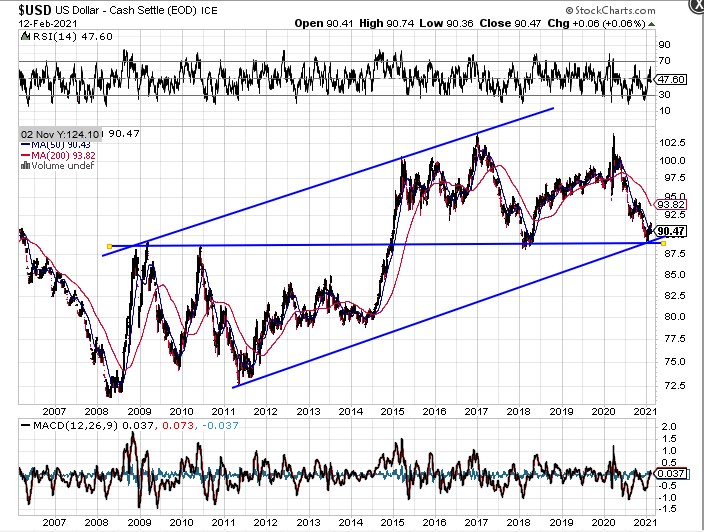
UUP (dollar ETF) WKLY ($USD chart is not available from this data provider)
The short-term trend of UUP is limited in what it reveals, but the long-term chart of the USD since 2007 (chart courtesy of StockCharts) is much more informative. A cursory analysis suggest that the dollar has reached a level of major support which could keep it in a trading range for weeks or months before the next trend direction is confirmed (which is probably lower). Note that the positive divergence in the MACD suggests that it may be some time before the dollar is ready to break out of its blue channel and continue its long-term decline.
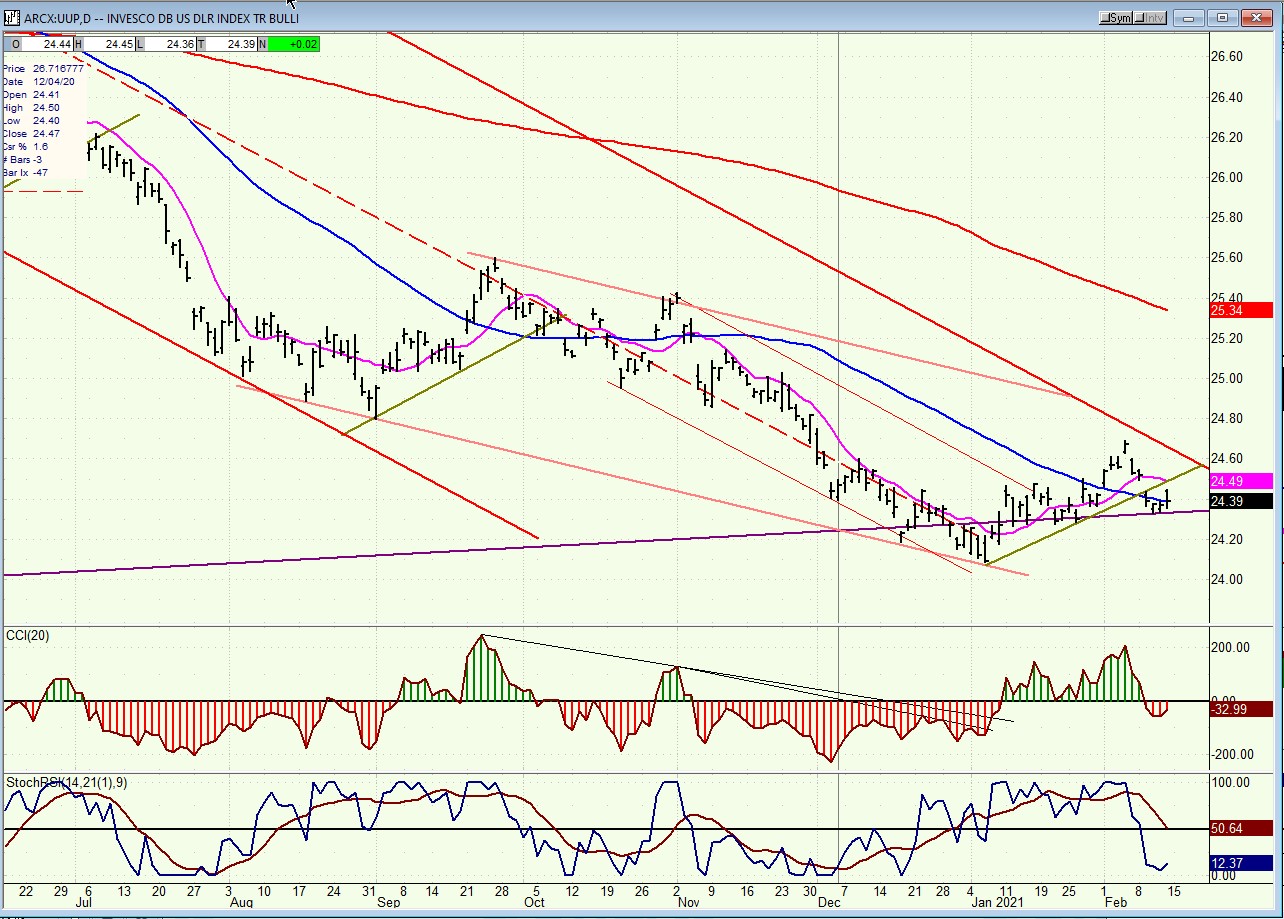
The daily chart of UUP shows that a deceleration trend since last September has given way to the beginning of a short-term holding pattern or recovery which can extend to the 200-dma of the index (25.34) if it can come out of its intermediate corrective channel (~24.50).
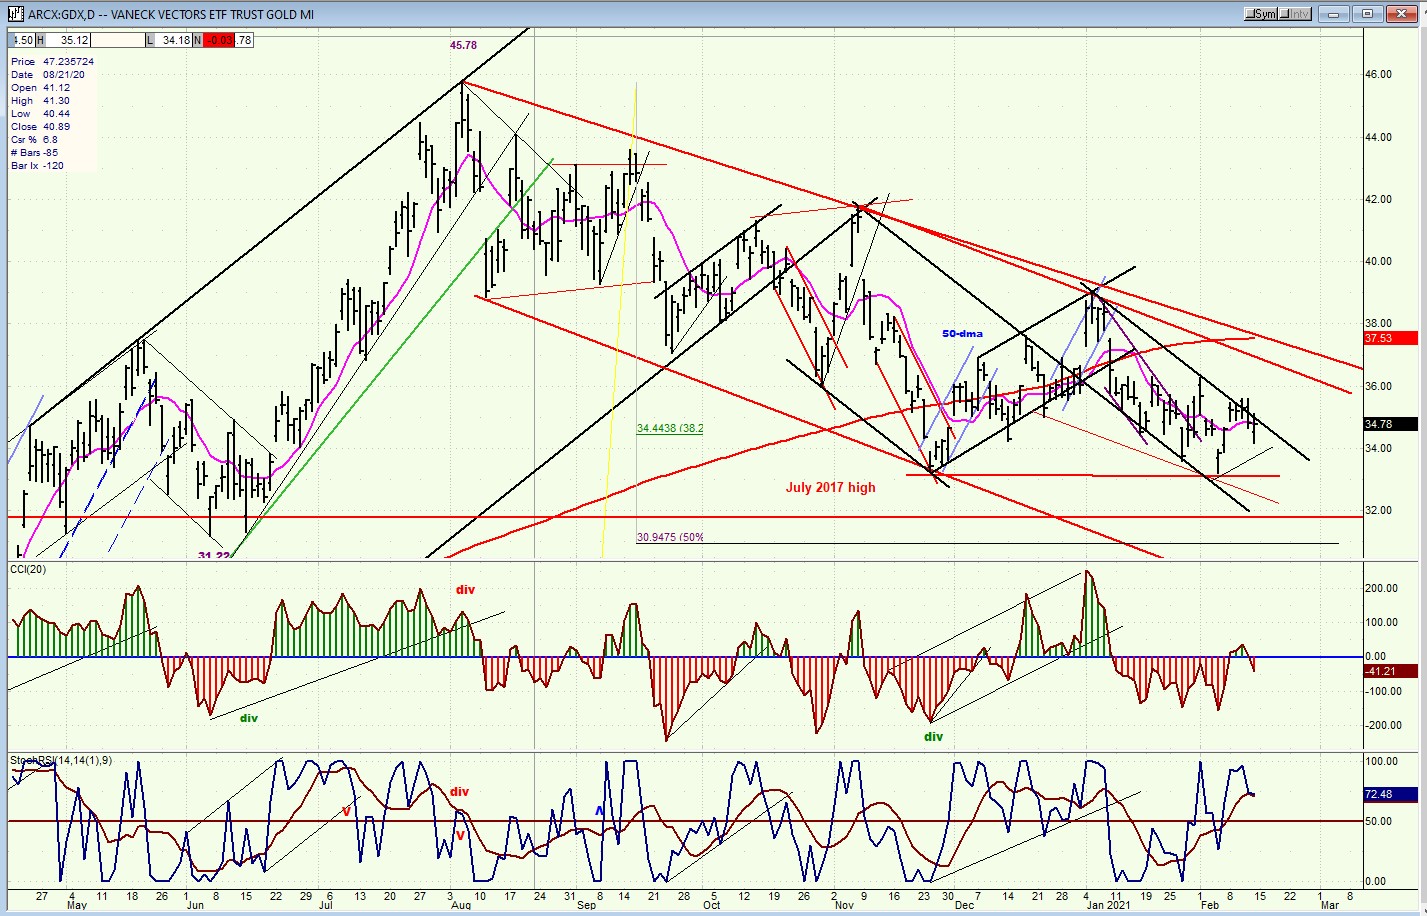
GDX (gold miners)-DLY
GDX is approaching the end of its correction pattern. This could come as early as next week and be followed by a quick 10-point move to its recent high of 45, a small consolidation, and then another move some10-points higher for a total projection to ~54.
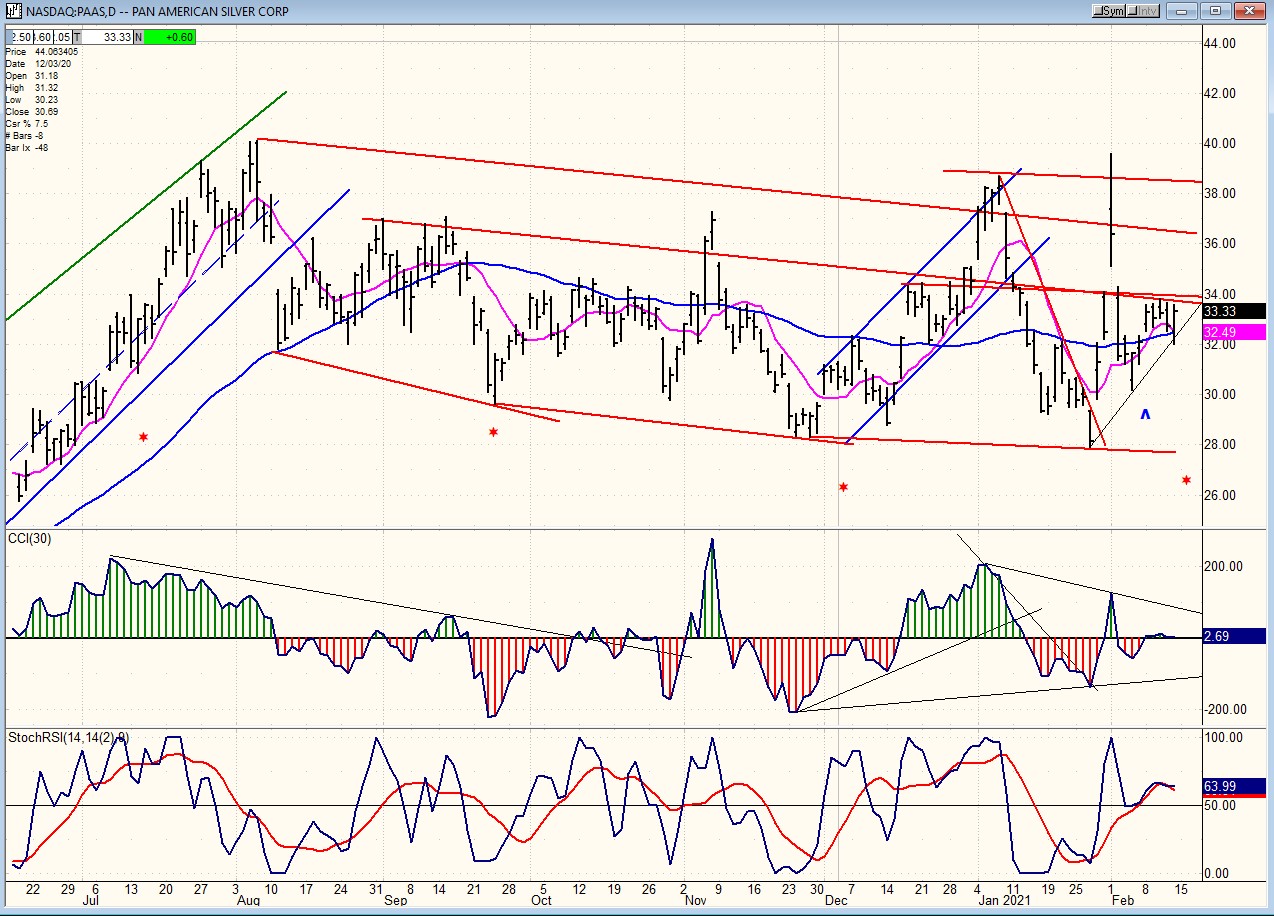
PAAS (Pan American Silver Corp-DLY)
Silver is leading gold, but both moves are closely related. Therefore, PAAS could also make its final correction low next week which would also be followed by a 10-point move to 42, a consolidation, and a move extension to ~50.
Both moves in GDX and PAAS are based on cycles for timing, and P&F charts for price projections; and both are intermediate in nature. Long-term, both gold and silver appear to have formed large bases since 2016 and have the potential for much higher price targets.
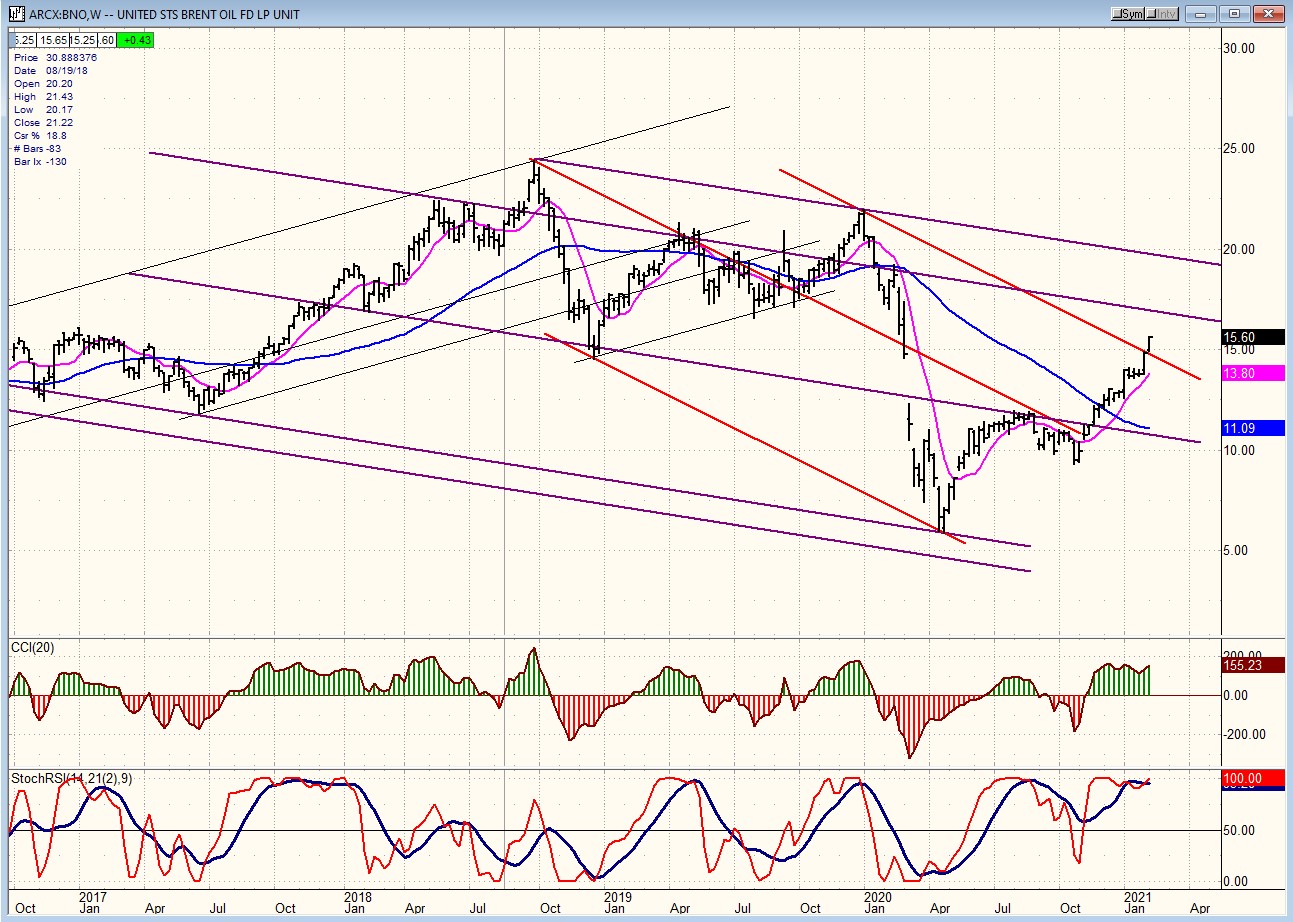
BNO (Brent oil fund) wkly.
BNO is moving out of its intermediate (red) channel to reach its ~16 projection, after which it should consolidate before moving on to a 17-18 target which would coincide with the top of the longer- term channel.
SUMMARY
It is highly probable that after completing another short-term pull-back, SPX will head for its intermediate projection of ~4150, after which it will be positioned to have the largest and longest correction since the beginning of its last intermediate uptrend (10/30/’20)
Free trial subscription
With a trial subscription, you will have access to the same information that is given to paid subscribers, but for a limited time-period. Over the years, I have developed an expertise in P&F charting (price projection), cycles (timing), EWT (structure), and general technical analysis which enables me to warn subscribers of pending reversals in market trends and how far that trend can potentially carry. For a FREE 2-week trial, subscription options and payment plans, I encourage you to visit my website at www.marketurningpoints.com.
The above comments and those made in the daily updates and the Market Summary about the financial markets are based purely on what I consider to be sound technical analysis principles. They represent my own opinion and are not meant to be construed as trading or investment advice but are offered as an analytical point of view which might be of interest to those who follow stock market cycles and technical analysis.
********

When Andre Gratian was a stock broker years ago, a friend introduced him to technical analysis of the market. Consequently, it is not an exaggeration to say that Andre fell in love with this approach! Ever since then, it has become an increasingly important part of his professional life. Gratian has studied the works of Wyckoff, Edwards & Magee, Edward J. Dewey (cycles) and many others. However, one of my most profitable undertaking has probably been to study Point & Figure charting, which he finds invaluable in analyzing stocks and indices. If he were restricted to one methodology, this is the one that he would choose. This well-rounded background has given him what he feels to be a special insight into the stock market, facilitating the recognition of meaningful patterns and the ‘turning points’ in all trends, whether they be short or long term. Andre feels very comfortable discussing the stock market and passing on meaningful information to others. His subscribers include individuals and money managers throughout the world. Moreover, his Newsletters are currently published on several financial sites, here and abroad.


