Technical Analysis Of The Markets


Current Position of the Market
SPX Long-term trend: There is some evidence that we are still in the bull market which started in 2009 and which could continue into the first half of 2021 before coming to an end.
SPX Intermediate trend: SPX is not likely to end its intermediate trend until it reaches about 4150.
Analysis of the short-term trend is done daily with the help of hourly charts. They are important adjuncts to the analysis of daily and weekly charts which determine longer market trends.
It is Time for Investor Caution
Cycles: Looking ahead!
90-yr cycle – Last lows: 1843-1933. Next low: ~2023
40-yr cycle -- Last lows: 1942 -1982. Next low: ~2022
7-yr cycle – Last lows: 2009-2016. Next low: ~2023
Market Analysis (Charts, courtesy of QCharts
SPX (weekly)
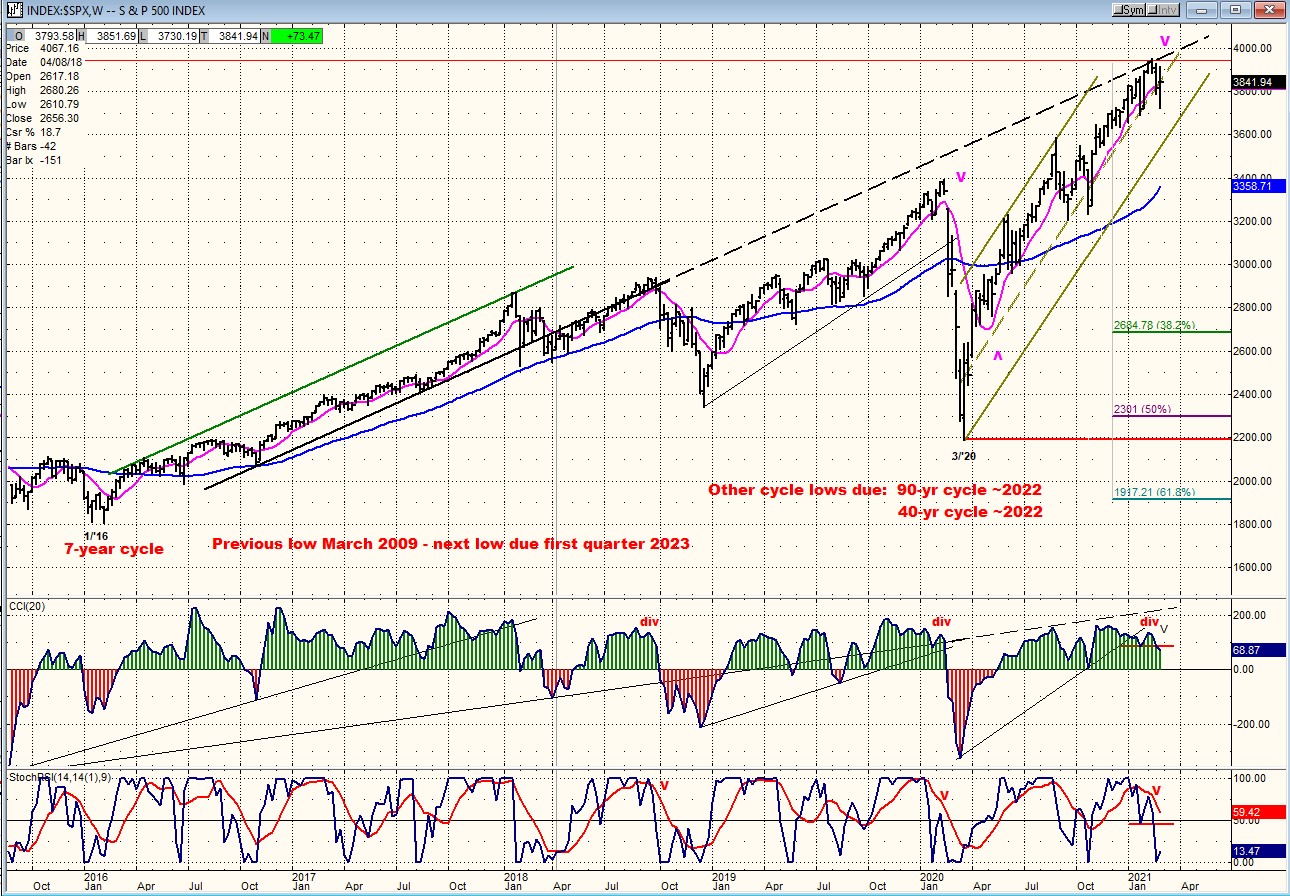
Below, I have posted a weekly chart of SPX starting from the previous 7-yr cycle low of early 2016. Other major cycles lows which lie directly ahead and can affect the market adversely are also mentioned. The source of information for this data is deemed to be reliable.
The oscillators at the bottom of the chart suggest that the index is making an important topping formation. If you compare the current pattern of the CCI to the one it made in 2020, you will notice an uncanny similarity. This goes for the SRSI as well. The latter has already given a sell signal and the CCI, which normally lags, is getting ready to do the same.
If the 2020 market action is a preview of what is about to take place in the near future, a steep price retracement lies directly ahead; except that because of the cycles involved, it could be just as sharp but more prolonged. It is a fact that a cycle which causes a market correction at the very end of its phase brings about a swift and sharp decline in prices. We are currently faced with the probability that not one, but three major cycles are positioned to enact this scenario.
Since the market top could take another few weeks to complete, a P&F projection for the extent of the decline which lies ahead is not yet available. However, since we are probably ending a 12-year bull market, we can assess the downside risk with standard Fibonacci retracements of the entire span from the March 2009 low. These price levels are provided on the chart.
It is not ever possible to know for certain what lies ahead, but we should heed warning signs which are clear and obvious that a major correction of the stock market is about to occur and be aware that the extent of the decline may be even greater than that foreseen by the deepest Fibonacci retracement level indicated on the chart. Many top analysts are issuing similar warnings and one of the most well-known, Robert Prechter, who was recently interviewed on Kitco, presented an analysis based on cycles, Fibonacci, and Elliott Wave which was extremely bearish.
NDX (weekly)
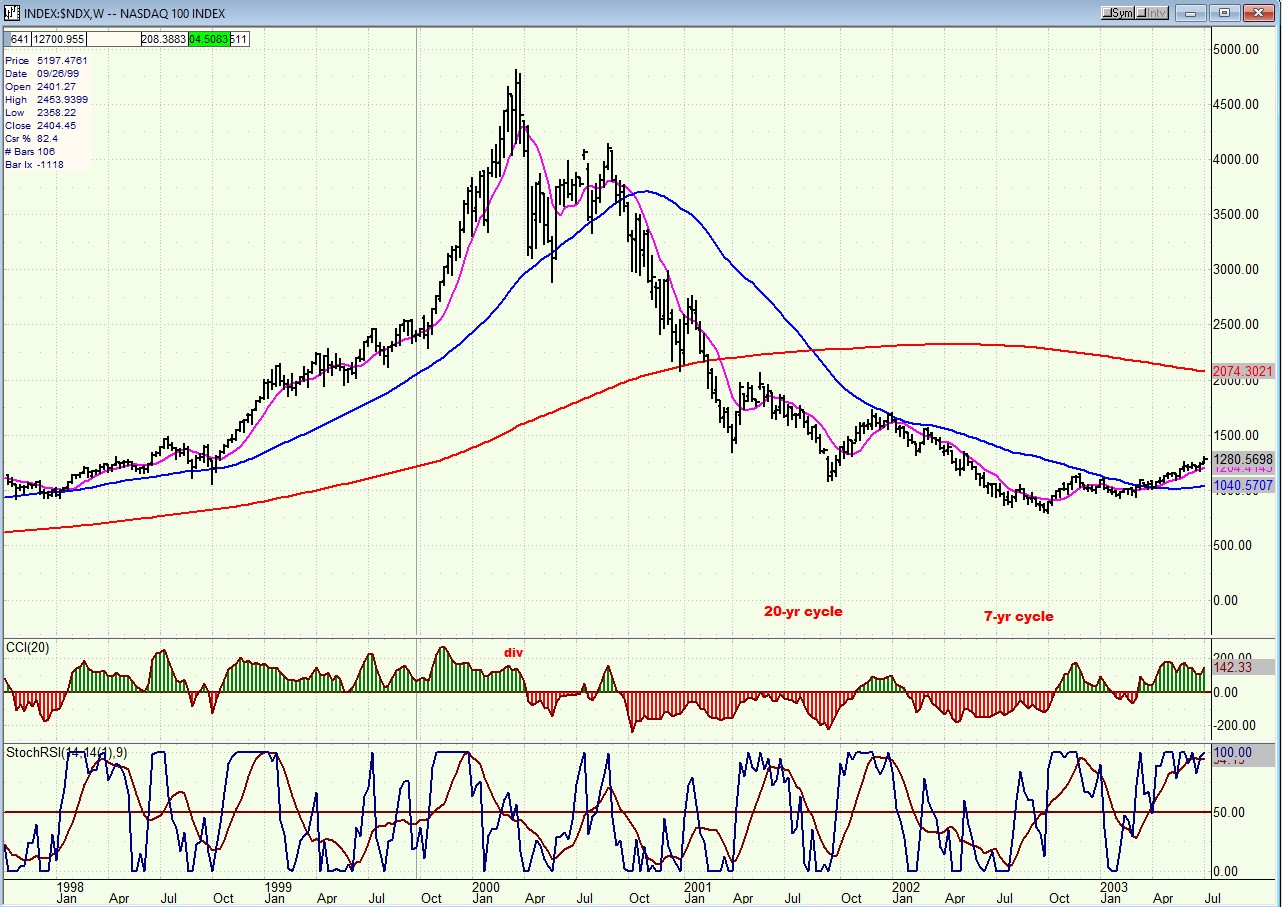
There is a precedent for what could happen over the next few months. I have posted below a weekly chart of the NDX which ranges from 1988 and 2003 that shows a correction which was engineered by essentially the same the 7-yr cycle and the 20-yr cycle, which is the half-span of the 40-yr cycle which is about to make its low. The 90-year cycle was not even a consideration at that time. Obviously, this is no proof that history will repeat itself, but it does show that there are historic precedents for the kind of correction that could lie ahead.
Note that currently, NDX may already have started its correction and that SPX may simply be waiting for DJIA to get in gear.
SPX daily chart
The CCI has a reliable history of predicting correction in any time frame. Negative divergence appeared in this indicator three weeks ago, and SPX has been in a short-term correction ever since; and it has not yet signaled that the correction is over. Nor has the SRSI. As stated in last week’s letter, the P&F chart called for a top of 3950, and then a drop to 3780 which, if exceeded, could continue down to 3700 (and perhaps even a little lower). On Thursday, the index printed 3723 and rallied after finding support at a level where several trend lines intersected. On Friday, that low was retested with another pullback to 3730, and followed by a strong rebound to 3850. Since the oscillators have not yet given a buy signal, it is possible that more backing and filling will take place before the start of another uptrend. It is also possible that the low of this correction is still ahead of us.
I have previously suggested that we could find an intermediate high at about 4150-4220. I believe that this is possible since the weekly chart indicators have not yet given a confirmed sell signal but only a warning. We do not know precisely when the final rally will take place but, because of the condition of the weekly oscillators, we should from here-on potentially treat every new high as the last one of the bull-market – and wait for the market action to tell us that a major decline is beginning.

SPX hourly chart
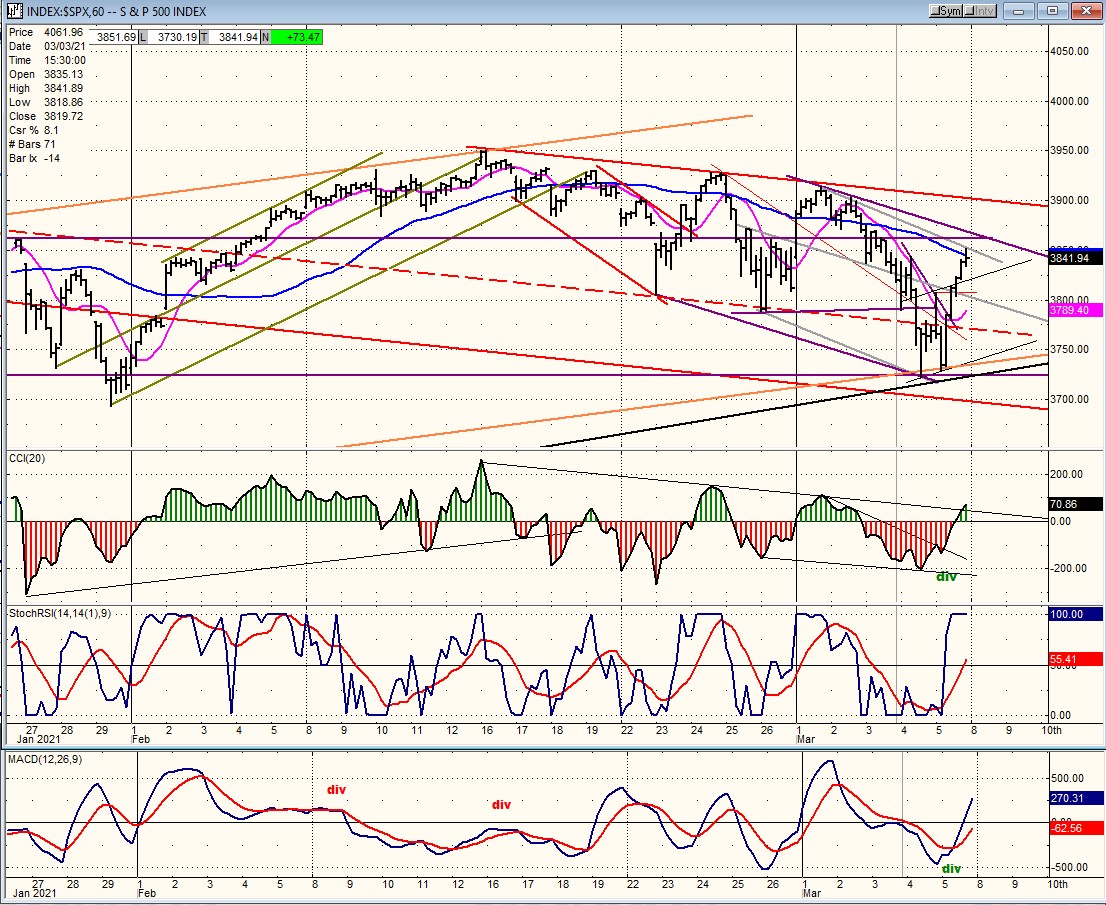
SPX is a hybrid between the DJIA and the NDX, but it can still be analyzed as an individual index. Both former indexes broke a prior short-term support level on Thursday, sending SPX careening to a new low. On Friday, DJIA held its former low but NDX exceeded it. It looks as if the NDX has become the weakest of the three and, if we are as close to a market high as it appears, it is possible that it has already topped, which could limit the ability of the SPX to reach the final levels that I had thought possible based on the P&F pattern of its March low -- which could have been as high as 4400 to 4600. We will have to see how this plays out over the next few weeks, but considering the warning already given by the weekly indicators, it is doubtful that these levels can be reached.
For now, the hourly chart shows that Friday’s strong rally caused all three oscillators to turn positive, but the index stopped near the top of the steepest corrective channel line as well as at its 50-hr MA. We will have to see if it can overcome that resistance and move higher on Monday, or if it first needs to pull back. In any case, it will still need to rise above the red downtrend line before it comes out of its corrective channel and confirm that it is on its way to making a new all-time high.
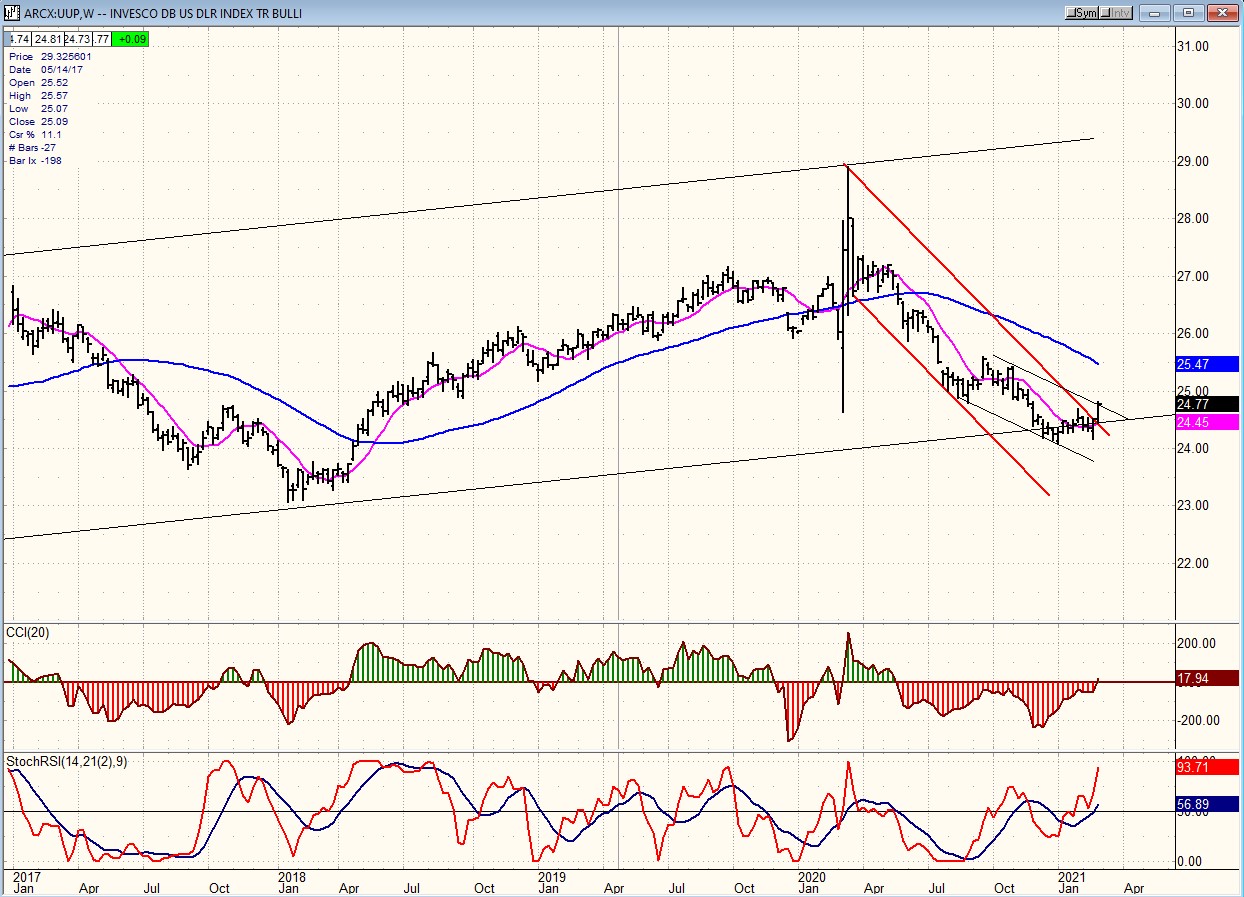
UUP (dollar ETF) WKLY ($USD chart is not available from this data provider)
UUP held the long-term bottom channel line and is now pushing higher after moving out of its larger corrective channel and trying to push beyond the confine of the smaller channel. The SRSI has already given a buy signal and the CCI is about to go positive, so it could be heading for the weekly 50-MA -- which is comparable to the 200dma -- before it finds resistance.
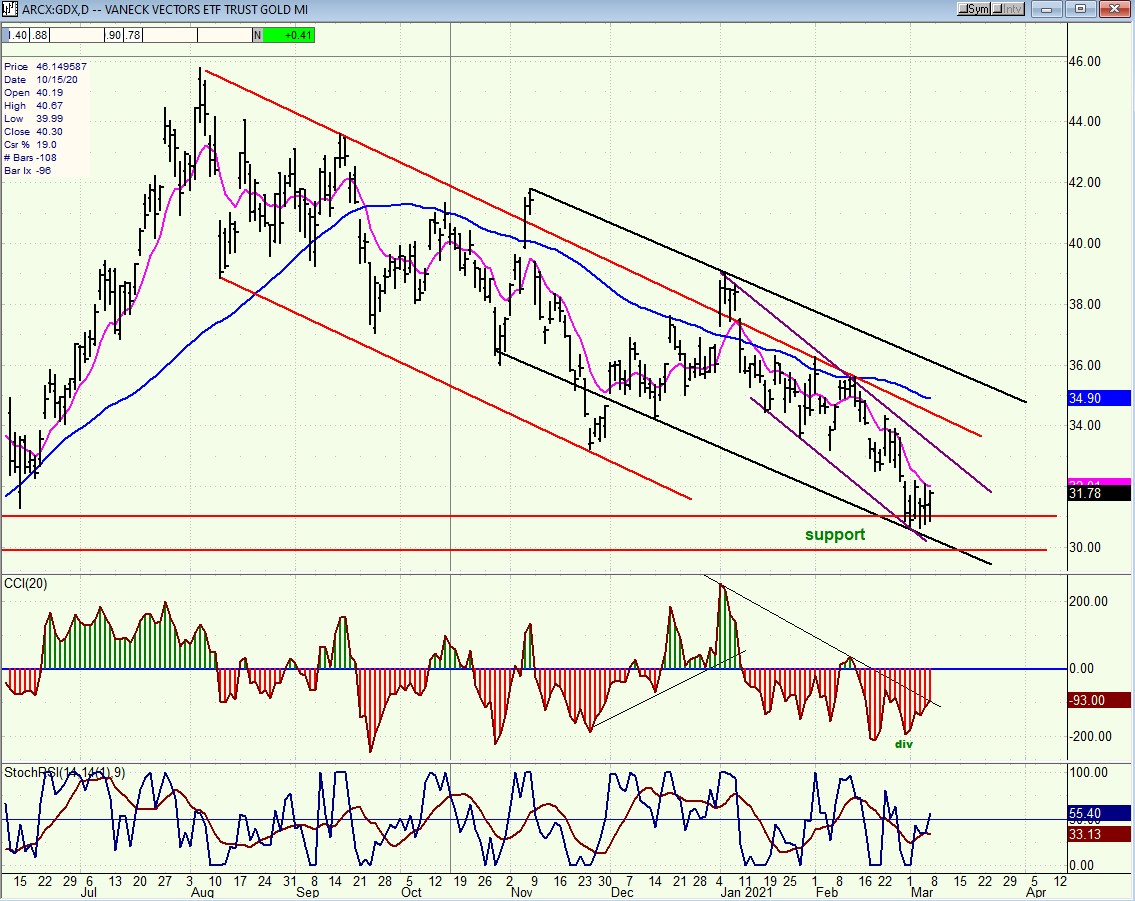
GDX (gold miners)-DLY
GDX may be near the end of a lengthy consolidation. It is sitting on top of a strong support level which it has failed to breach for over a week. This has caused the oscillators to improve with the SRSI becoming slightly positive on Friday. It should also be noted that the correction has now retraced 50% of the uptrend from the March low. All these factors combined suggest that a reversal is imminent. The first hurdle will be getting above the 9-dma, then out of the smaller, steeper down-channel. An indication that it wants to resume its long-term uptrend will be when it can rise above the blue 50-dma, and finally above the black channel line.
SUMMARY
It is time to pay attention to the longer-term indicators, which are flashing a warning that we may be coming to the end of the bull market. This is substantiated by the high probability that long-term cycle lows lie directly ahead. The market itself will have to alert us to the beginning of a severe correction. This could still be several weeks away.
*********

When Andre Gratian was a stock broker years ago, a friend introduced him to technical analysis of the market. Consequently, it is not an exaggeration to say that Andre fell in love with this approach! Ever since then, it has become an increasingly important part of his professional life. Gratian has studied the works of Wyckoff, Edwards & Magee, Edward J. Dewey (cycles) and many others. However, one of my most profitable undertaking has probably been to study Point & Figure charting, which he finds invaluable in analyzing stocks and indices. If he were restricted to one methodology, this is the one that he would choose. This well-rounded background has given him what he feels to be a special insight into the stock market, facilitating the recognition of meaningful patterns and the ‘turning points’ in all trends, whether they be short or long term. Andre feels very comfortable discussing the stock market and passing on meaningful information to others. His subscribers include individuals and money managers throughout the world. Moreover, his Newsletters are currently published on several financial sites, here and abroad.


