Technical Analysis Of The Markets


Current Position of the Market
SPX Long-term trend: There is some evidence that we are still in the bull market which started in 2009 and which could continue into the first half of 2021 before major cycles take over and it comes to an end.
SPX Intermediate trend: SPX has completed the next phase of its intermediate uptrend and should correct.
Analysis of the short-term trend is done daily with the help of hourly charts. They are important adjuncts to the analysis of daily and weekly charts which determine longer market trends.
SPX Indicators Flashing Caution
Cycles: Looking ahead!
90-yr cycle – Last lows: 1843-1933. Next low: ~2023
40-yr cycle -- Last lows: 1942 -1982. Next low: ~2022
7-yr cycle – Last lows: 2009-2016. Next low: ~2023
Market Analysis (Charts, courtesy of QCharts)
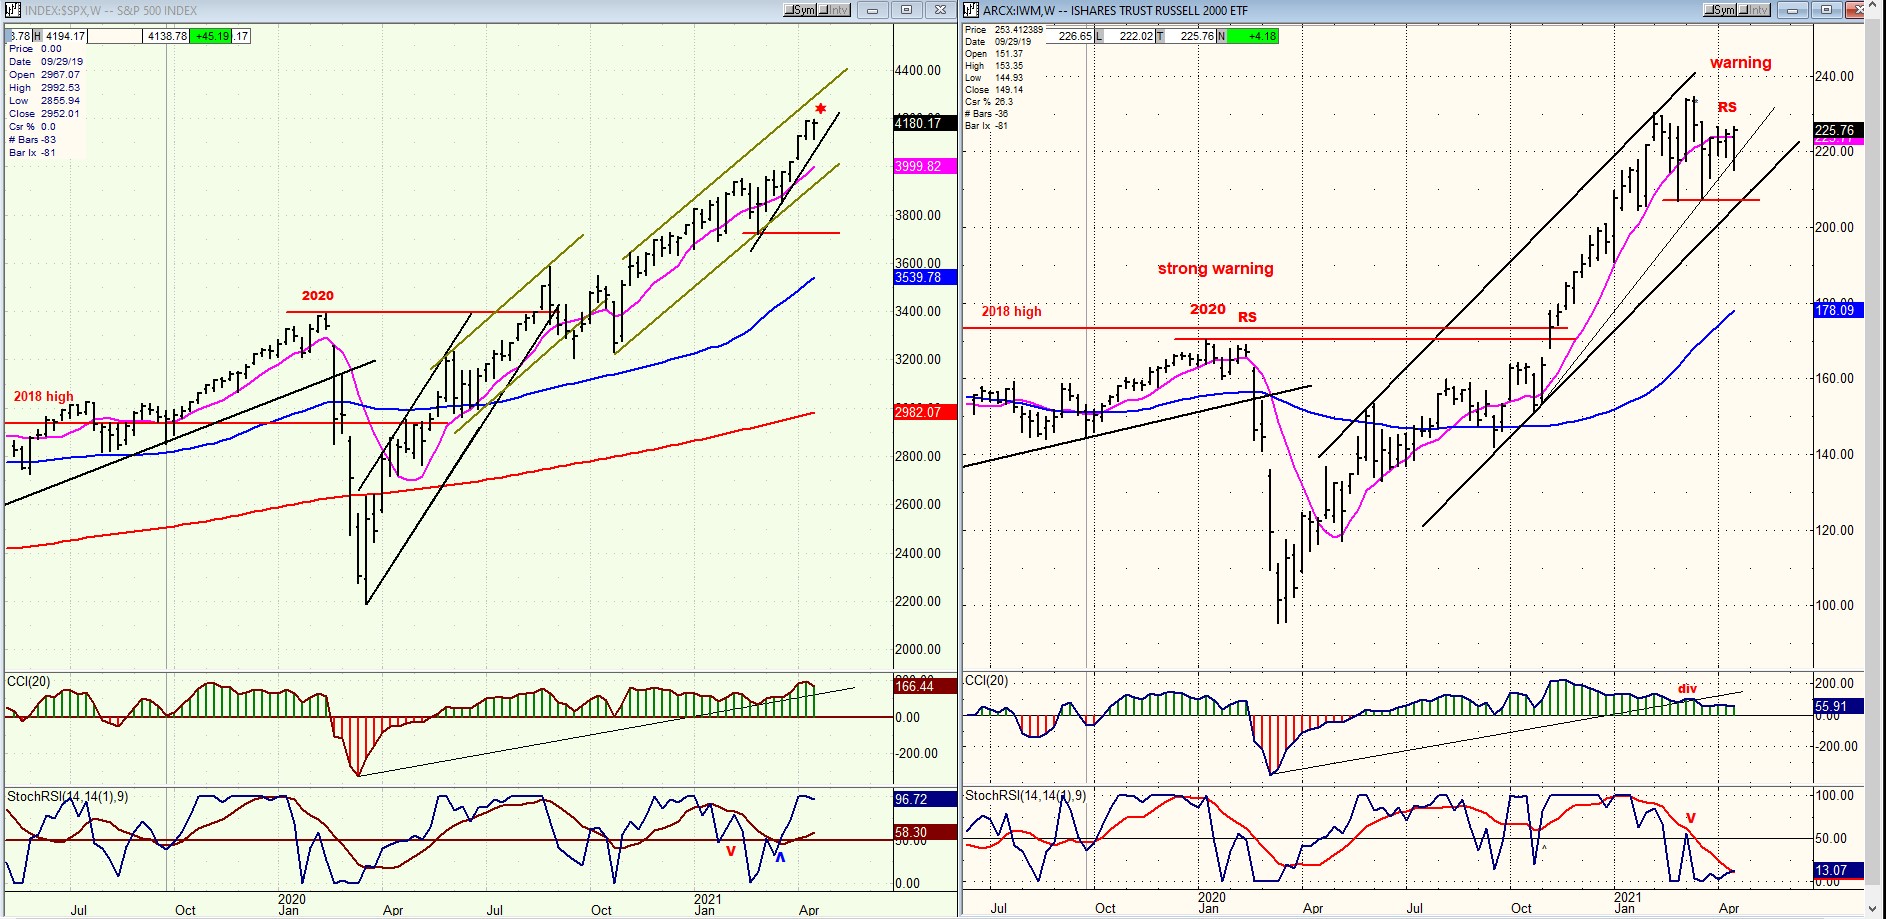
IWM vs SPX (weekly)
IWM continues to flash a warning by showing significant divergence from SPX. Since it has an excellent track record of alerting us to a reversal in the latter, that warning should not be ignored.
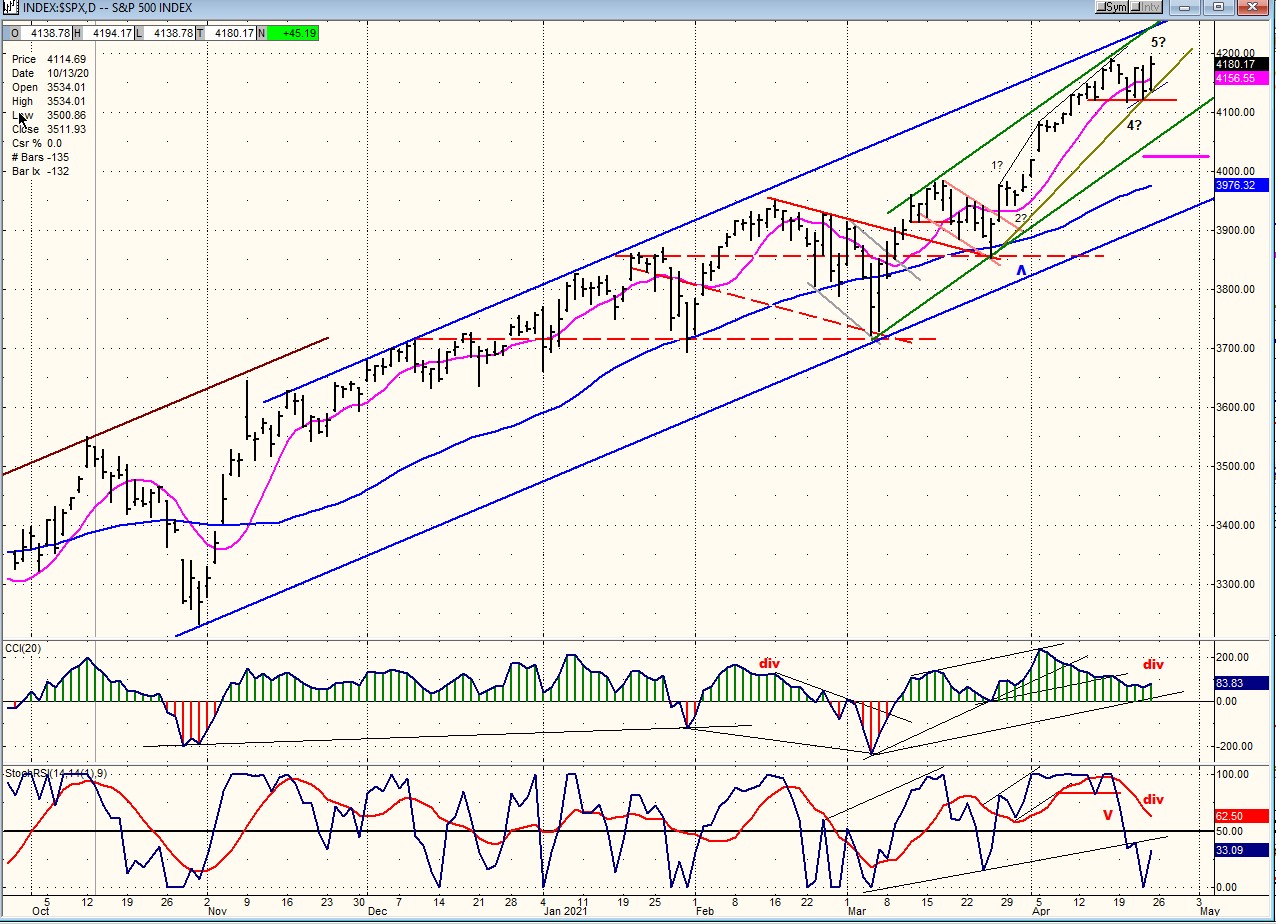
SPX daily chart
Last week, I posted the multiple warning signs that SPX was coming into at least a short-term top. I have updated them after last week’s market action.
1 – To begin with, the P&F congestion formed at the 3950 level gave us a count of 4180-4200. Last Friday, SPX reached 4191 and pulled back to 4118 during the week but made a fractional new high on Friday. It could still go a little higher, perhaps 4110-4220.
2 – From 3723, SPX has created a (green) channel the top of which corresponds to the price achieved by the index last Friday. There is a larger (blue) channel drawn across the two lows of the intermediate uptrend with a parallel across the tops. The top of the green channel has already provided resistance to the advance, but this week’s retracement has opened-up a little more room on the upside for a potential 5th wave.
3 – The CCI increased its negative divergence this week, and the SRSI has already given a sell signal.
4 – IWM is showing relative weakness to SPX -- a pattern which normally takes place just before a reversal in the latter.
The above listed conditions provide a strong warning that SPX is coming to the end of the move which started from 3853.
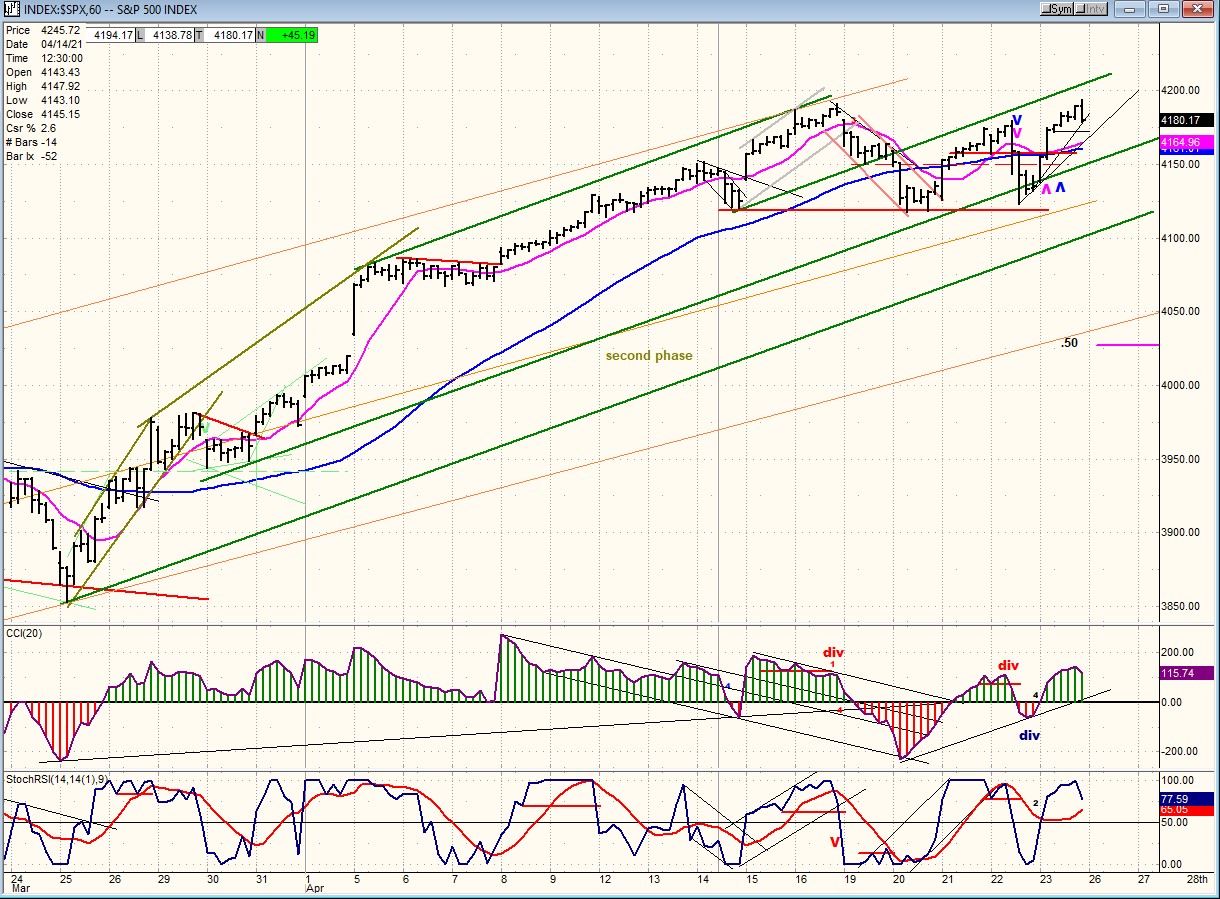
SPX hourly chart
Last week clarified the current structure of SPX with the former short-term high as probably wave 3 of the move from 3853, and the retracement to the red support line and green parallel as wave 4, with the index probably now engaged in the 5th and last wave of the short-term uptrend.
The warning signs of an approaching top listed above also suggest that we are now near the end of the entire second phase which started at 3853.
The hourly oscillators are still bullish, which tells us that the uptrend could still has a little more upside potential.
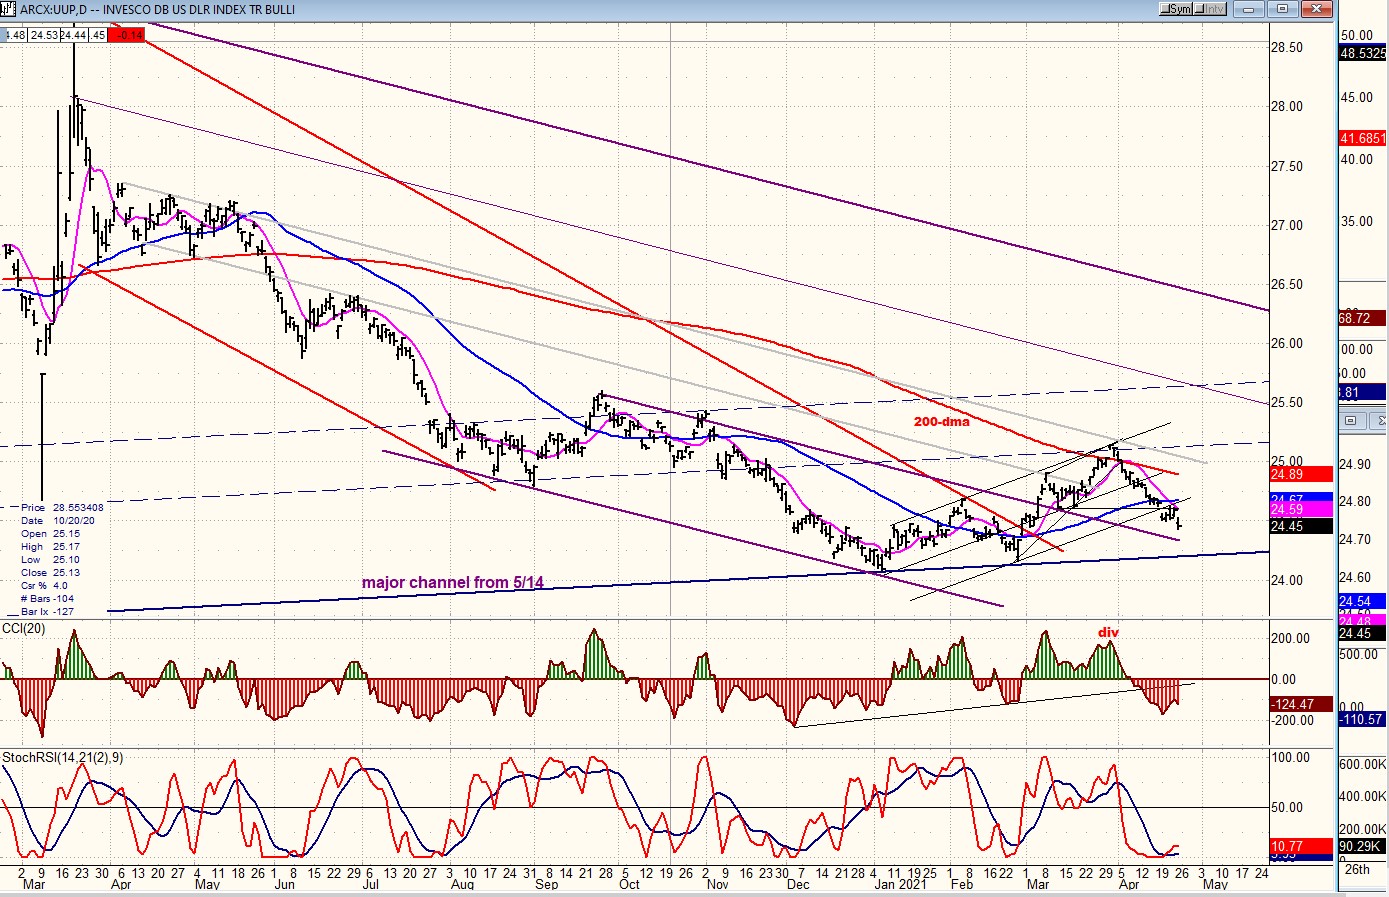
UUP (dollar ETF) DLY ($USD chart is not available from this data provider)
UUP has been in a short-term downtrend, but indicators suggest that it could soon reverse -- although a strong uptrend is not anticipated.
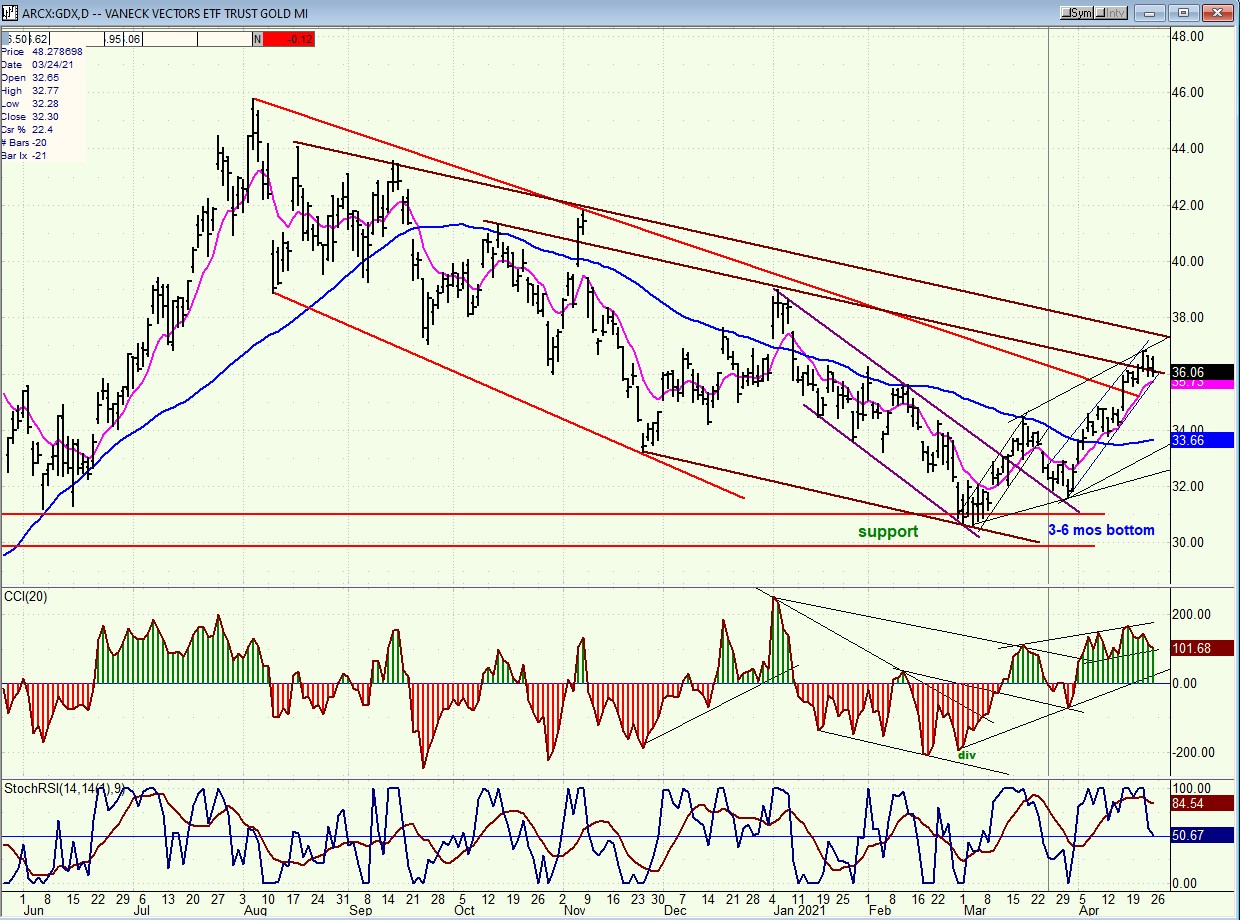
GDX (gold miners)-DLY
GDX may be ready for a pull-back. Since it has a clear three-wave uptrend pattern, this could be wave 4 to be followed by another small wave 5 before a larger consolidation.
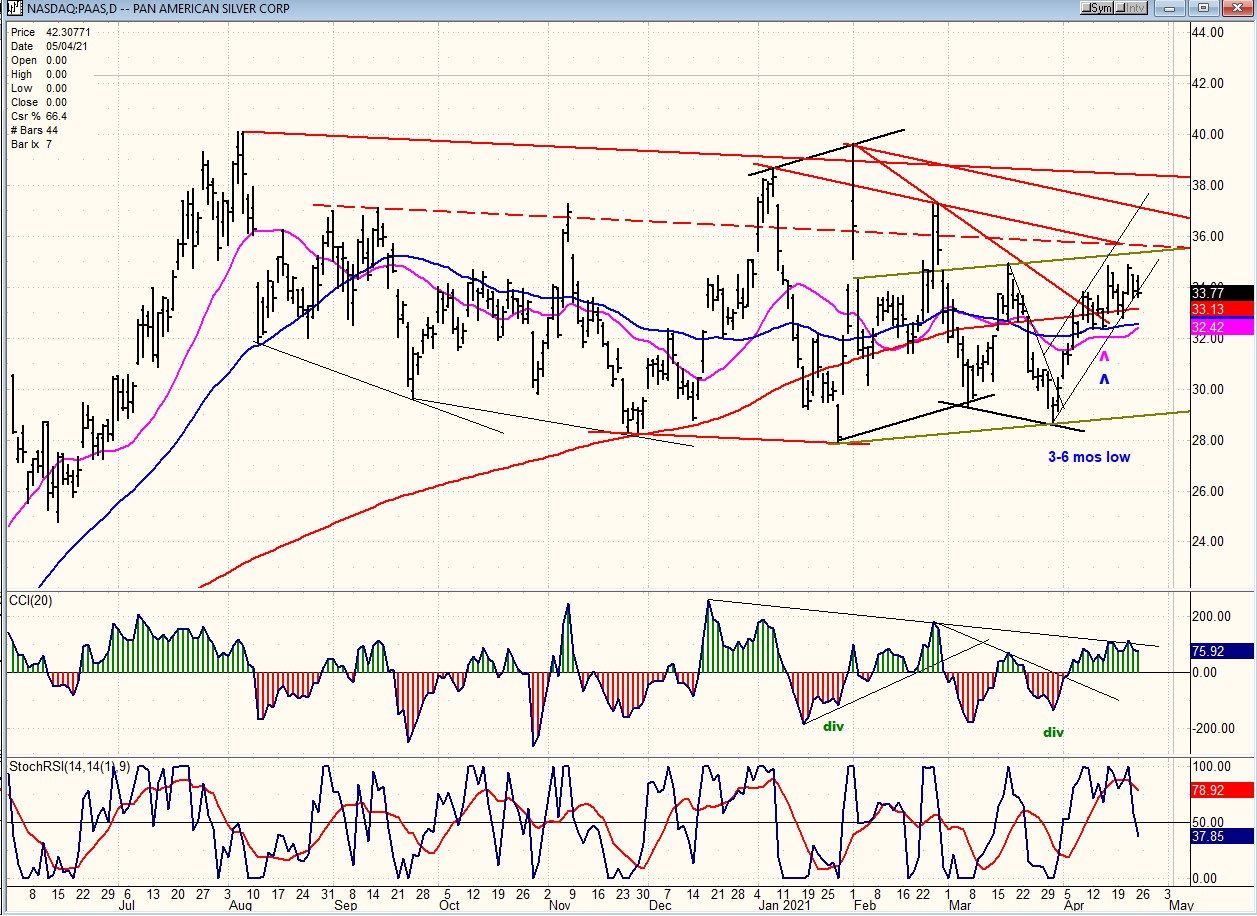
PAAS (Pan American Silver Corp-DLY)
The short-term structure of PAAS is a little different than GDX, but not substantially, and it too is expected to see a minor pull-back before another push higher.
BNO (Brent oil fund) DLY.
BNO is in a short-term consolidation pattern which looks only about part-way complete.

SUMMARY
Since SPX has now clarified its phase two structure as needing a slightly higher high before completing and reversing its trend from 3853, last week’s call for a top was obviously a little premature.
Free trial subscription
With a trial subscription, you will have access to the same information that is given to paid subscribers, but for a limited time-period. Over the years, I have developed an expertise in P&F charting (price projection), cycles (timing), EWT (structure), and general technical analysis which enables me to warn subscribers of pending reversals in market trends, and how far that trend can potentially carry. For a FREE 2-week trial, subscription options, and payment plans I encourage you to visit my website at www.marketurningpoints.com.
The above comments and those made in the daily updates and the Market Summary about the financial markets are based purely on what I consider to be sound technical analysis principles. They represent my own opinion and are not meant to be construed as trading or investment advice but are offered as an analytical point of view which might be of interest to those who follow stock market cycles and technical analysis.
********

When Andre Gratian was a stock broker years ago, a friend introduced him to technical analysis of the market. Consequently, it is not an exaggeration to say that Andre fell in love with this approach! Ever since then, it has become an increasingly important part of his professional life. Gratian has studied the works of Wyckoff, Edwards & Magee, Edward J. Dewey (cycles) and many others. However, one of my most profitable undertaking has probably been to study Point & Figure charting, which he finds invaluable in analyzing stocks and indices. If he were restricted to one methodology, this is the one that he would choose. This well-rounded background has given him what he feels to be a special insight into the stock market, facilitating the recognition of meaningful patterns and the ‘turning points’ in all trends, whether they be short or long term. Andre feels very comfortable discussing the stock market and passing on meaningful information to others. His subscribers include individuals and money managers throughout the world. Moreover, his Newsletters are currently published on several financial sites, here and abroad.


