Technical Analysis Of The Markets


"By the Law of Periodical Repetition, everything which has happened once must happen again, and again, and again -- and not capriciously, but at regular periods, and each thing in its own period, not another's, and each obeying its own law... The same Nature which delights in periodical repetition in the sky is the Nature which orders the affairs of the earth. Let us not underrate the value of that hint." ~ Mark Twain
Current Position of the Market
SPX Long-term trend: There is some evidence that we are still in the bull market which started in 2009 and which could continue into the first half of 2021 before major cycles take over and it comes to an end.
SPX Intermediate trend: Phase two from 3853 does not look complete.
Analysis of the short-term trend is done daily with the help of hourly charts. They are important adjuncts to the analysis of daily and weekly charts which determine longer market trends.
Extending Phase Two?
Cycles: Looking ahead!
90-yr cycle – Last lows: 1843-1933. Next low: ~2023
40-yr cycle -- Last lows: 1942 -1982. Next low: ~2022
7-yr cycle – Last lows: 2009-2016. Next low: ~2023
Market Analysis (Charts, courtesy of QCharts)
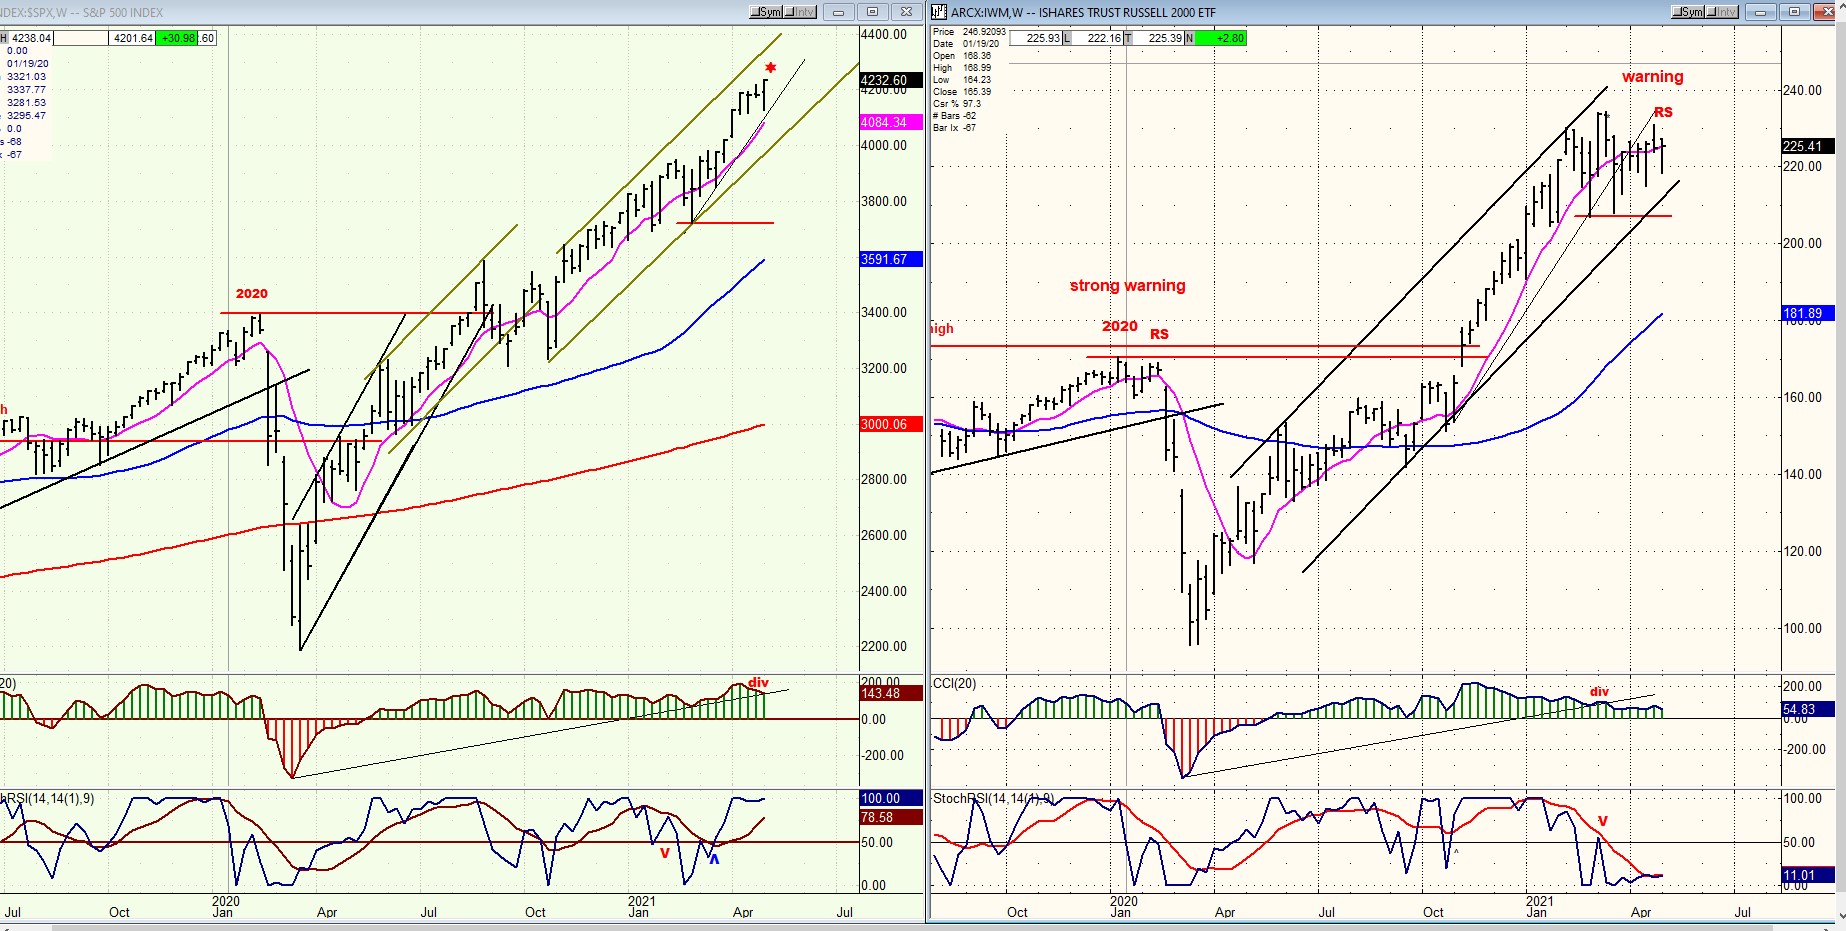
IWM - SPX (weekly)
SPX made a new all-time high today! IWM made a new all-time high eight weeks ago! We know what this disparity has suggested in the past: a market correction is coming. There is no reason to believe that it will be any different, this time. Unless, of course, IWM loses its relative weakness and starts to make new highs.
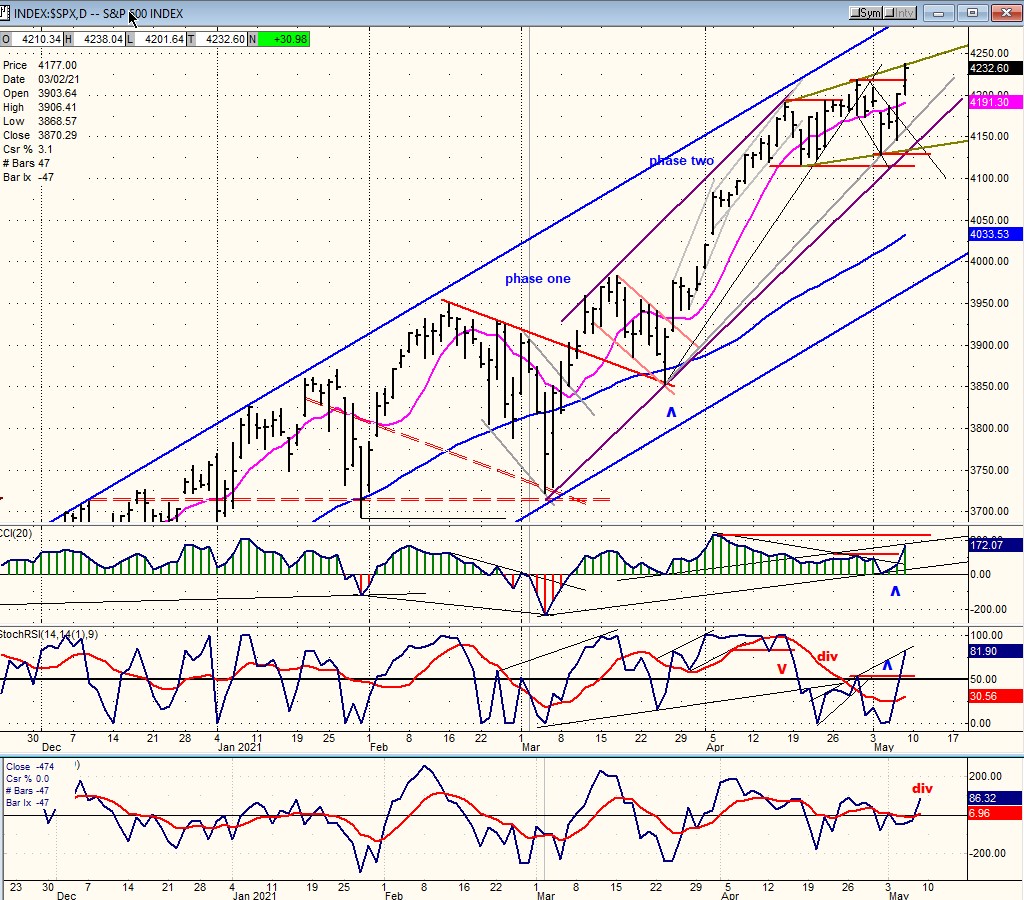
SPX daily chart
SPX is being pulled in different directions by the Nasdaq which is correcting and the DJIA which is making daily all-time highs. As a result, the intention of this index has become unclear. After rising from the 3853 low, it made two consecutive short-term tops: one from 4191 on 4/16 which brought about a 73-point correction, and another from 4219 on 4/29 which resulted in a 100-point pullback and ended on 5/04. Since then, SPX has already made a new all-time high and appears to have started a new uptrend which could prolong phase two -- but perhaps not by much.
First, the relative weakness exhibited by IWM suggests that a deeper correction should soon be taking place. Second, the P&F pattern is more suggestive of a top than of a base. And third, a dependable short-term cycle is scheduled to bottom around the 17th. That cycle is also obvious on the DJIA which should be in the process of topping any day, now. This would fit with the current SPX structure which may require another day or two to complete.
Making a short-term top is still the preferred scenario with a potential 4240-4260 target max. What happens next will depend on how much weakness will be triggered by the short-term cycle and if the correction can extend outside of the purple channel and below the 4120 level.
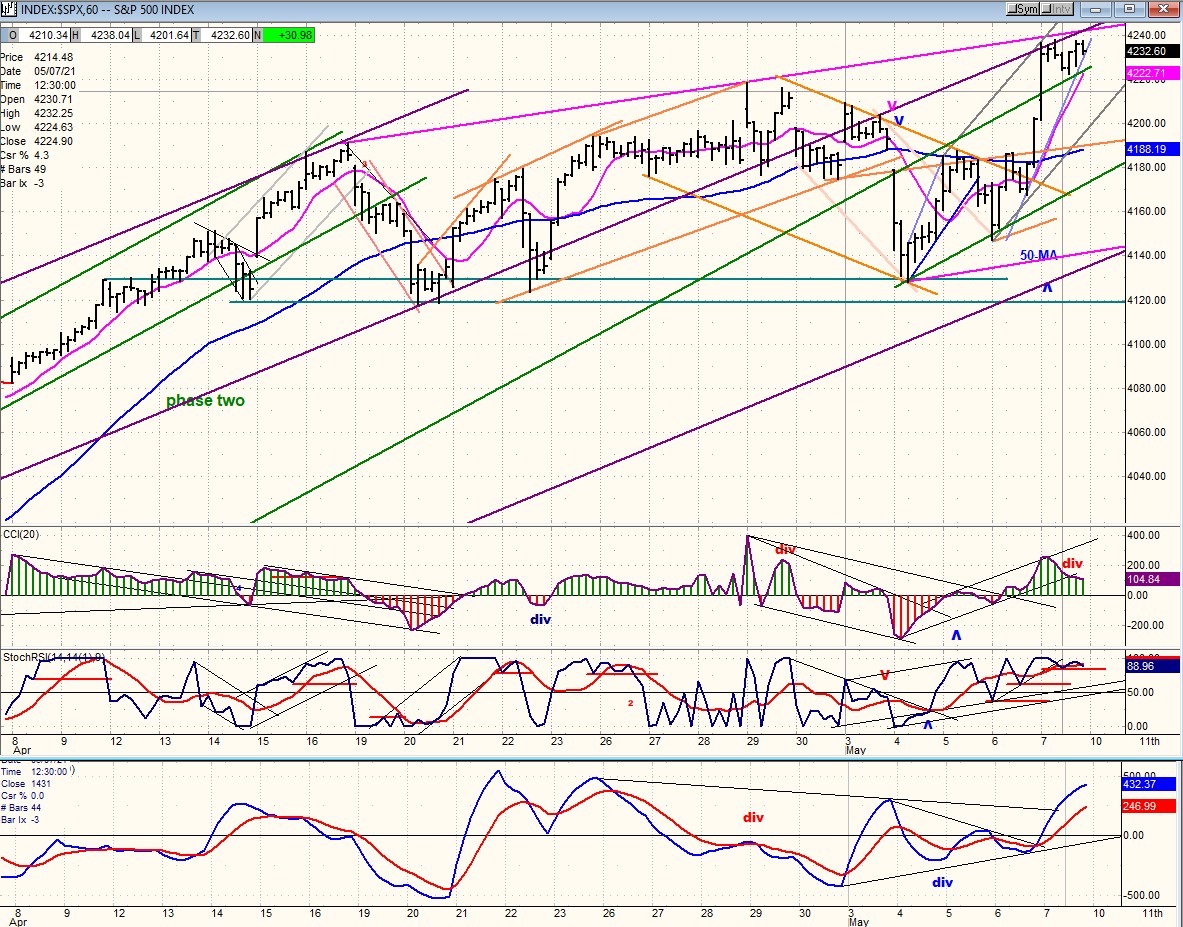
SPX hourly chart
The hourly chart does not add much to the analysis of the daily chart, except perhaps to show more clearly that the move which started on the 4th has a structure which is incomplete, and which should take SPX a little higher before completion. The index will have to move outside of the purple uptrend line and below the 4120 level to give a sell signal suggesting that phase two is now complete. It would be best if price remained below the pink upper trend line as it makes its short-term high.
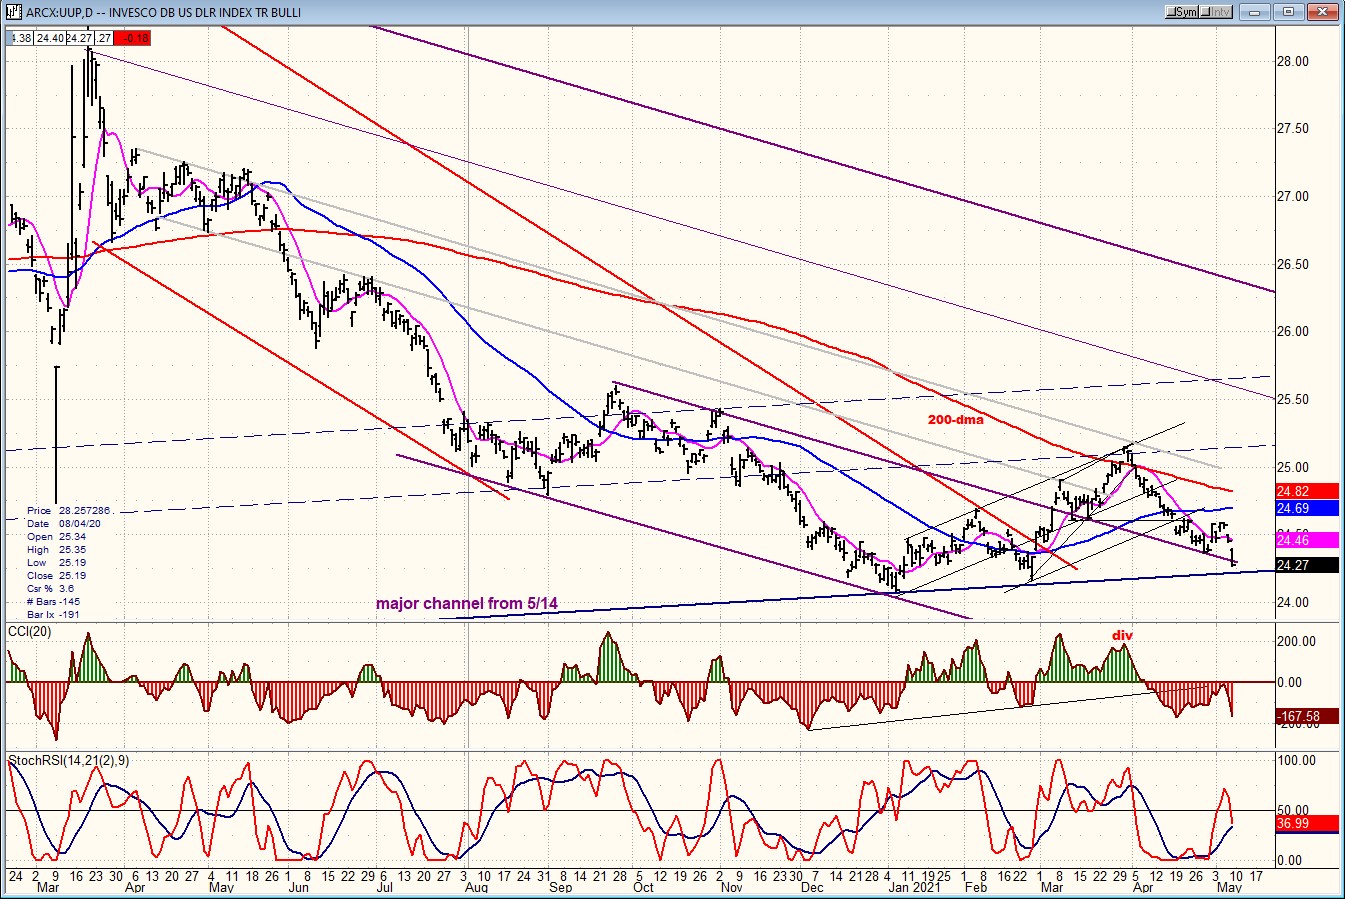
UUP (dollar ETF) DLY ($USD chart is not available from this data provider)
UUP barely bounced before dropping lower, almost reaching the lower trend line of the main channel from 5/14 where it found support twice before. Looking at the longer- term chart, it looks like a retest of the 2018 low above which it should hold for some time.
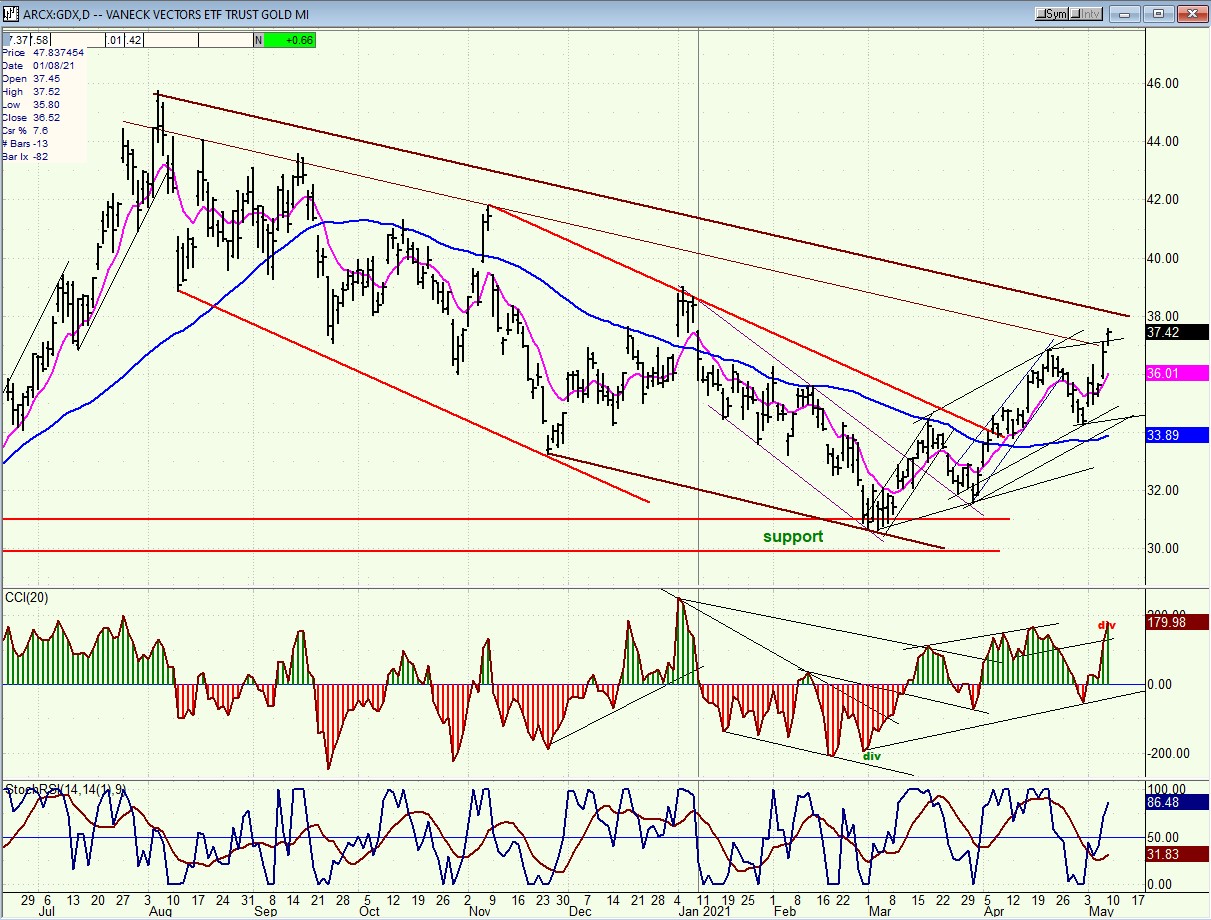
GDX (gold miners)-DLY
GDX is still pushing higher after making what appears to have been an intermediate-term low. Another .60 would put it against the top of its corrective channel where some temporary resistance may be found before it can push to the 39-40 level suggested by the P&F chart. The negative divergence showing in the CCI does not look serious and could easily be dispelled by a continued advance.
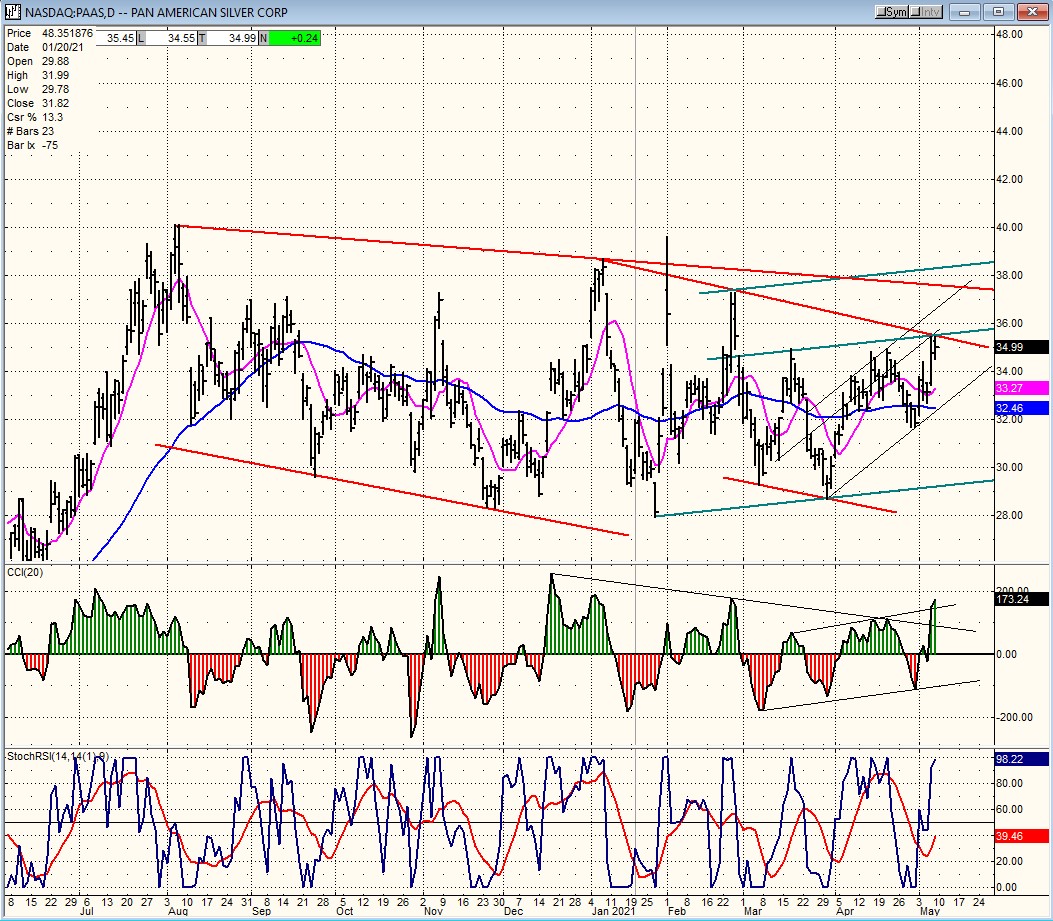
PAAS (Pan American Silver Corp-DLY)
PAAS found resistance from a secondary trend line 35 and is consolidating. It may not remain there for long since the oscillators and the P&F chart suggest a move to 39-40 could take place, next.
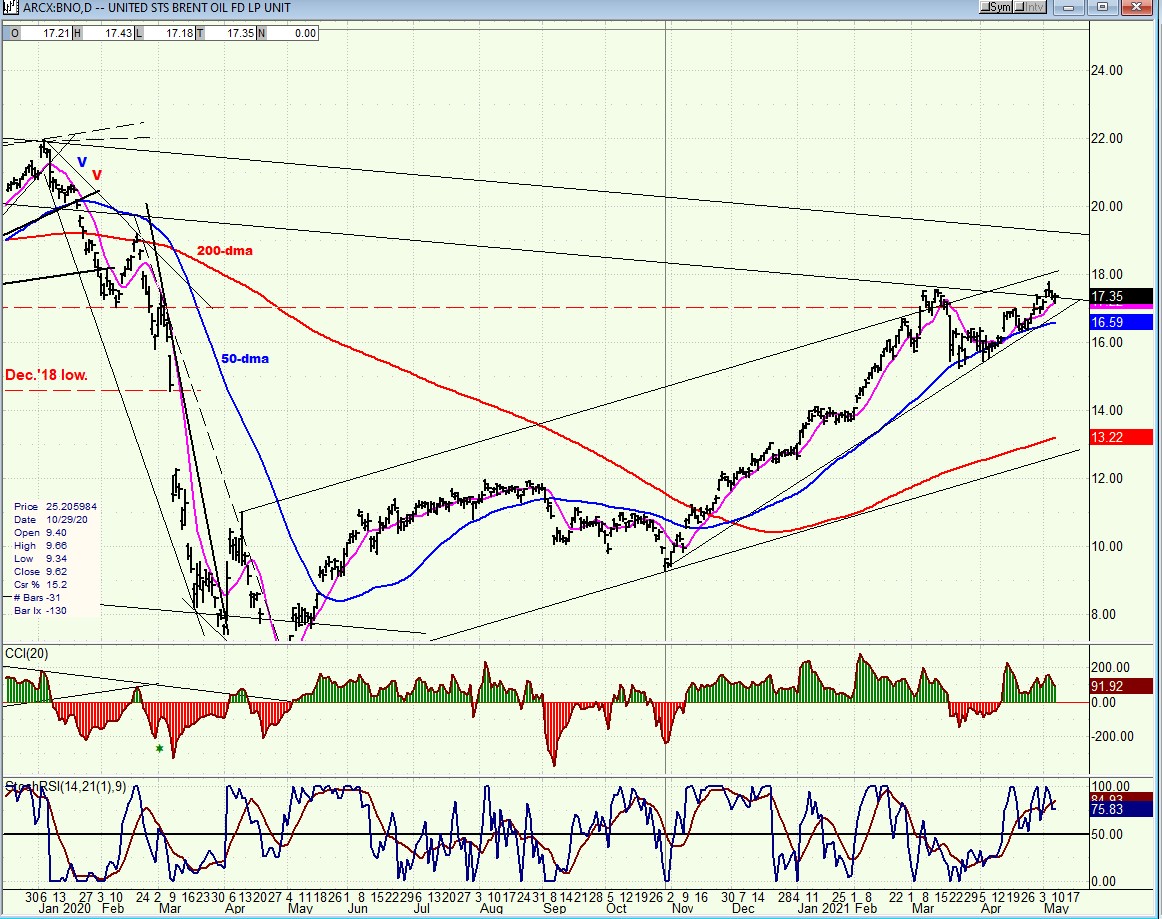
BNO (Brent oil fund) DLY.
With negative divergence showing in its CCI, BNO may need to pull back for some additional consolidation before pushing to a new high.
SUMMARY
SPX was not able to extend its 100-point correction and made a new high. It is possible that phase two is not yet complete.
Free trial subscription
With a trial subscription, you will have access to the same information that is given to paid subscribers, but for a limited time-period. Over the years, I have developed an expertise in P&F charting (price projection), cycles (timing), EWT (structure), and general technical analysis which enables me to warn subscribers of pending reversals in market trends, and how far that trend can potentially carry. For a FREE 2-week trial, subscription options, and payment plans I encourage you to visit my website at www.marketurningpoints.com.
The above comments and those made in the daily updates and the Market Summary about the financial markets are based purely on what I consider to be sound technical analysis principles. They represent my own opinion and are not meant to be construed as trading or investment advice but are offered as an analytical point of view which might be of interest to those who follow stock market cycles and technical analysis.
********

When Andre Gratian was a stock broker years ago, a friend introduced him to technical analysis of the market. Consequently, it is not an exaggeration to say that Andre fell in love with this approach! Ever since then, it has become an increasingly important part of his professional life. Gratian has studied the works of Wyckoff, Edwards & Magee, Edward J. Dewey (cycles) and many others. However, one of my most profitable undertaking has probably been to study Point & Figure charting, which he finds invaluable in analyzing stocks and indices. If he were restricted to one methodology, this is the one that he would choose. This well-rounded background has given him what he feels to be a special insight into the stock market, facilitating the recognition of meaningful patterns and the ‘turning points’ in all trends, whether they be short or long term. Andre feels very comfortable discussing the stock market and passing on meaningful information to others. His subscribers include individuals and money managers throughout the world. Moreover, his Newsletters are currently published on several financial sites, here and abroad.
More from Gold-Eagle


